. 2023 Aug;620(7976):1047-1053.
doi: 10.1038/s41586-023-06428-3. Epub 2023 Jul 17.

OBOX regulates mouse zygotic genome activation and early development

Affiliations

OBOX regulates mouse zygotic genome activation and early development

Shuyan Ji et al. Nature. 2023 Aug.

Abstract

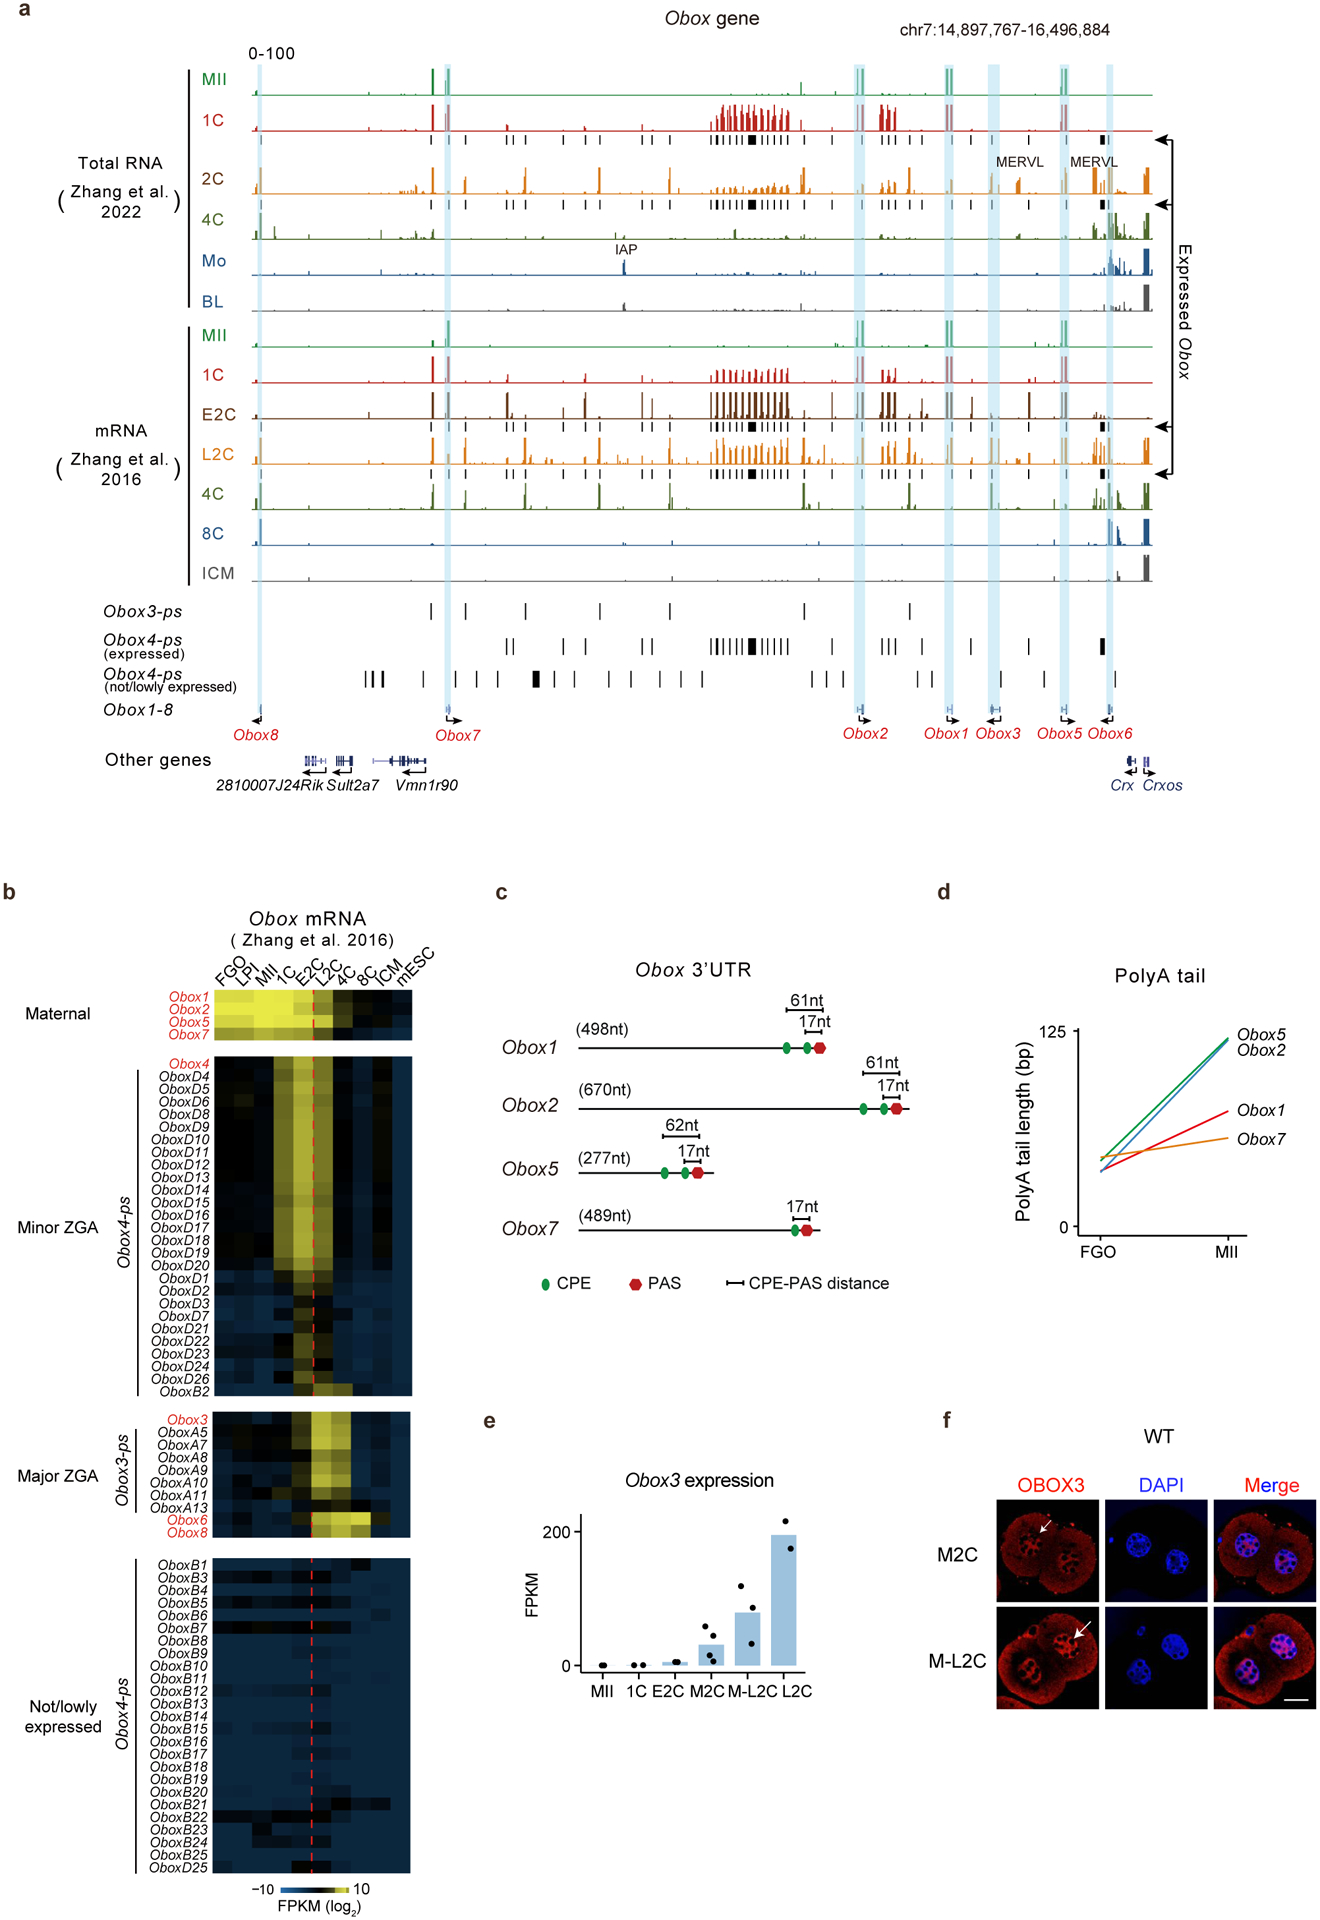
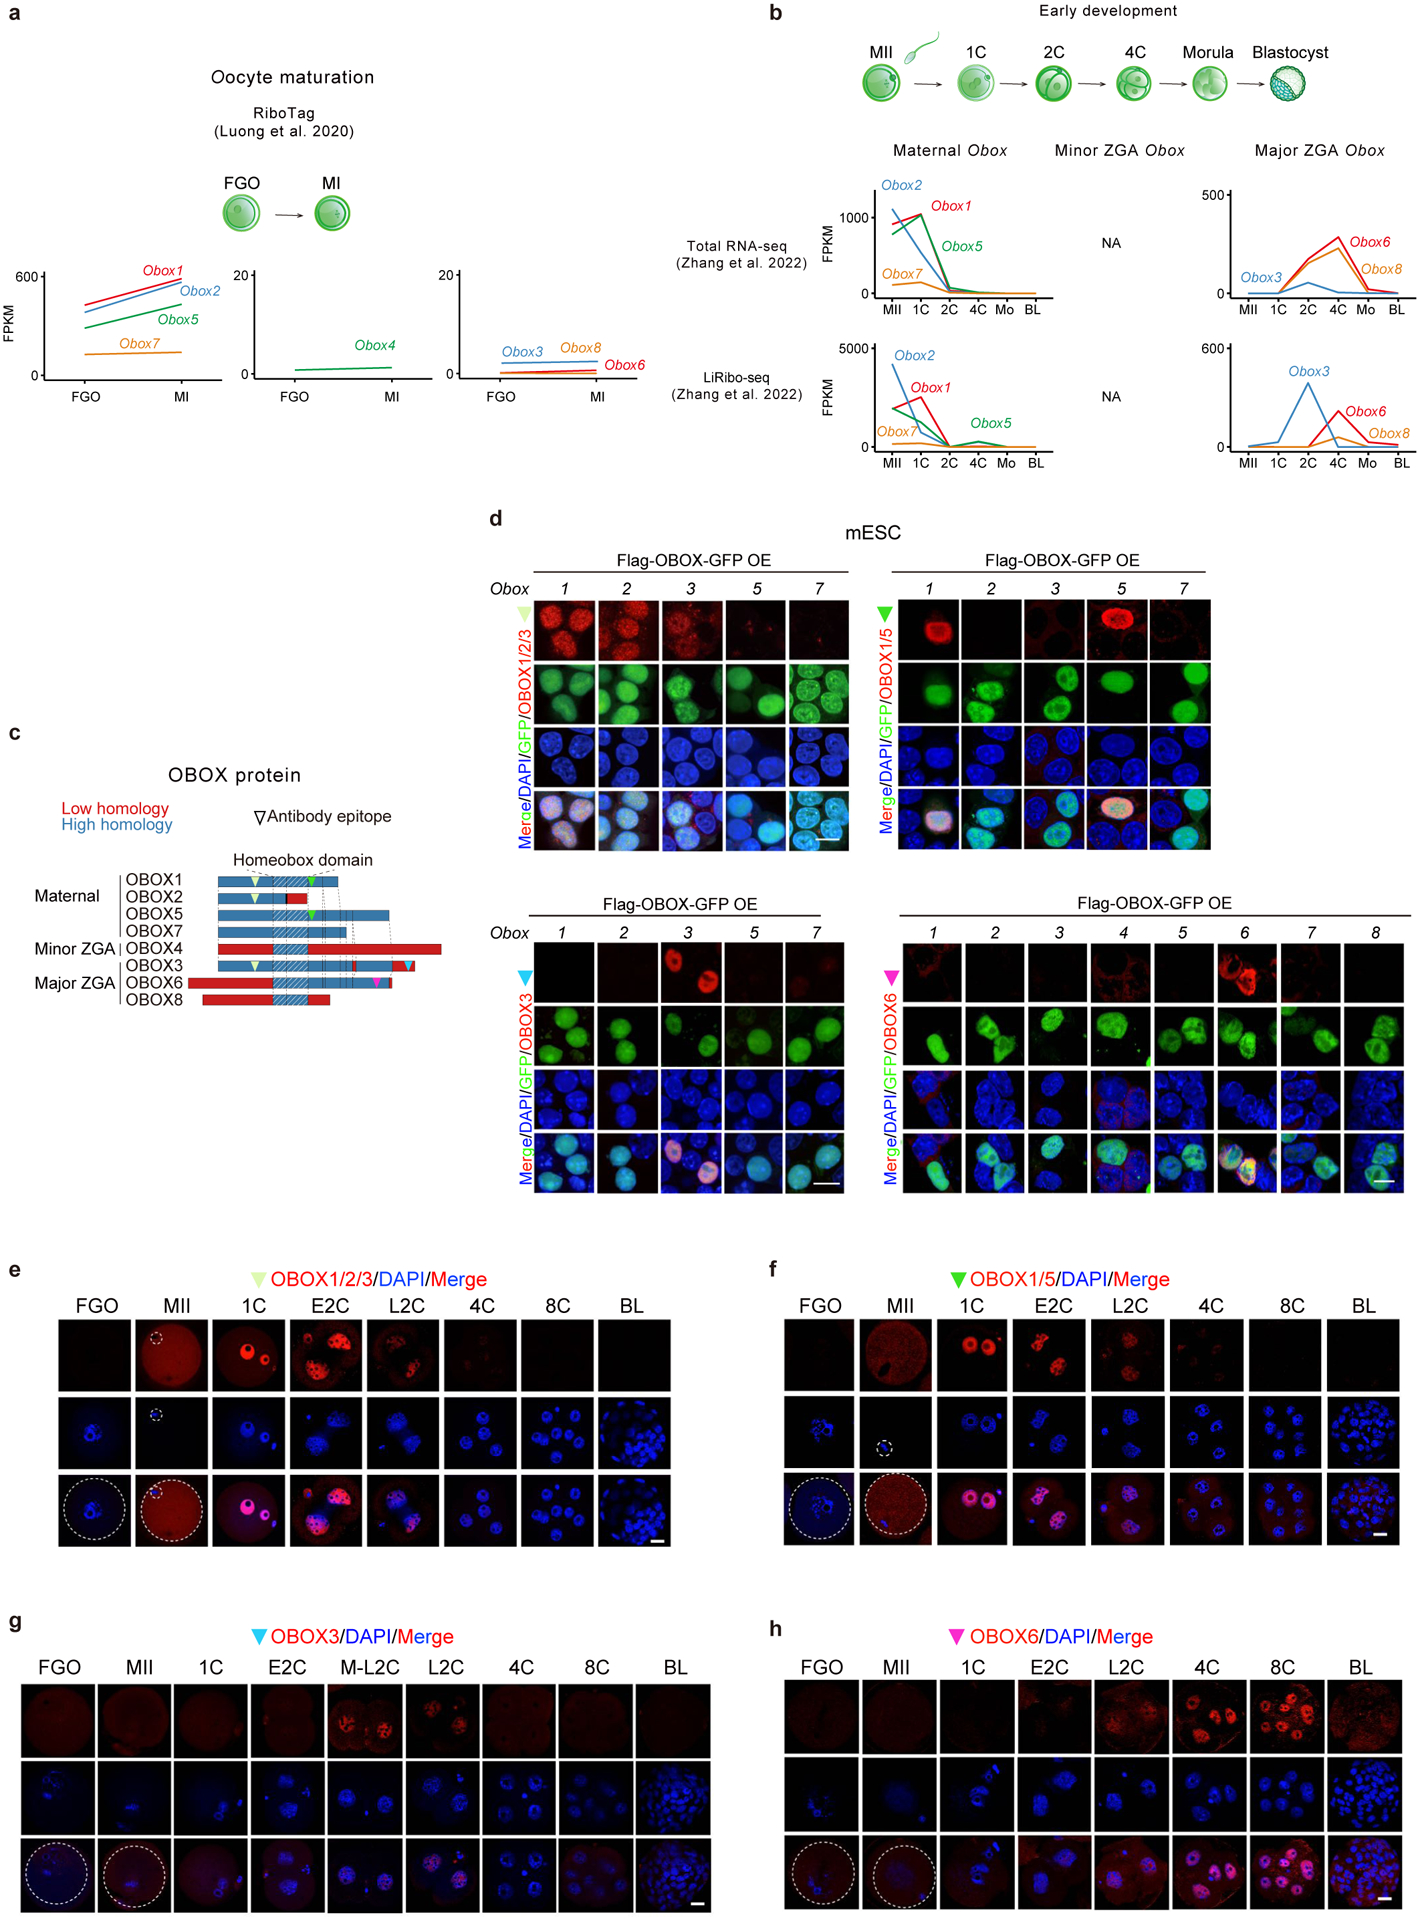
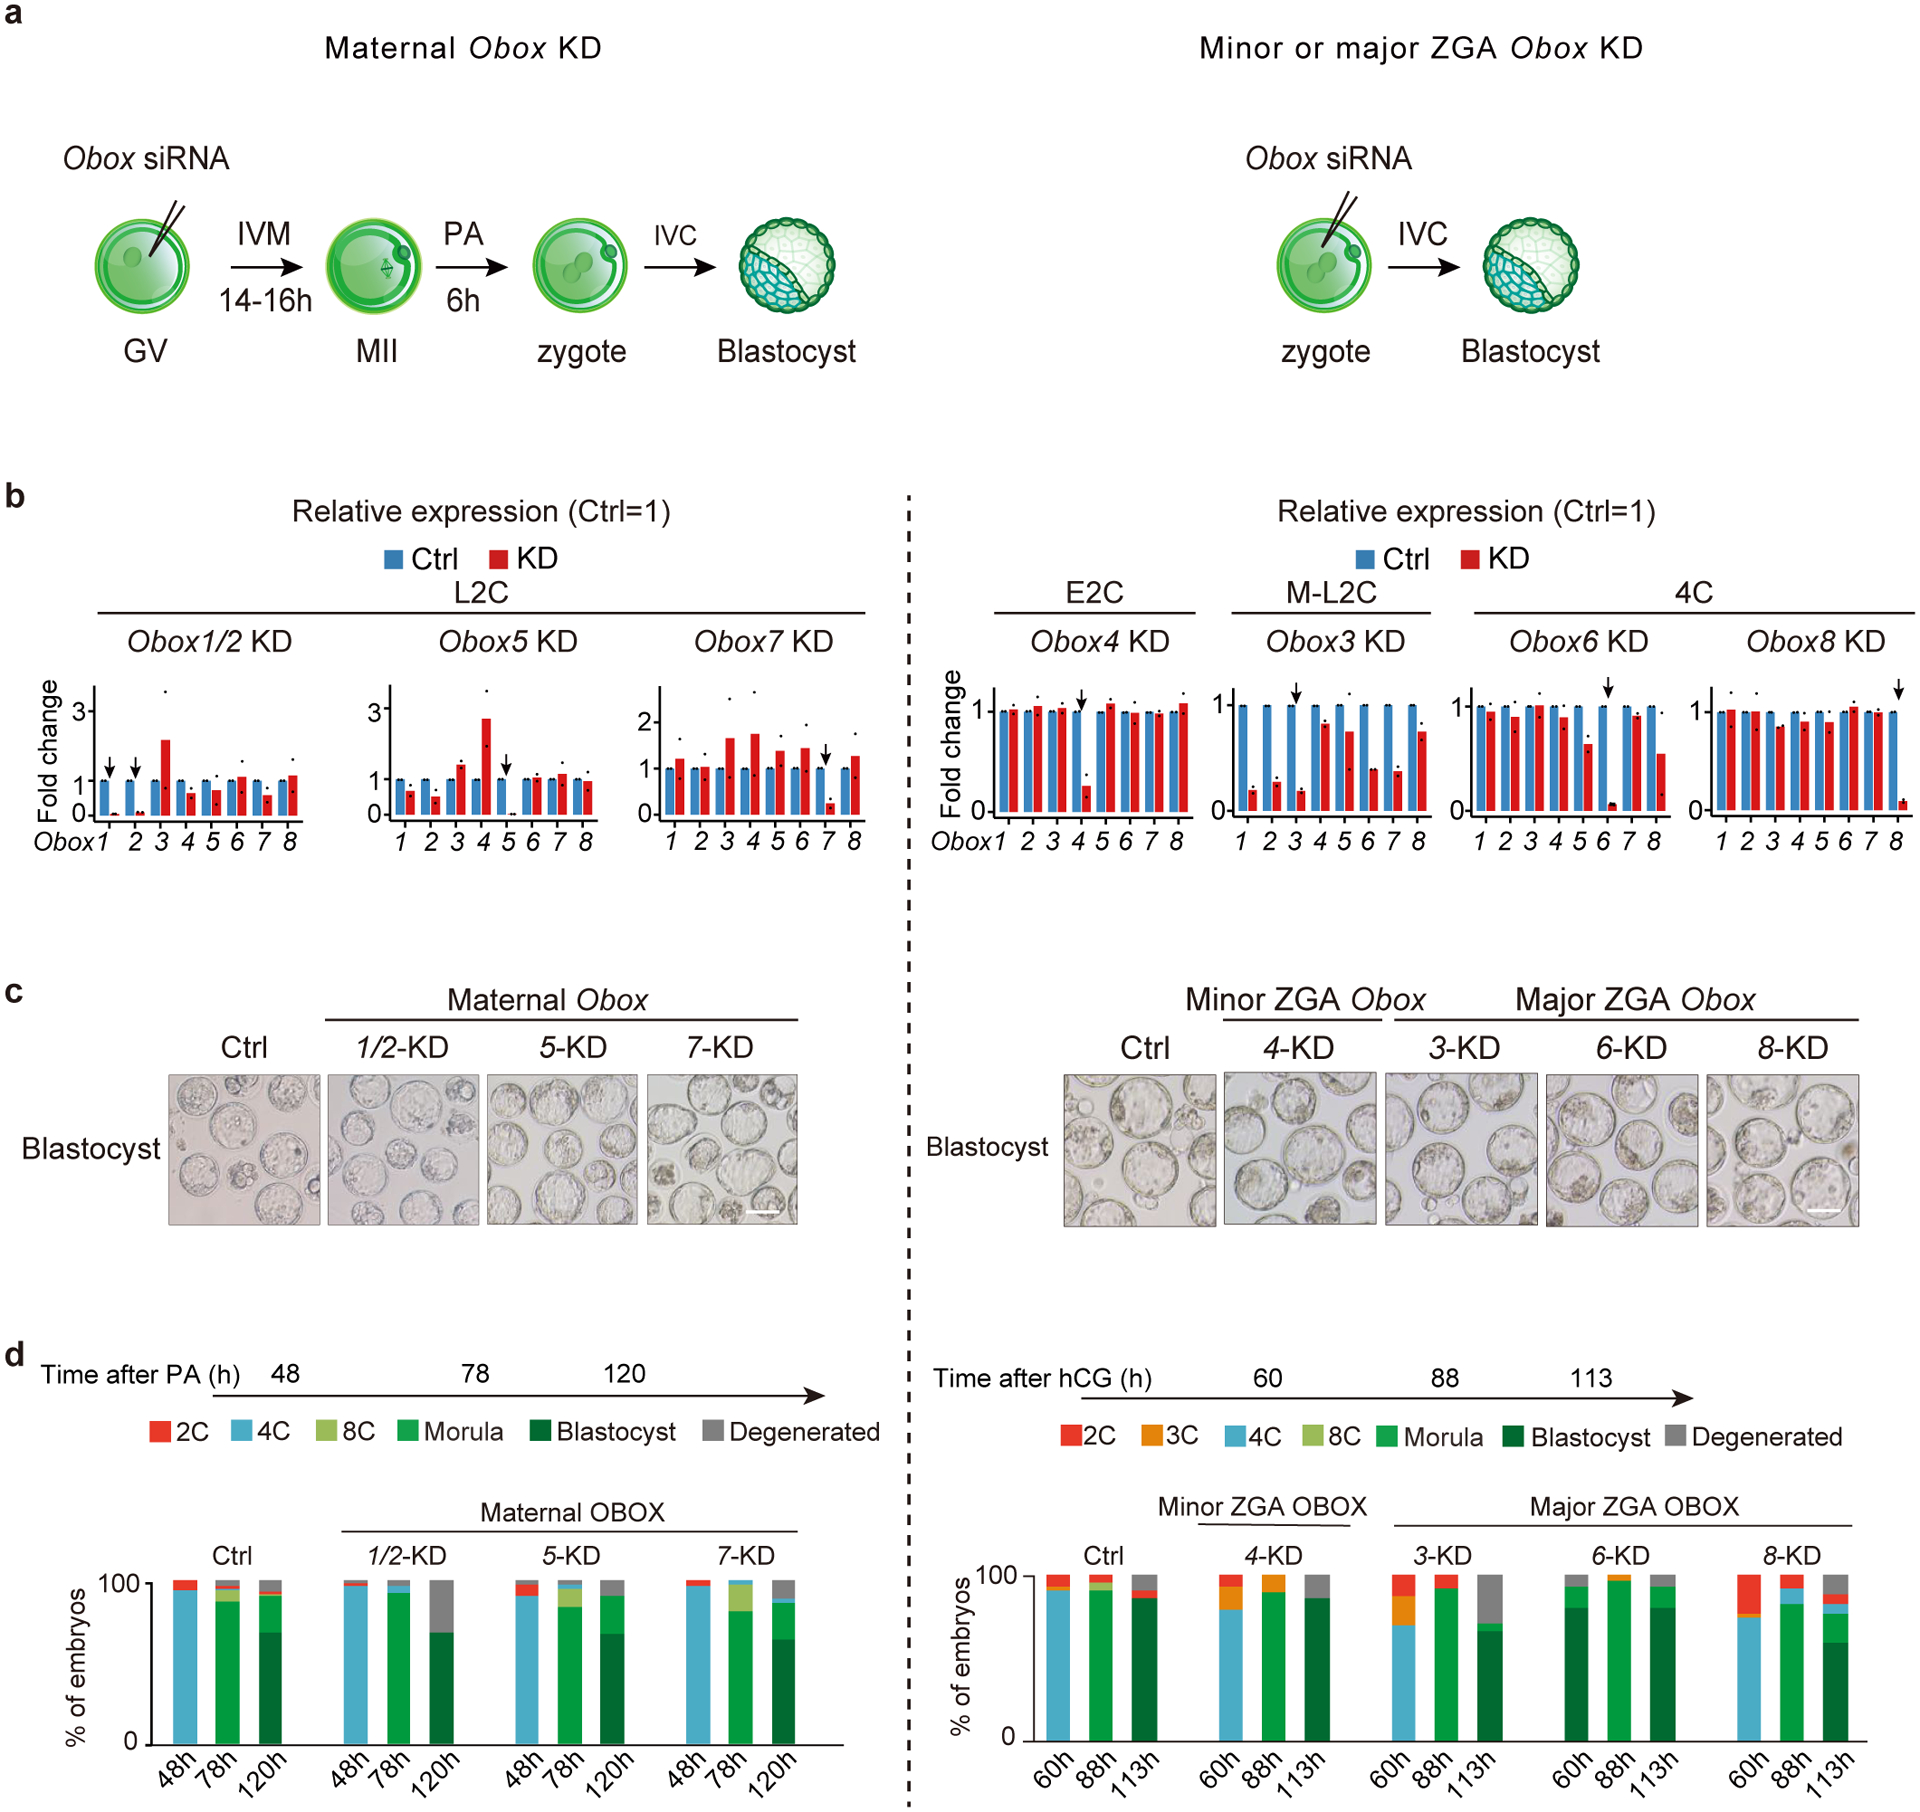
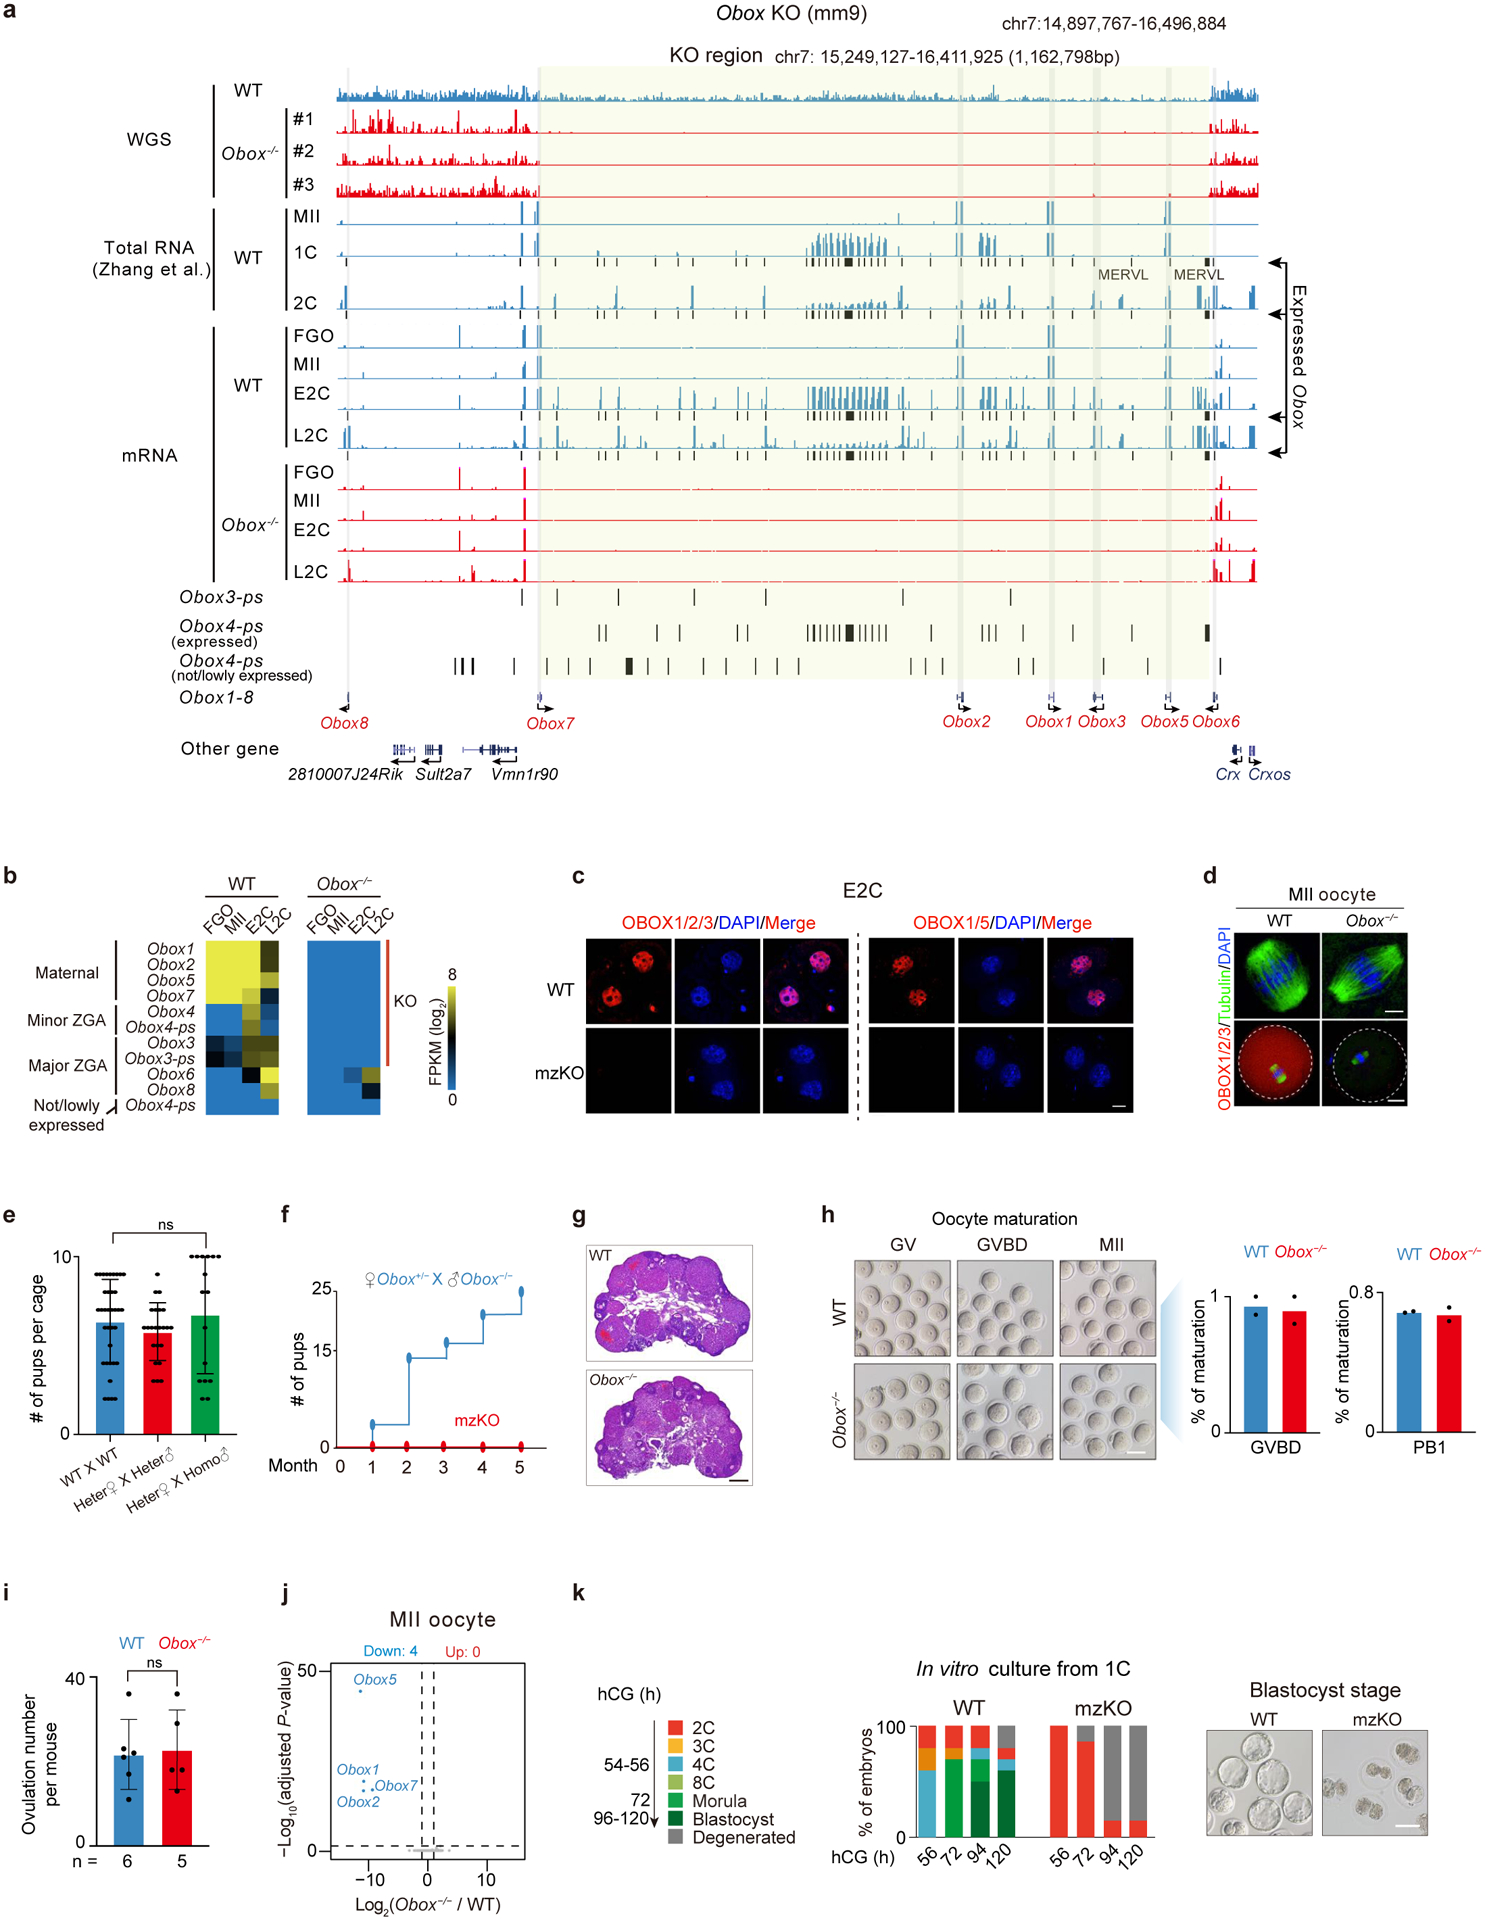
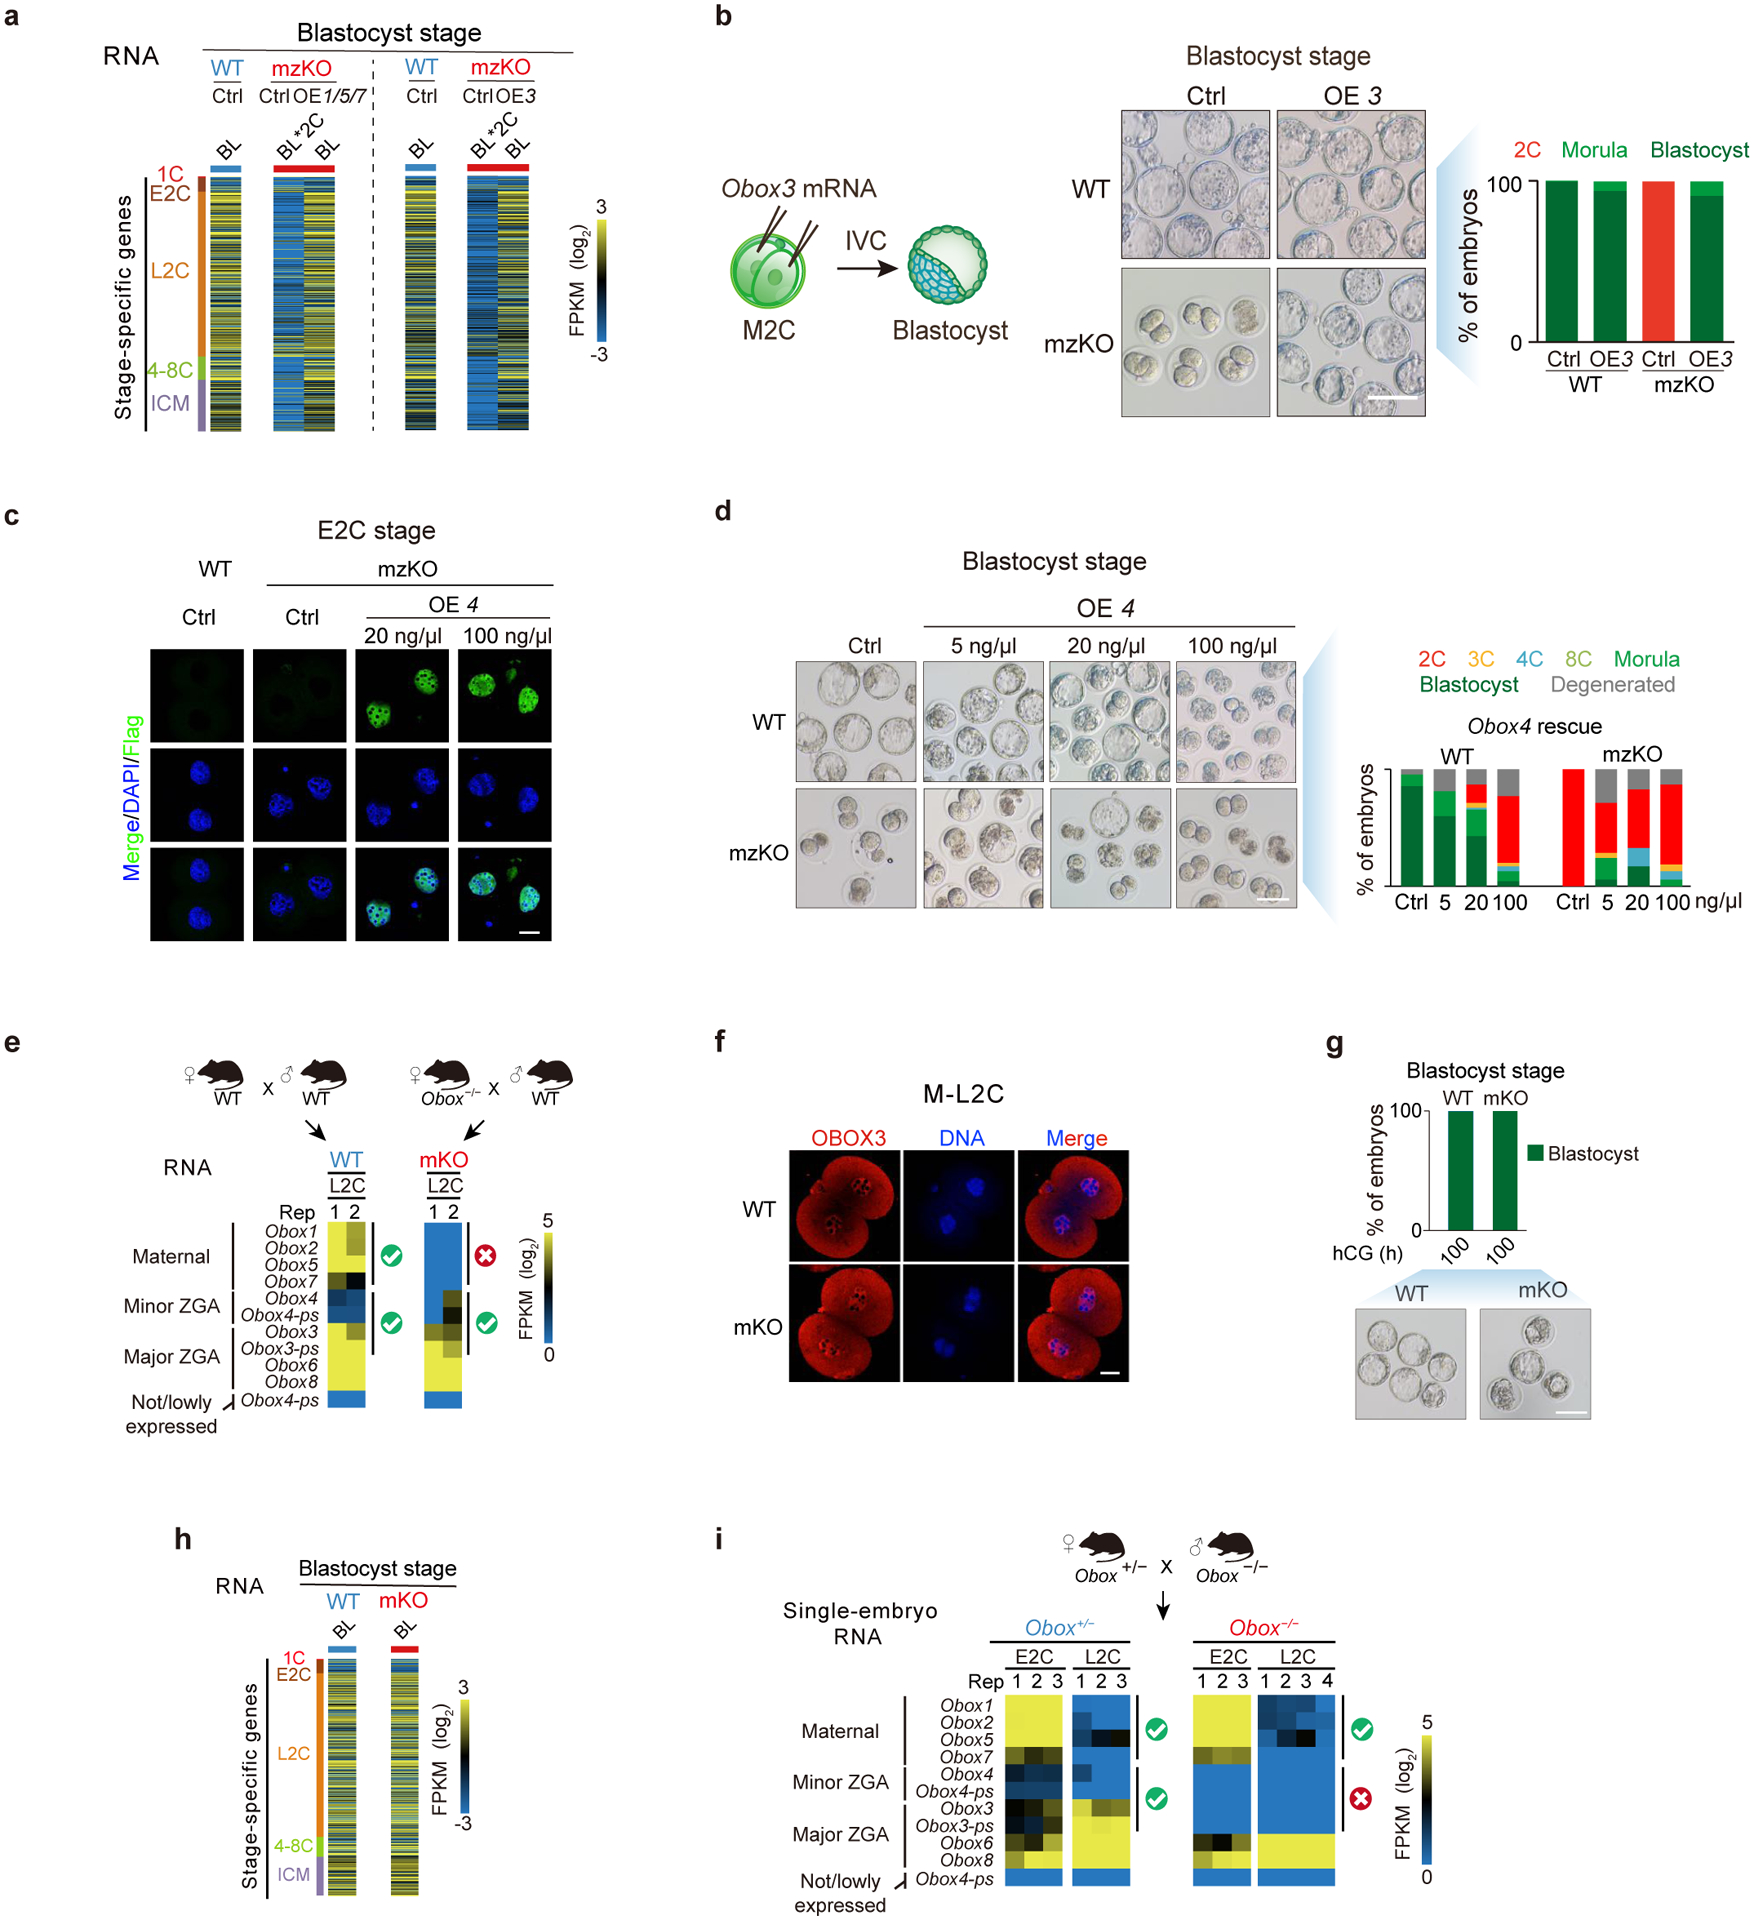
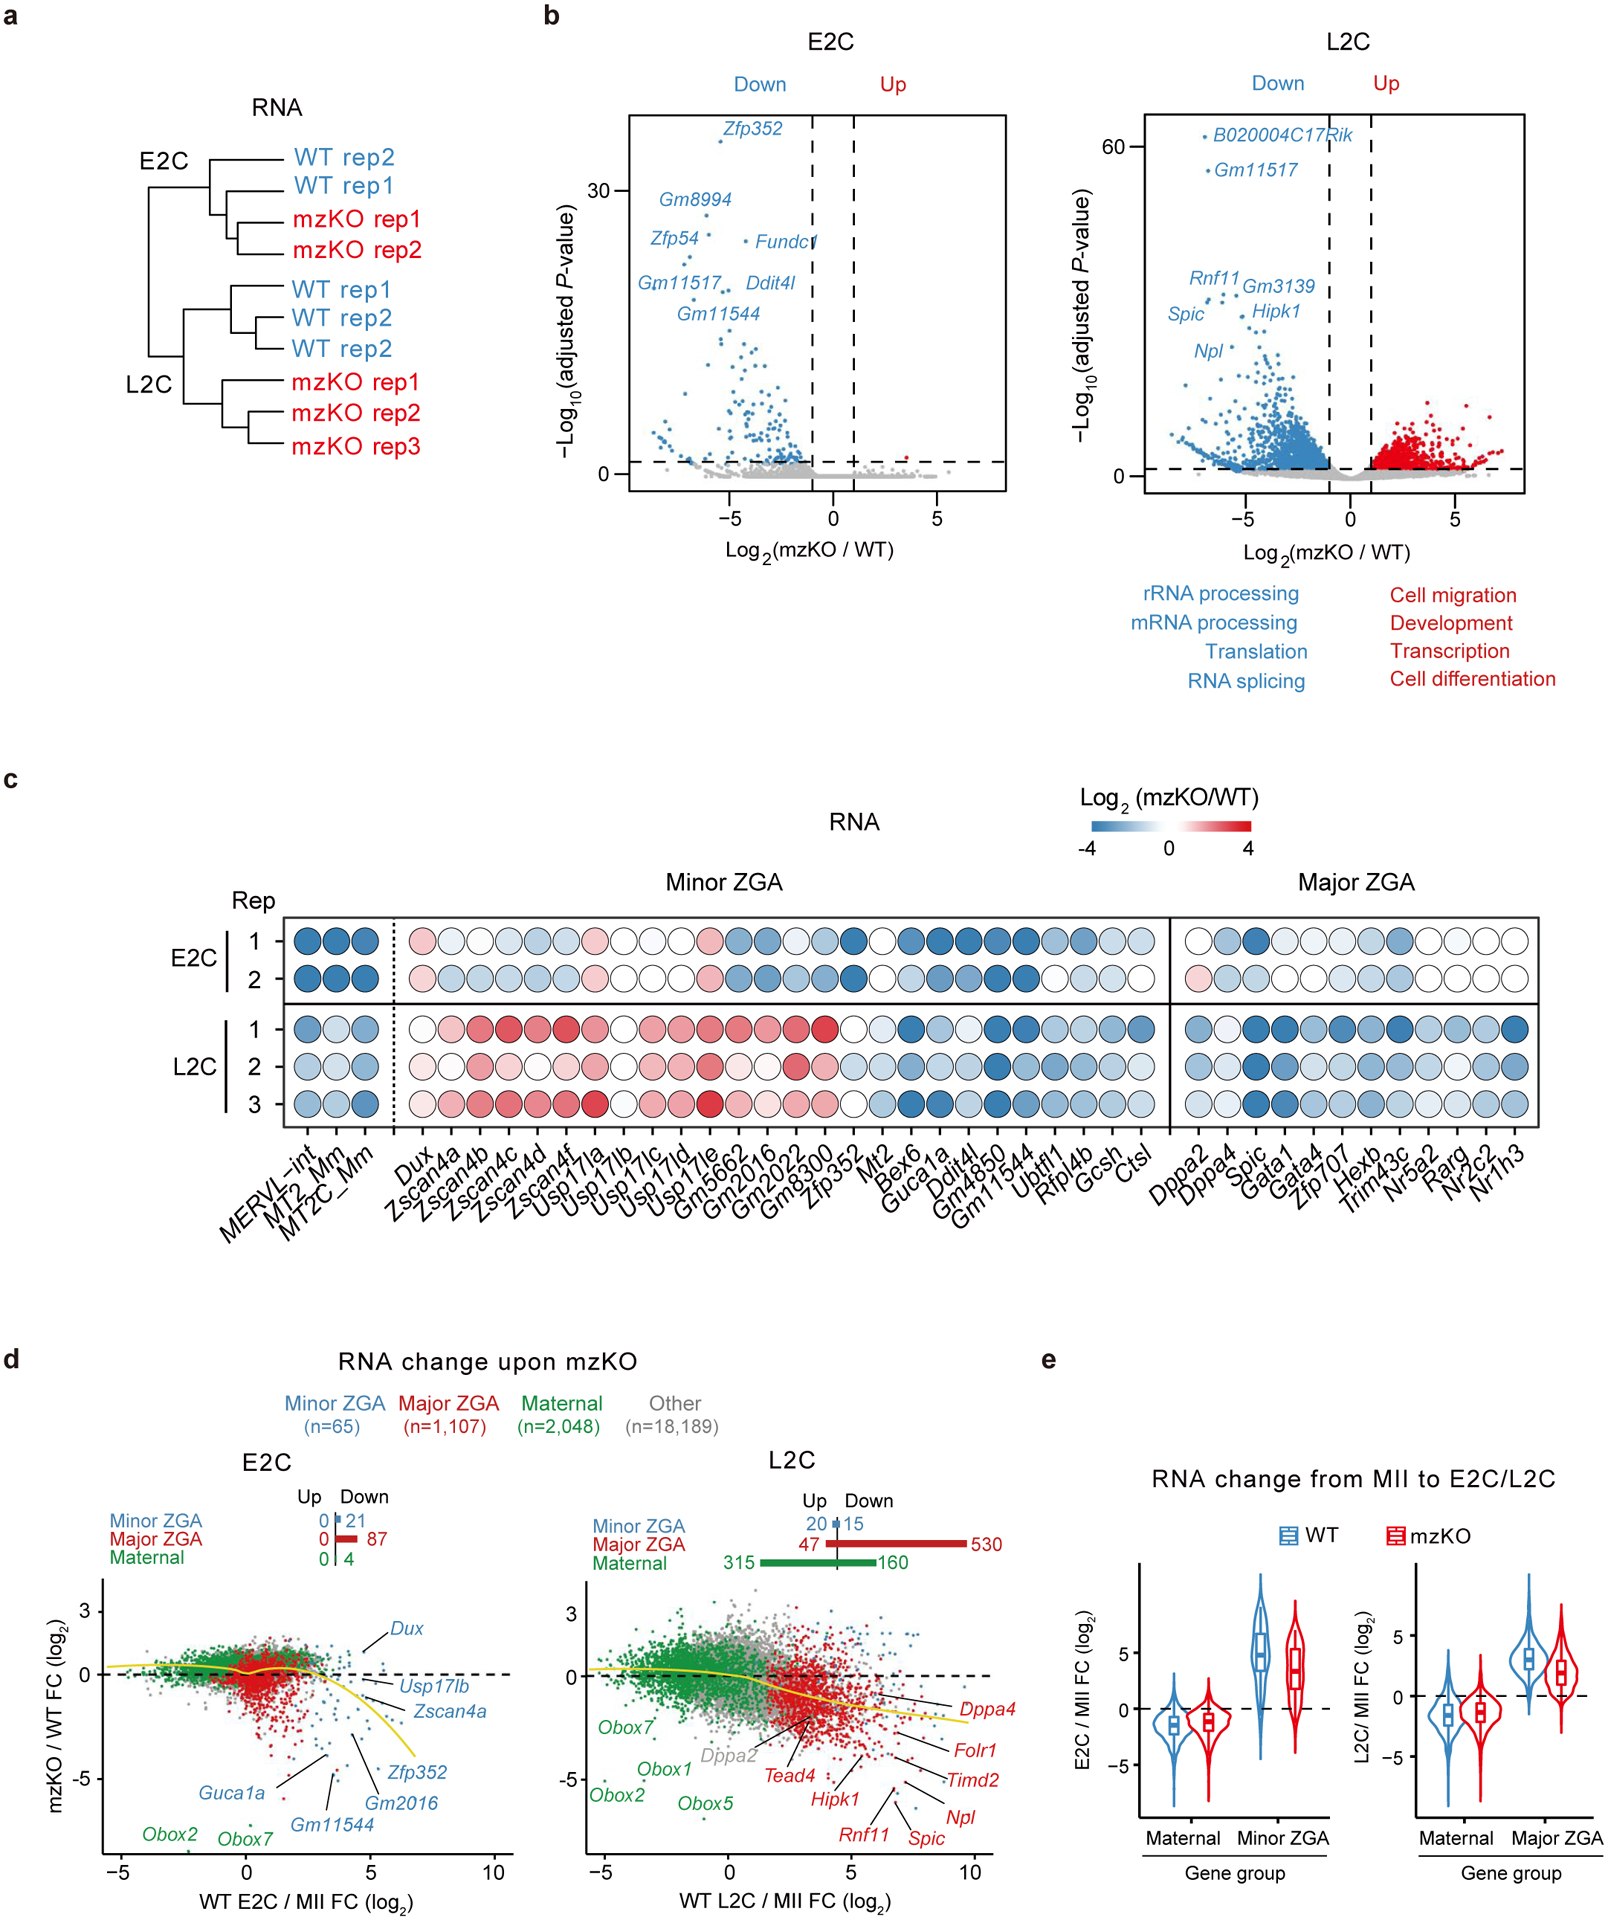
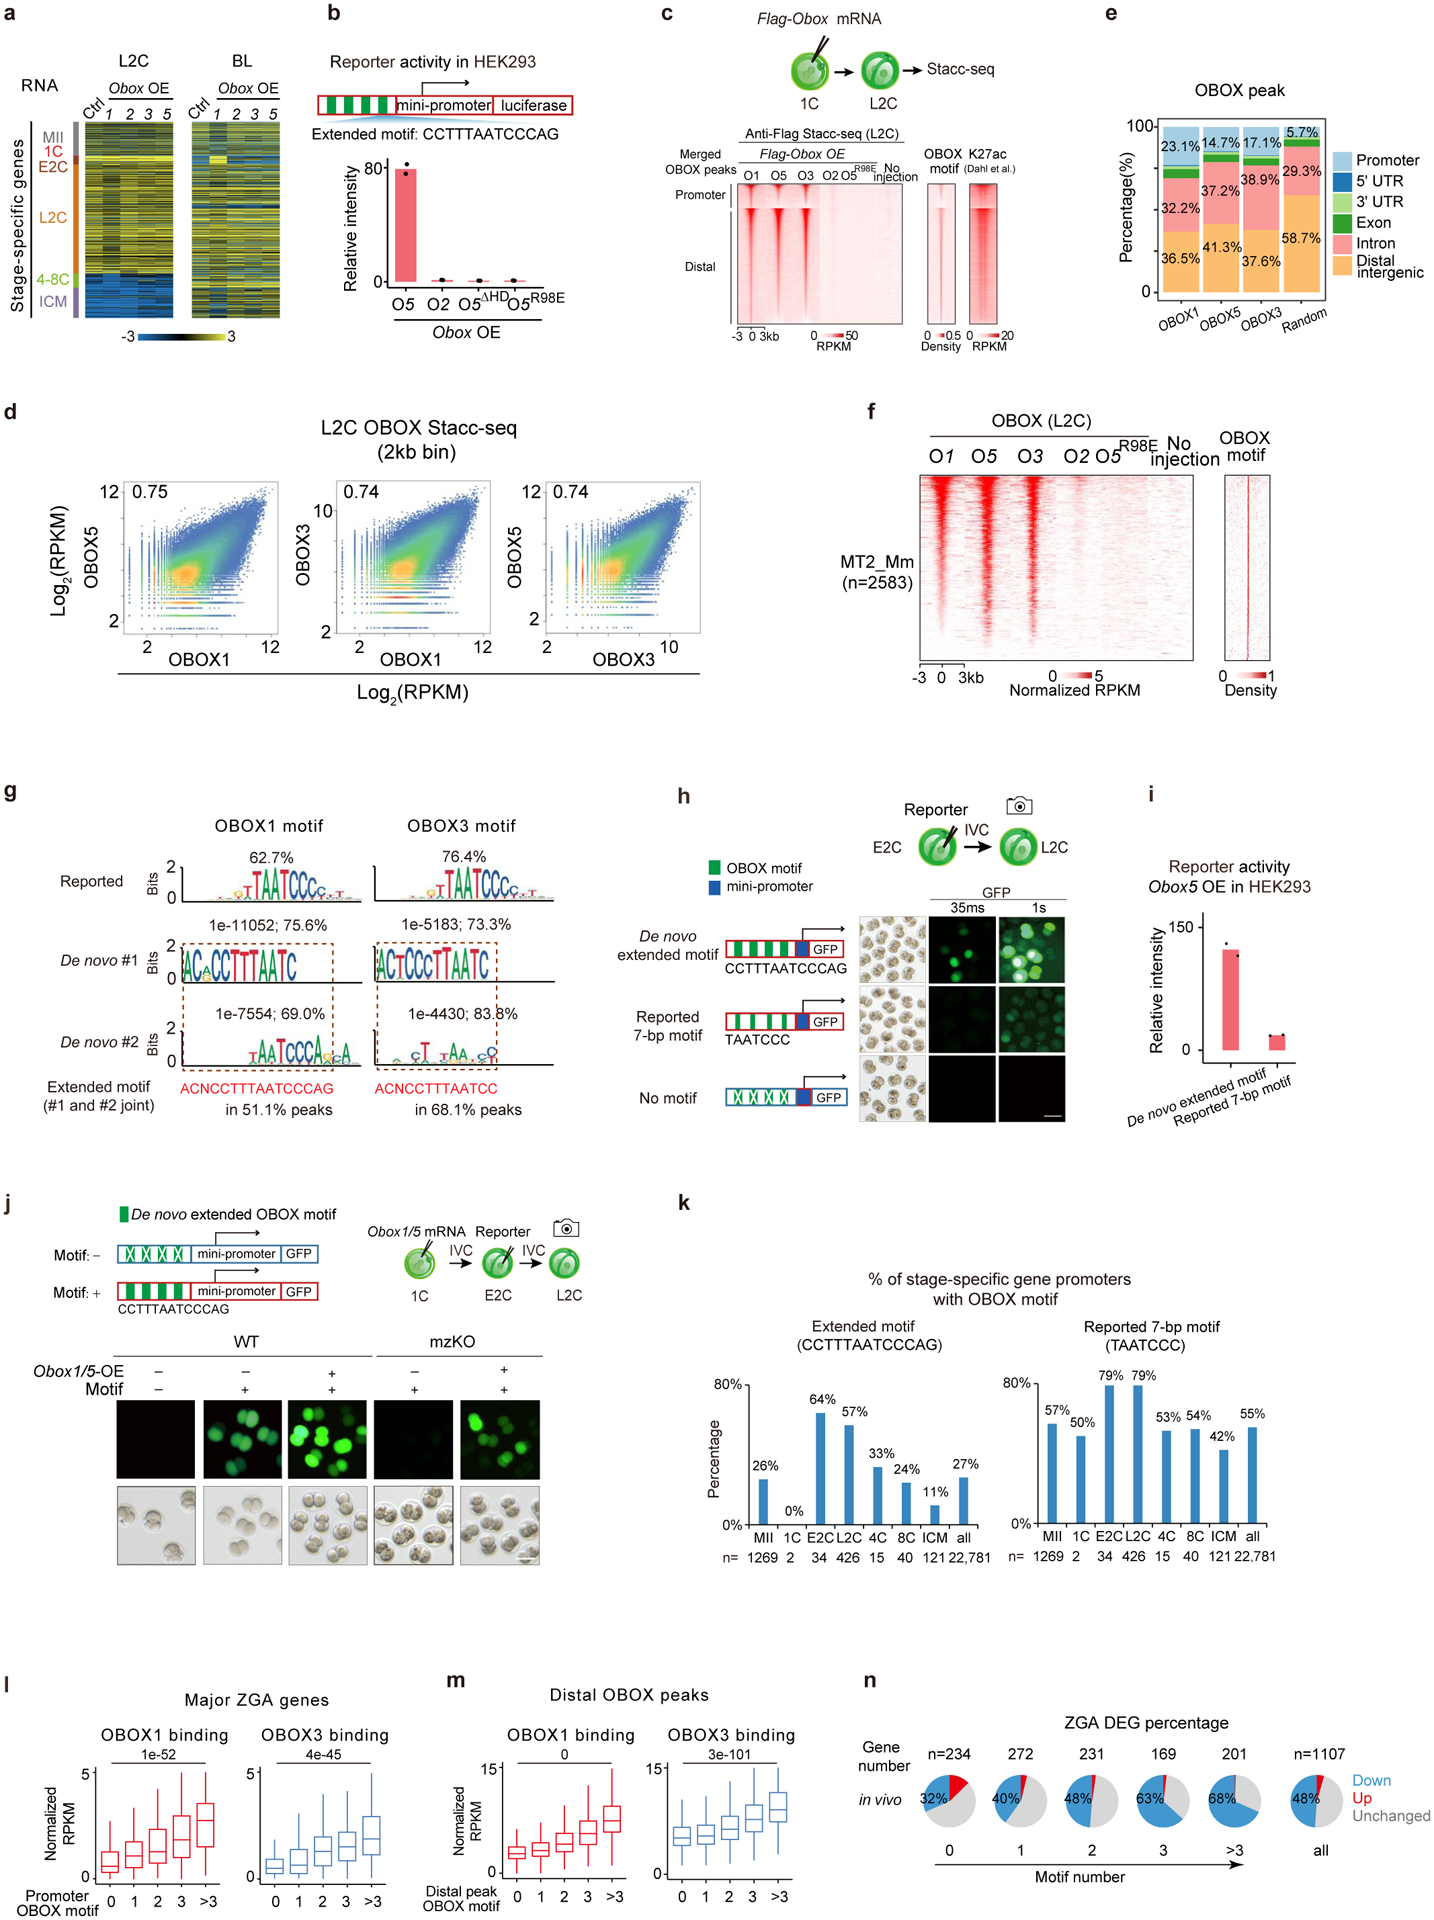
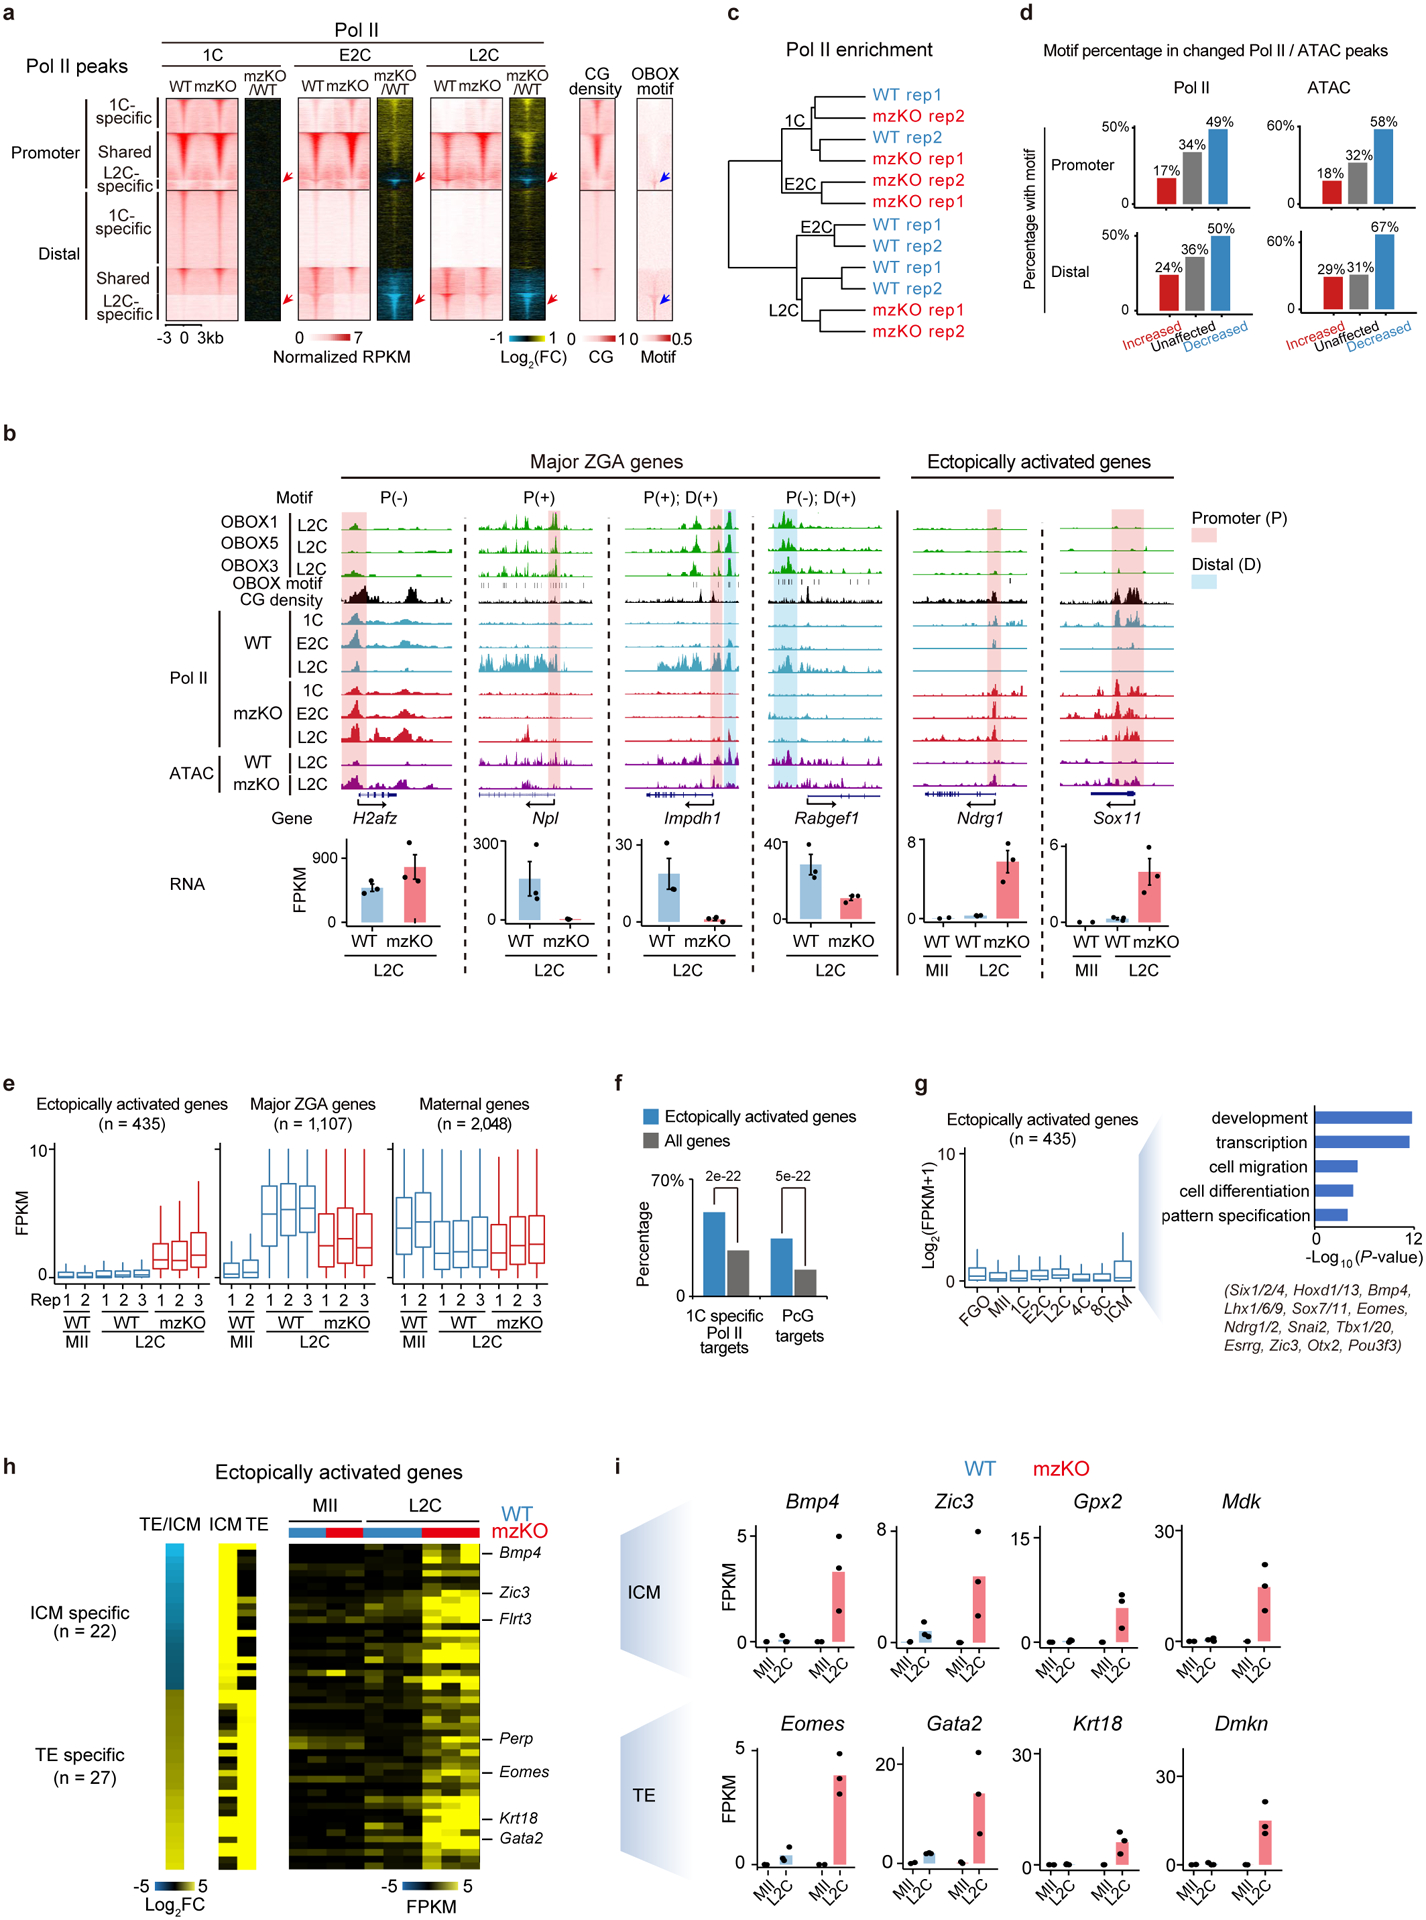
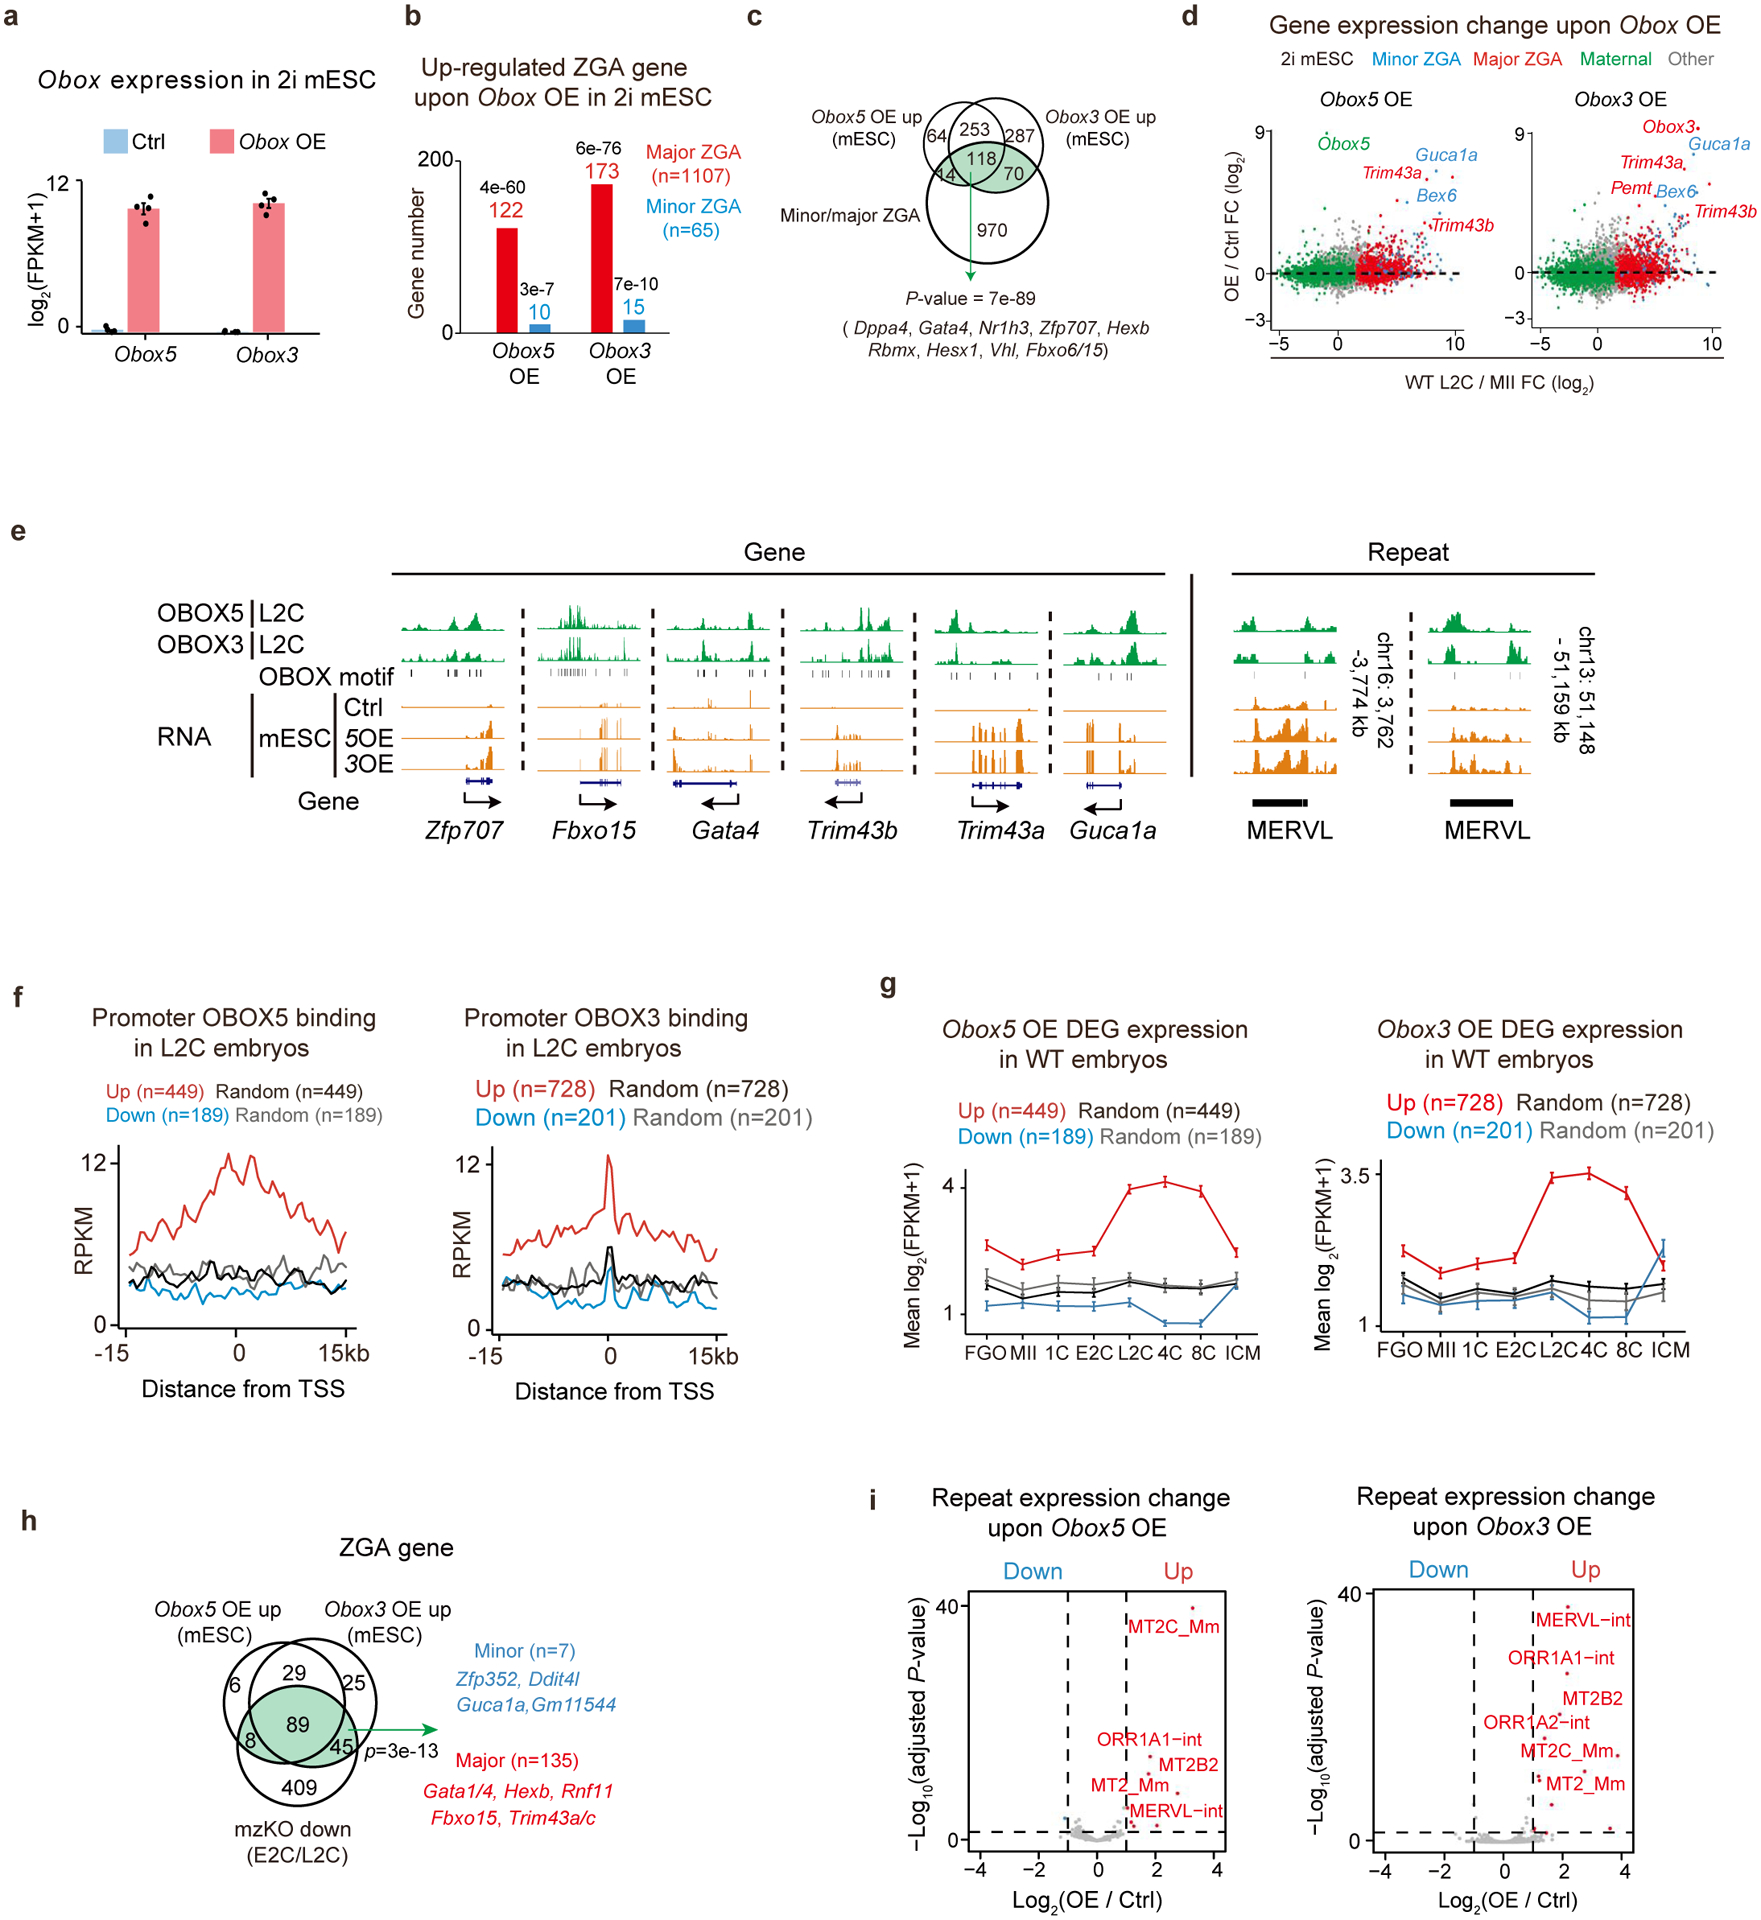
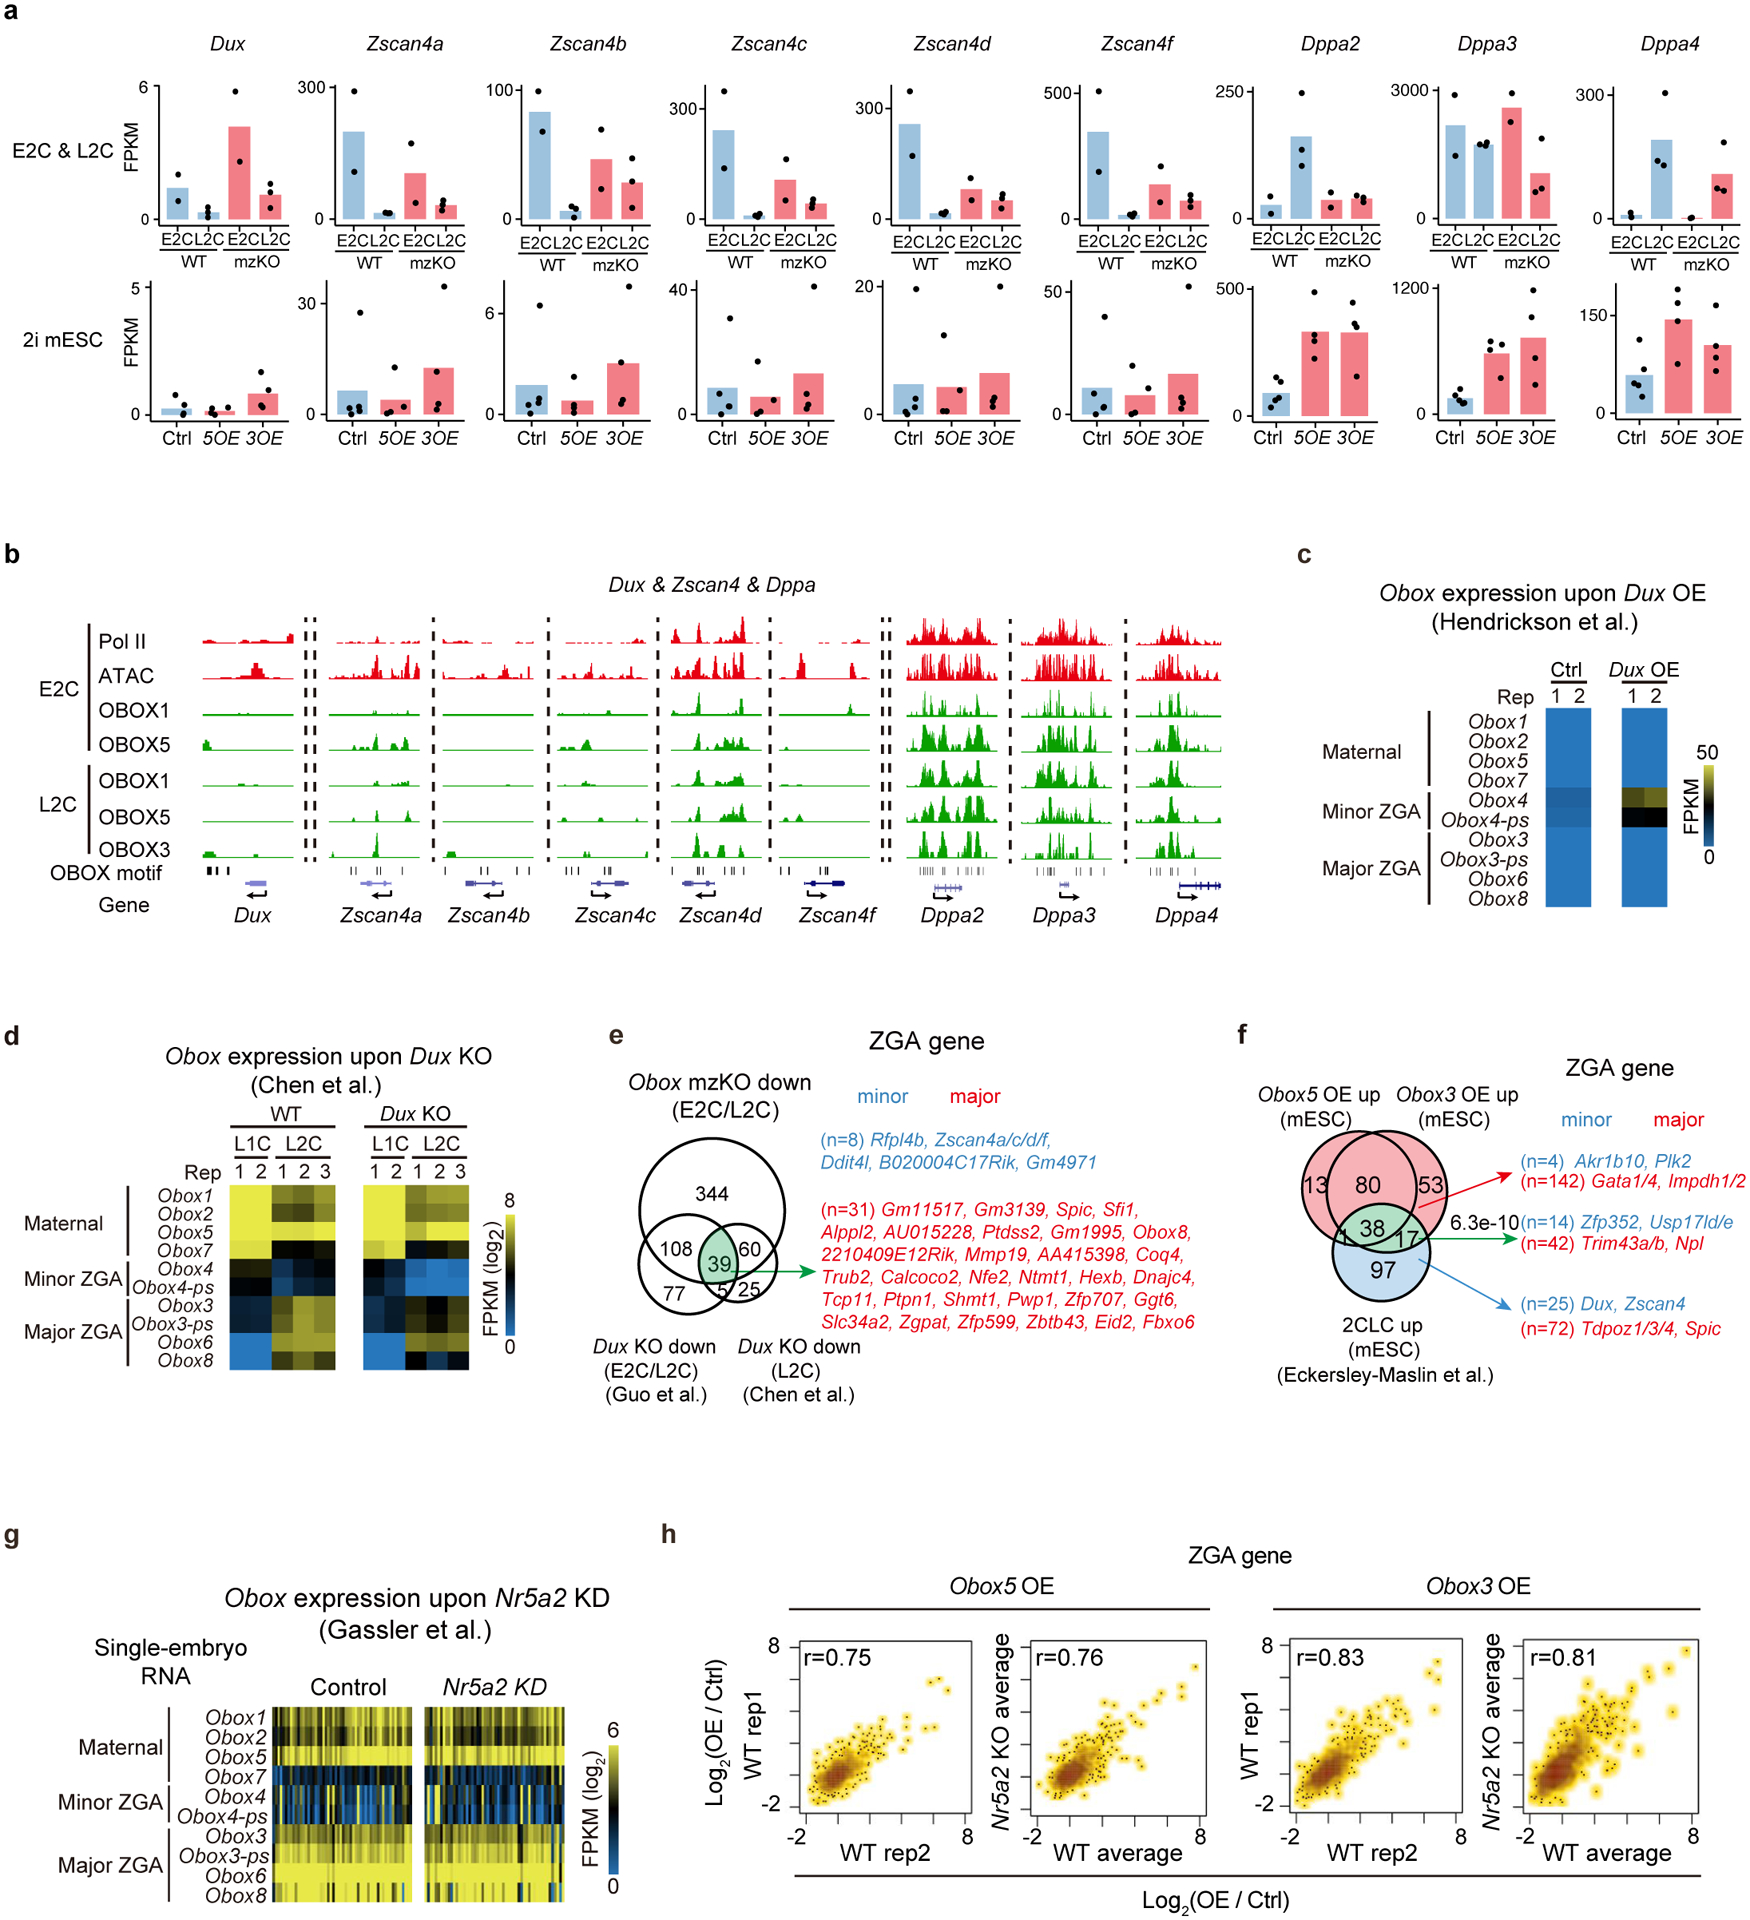
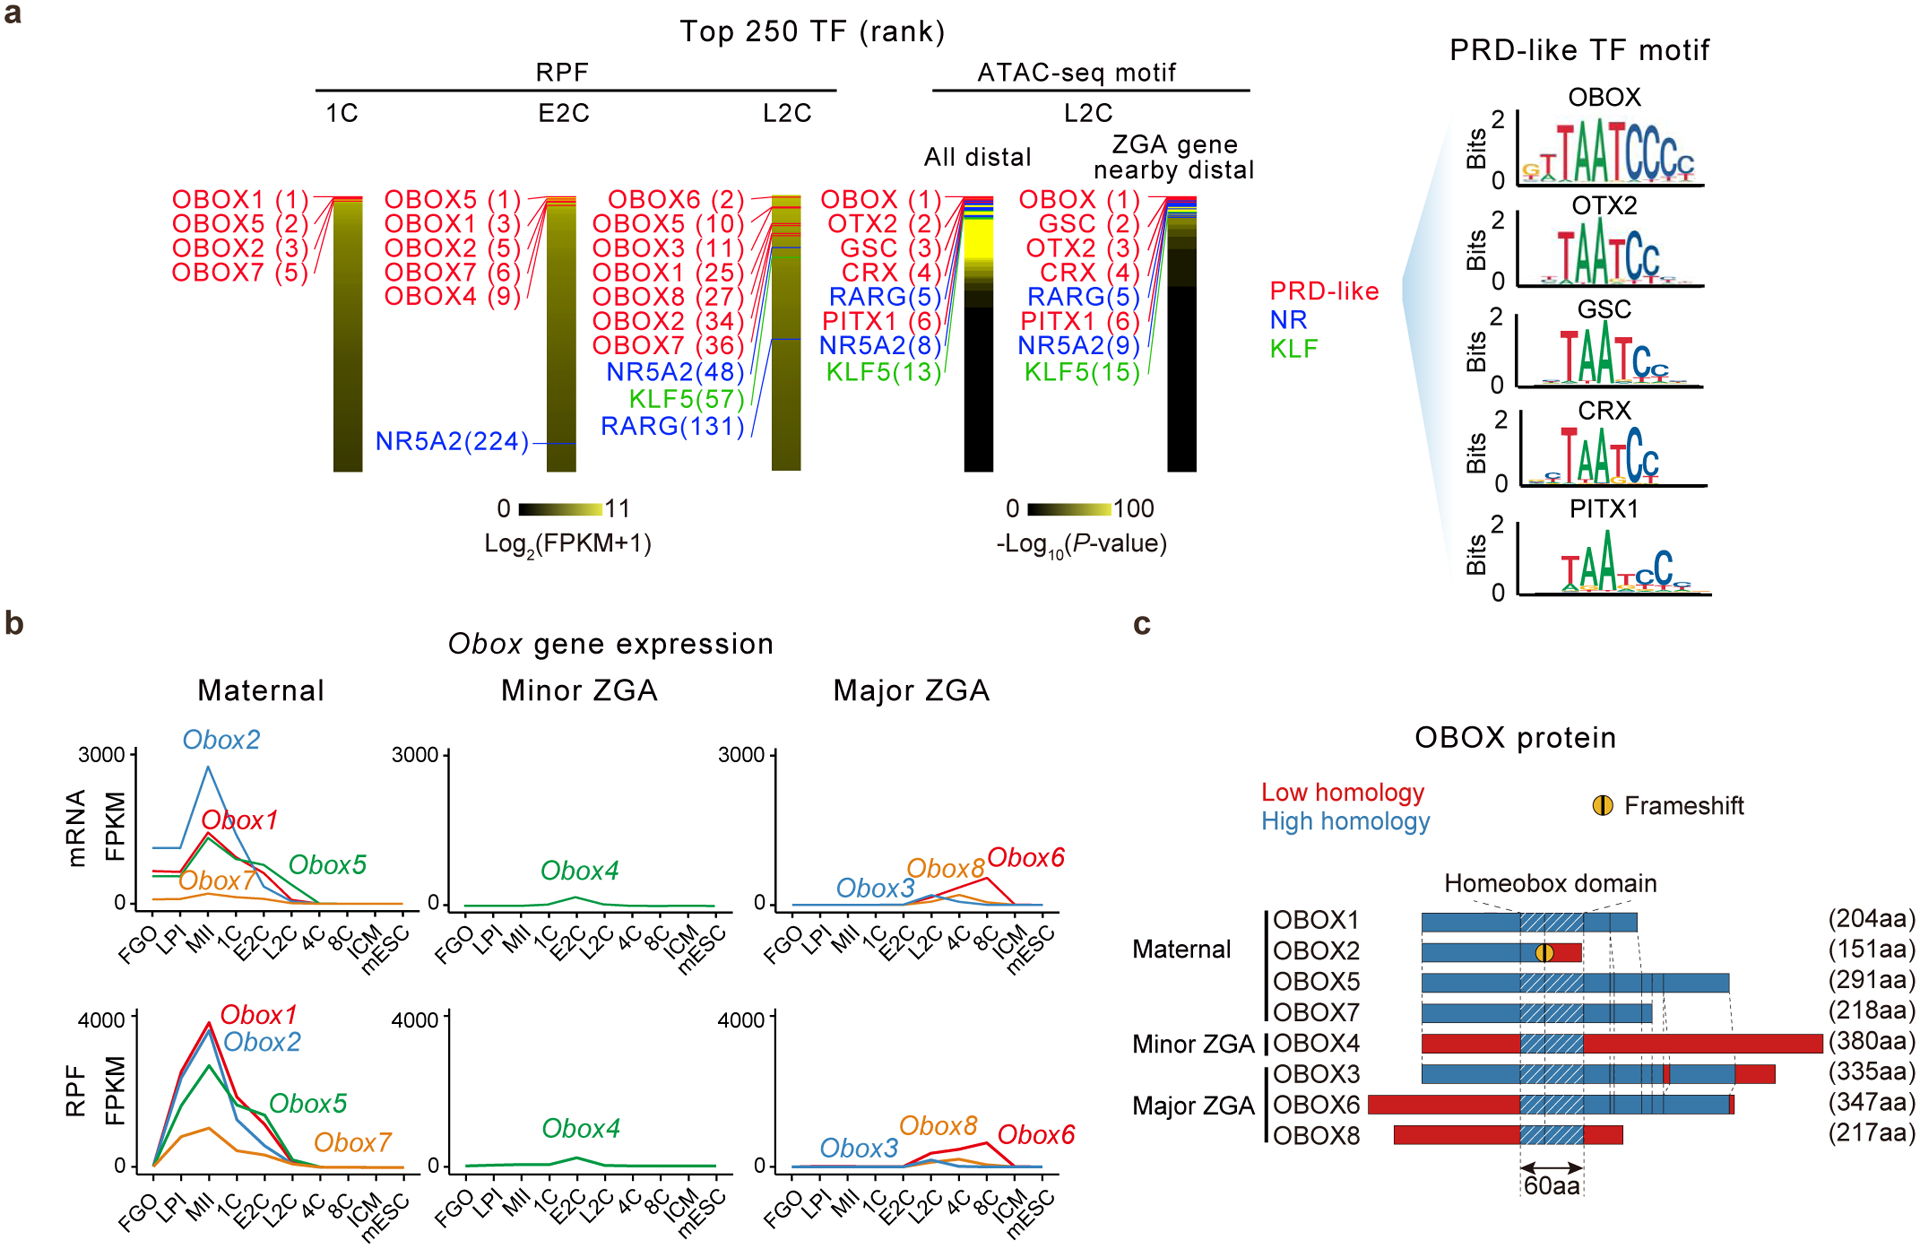
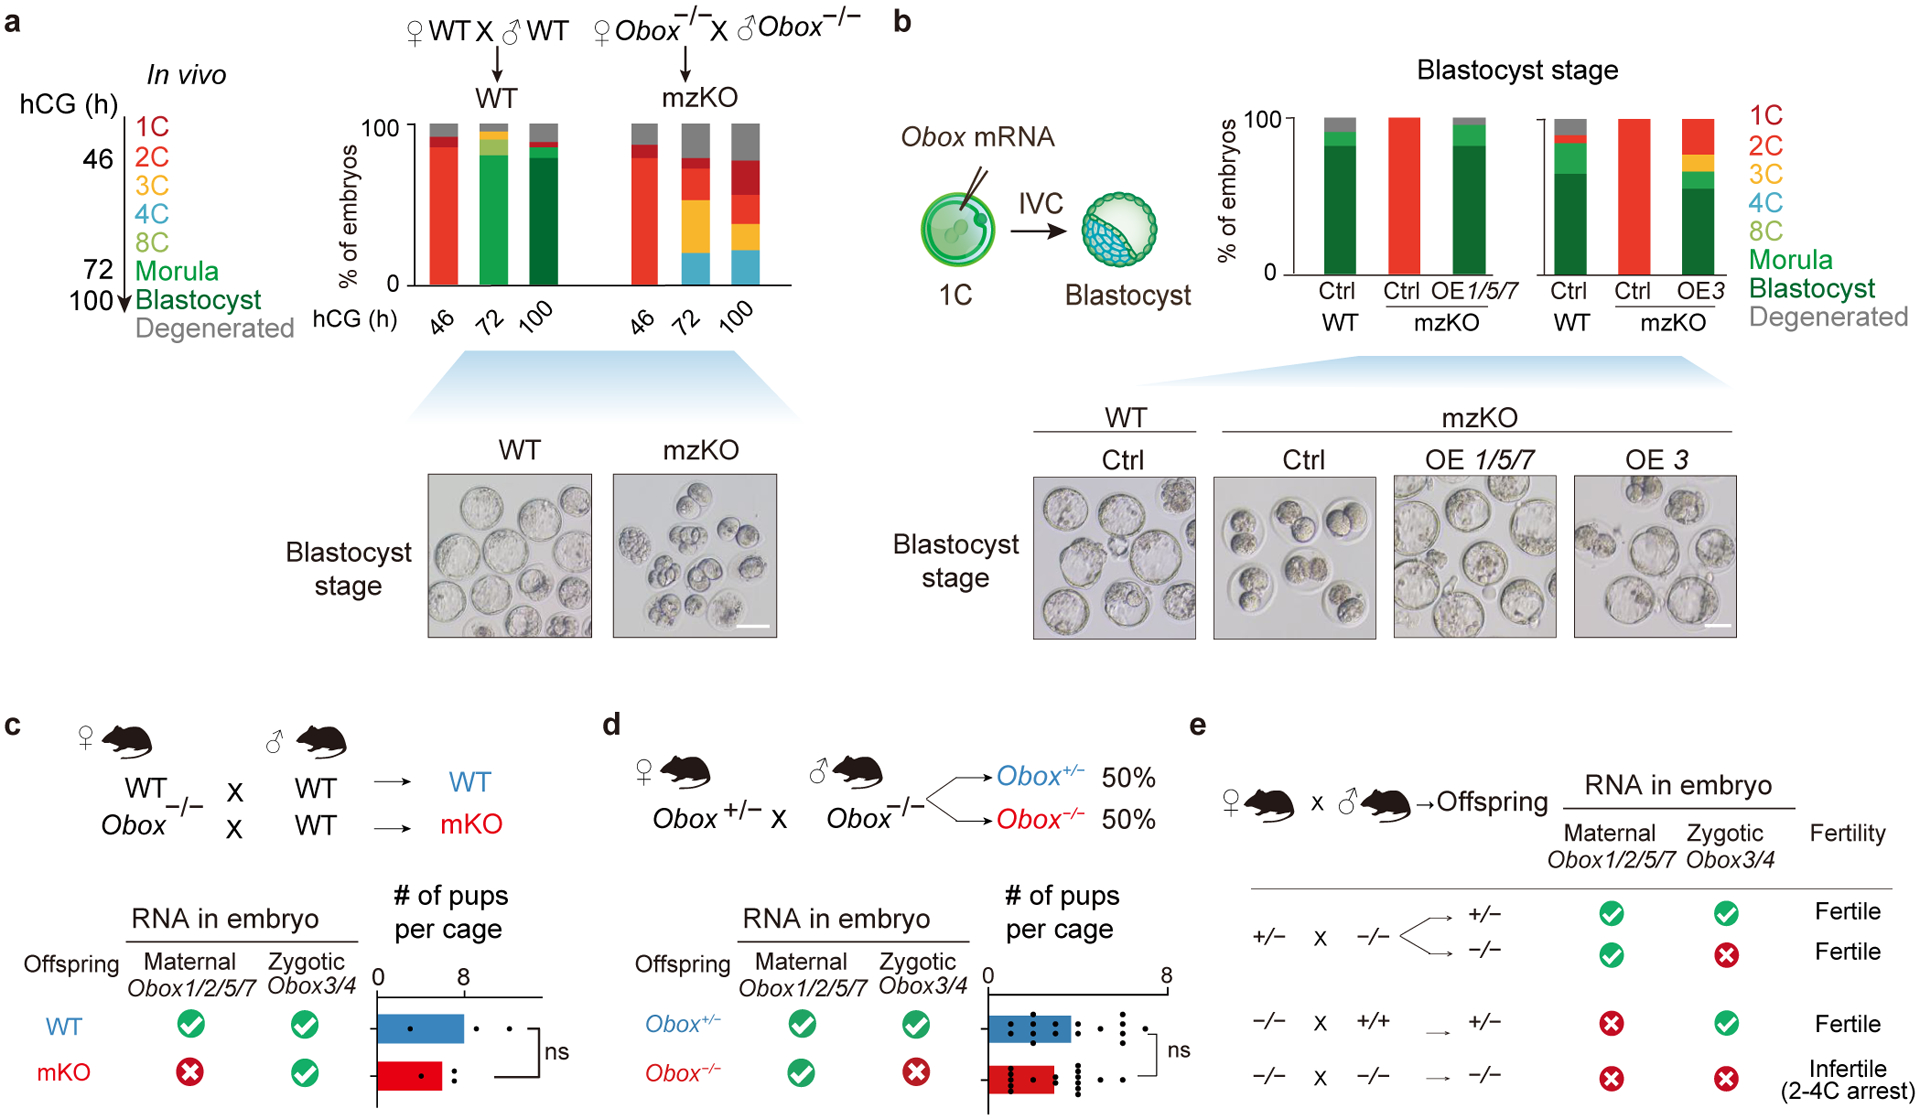
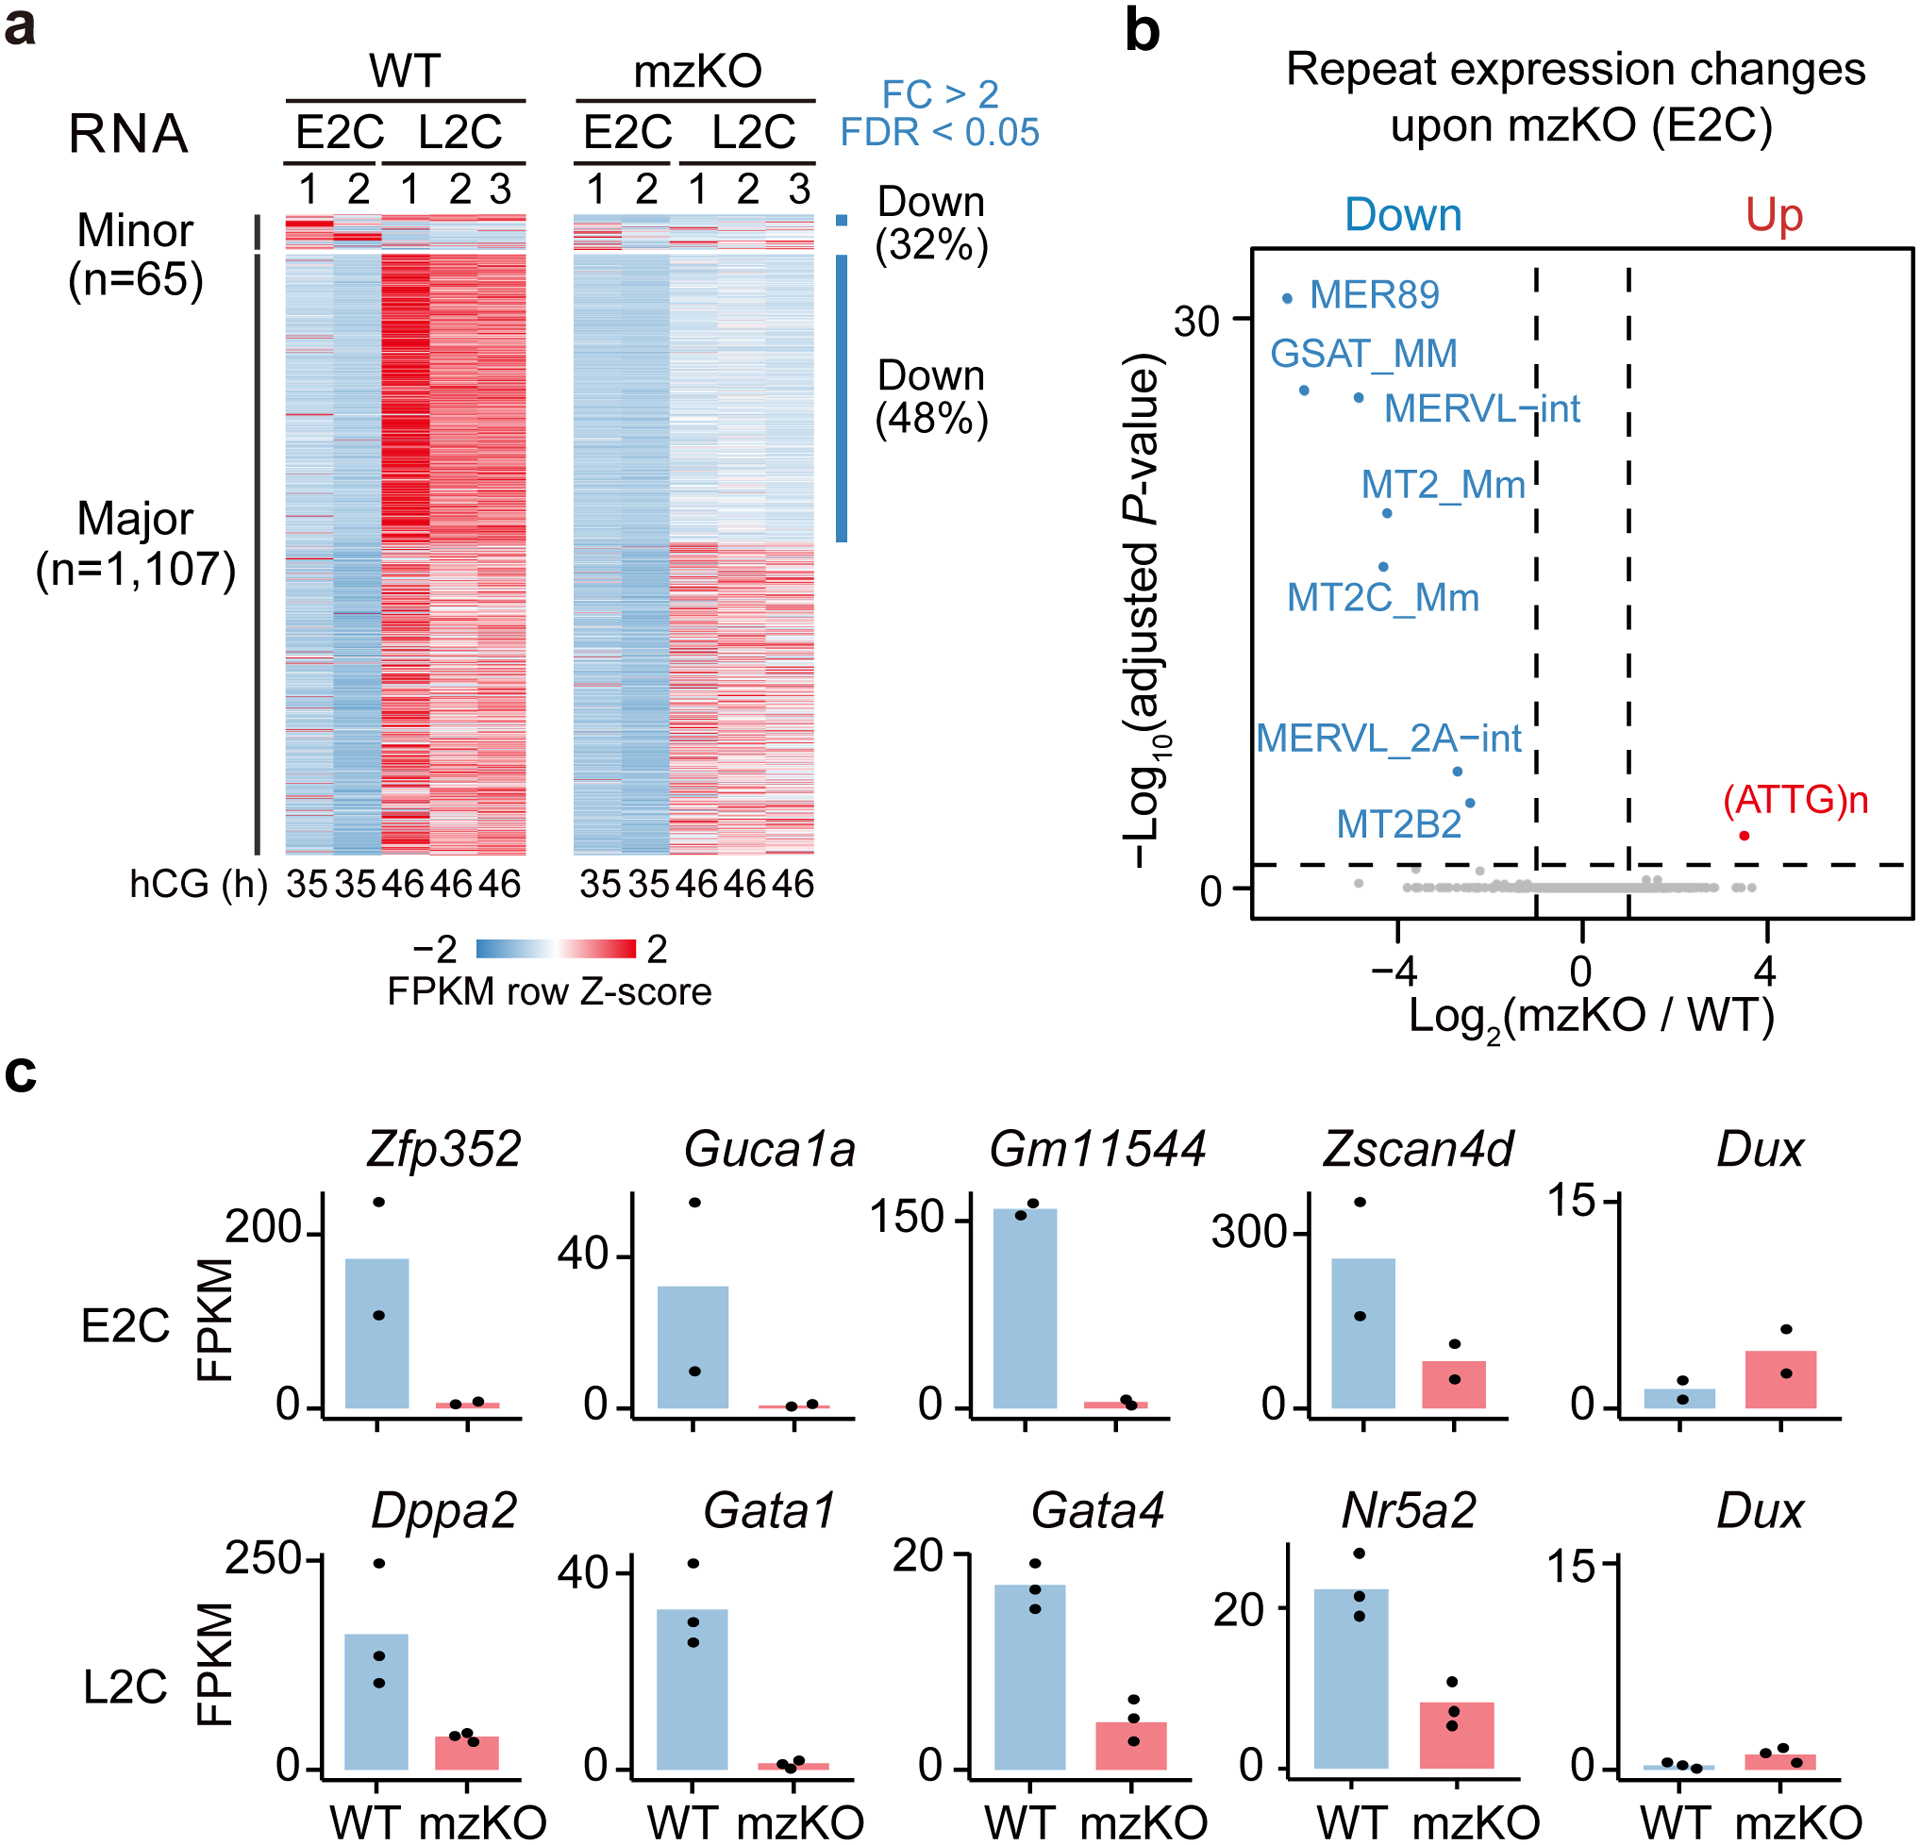
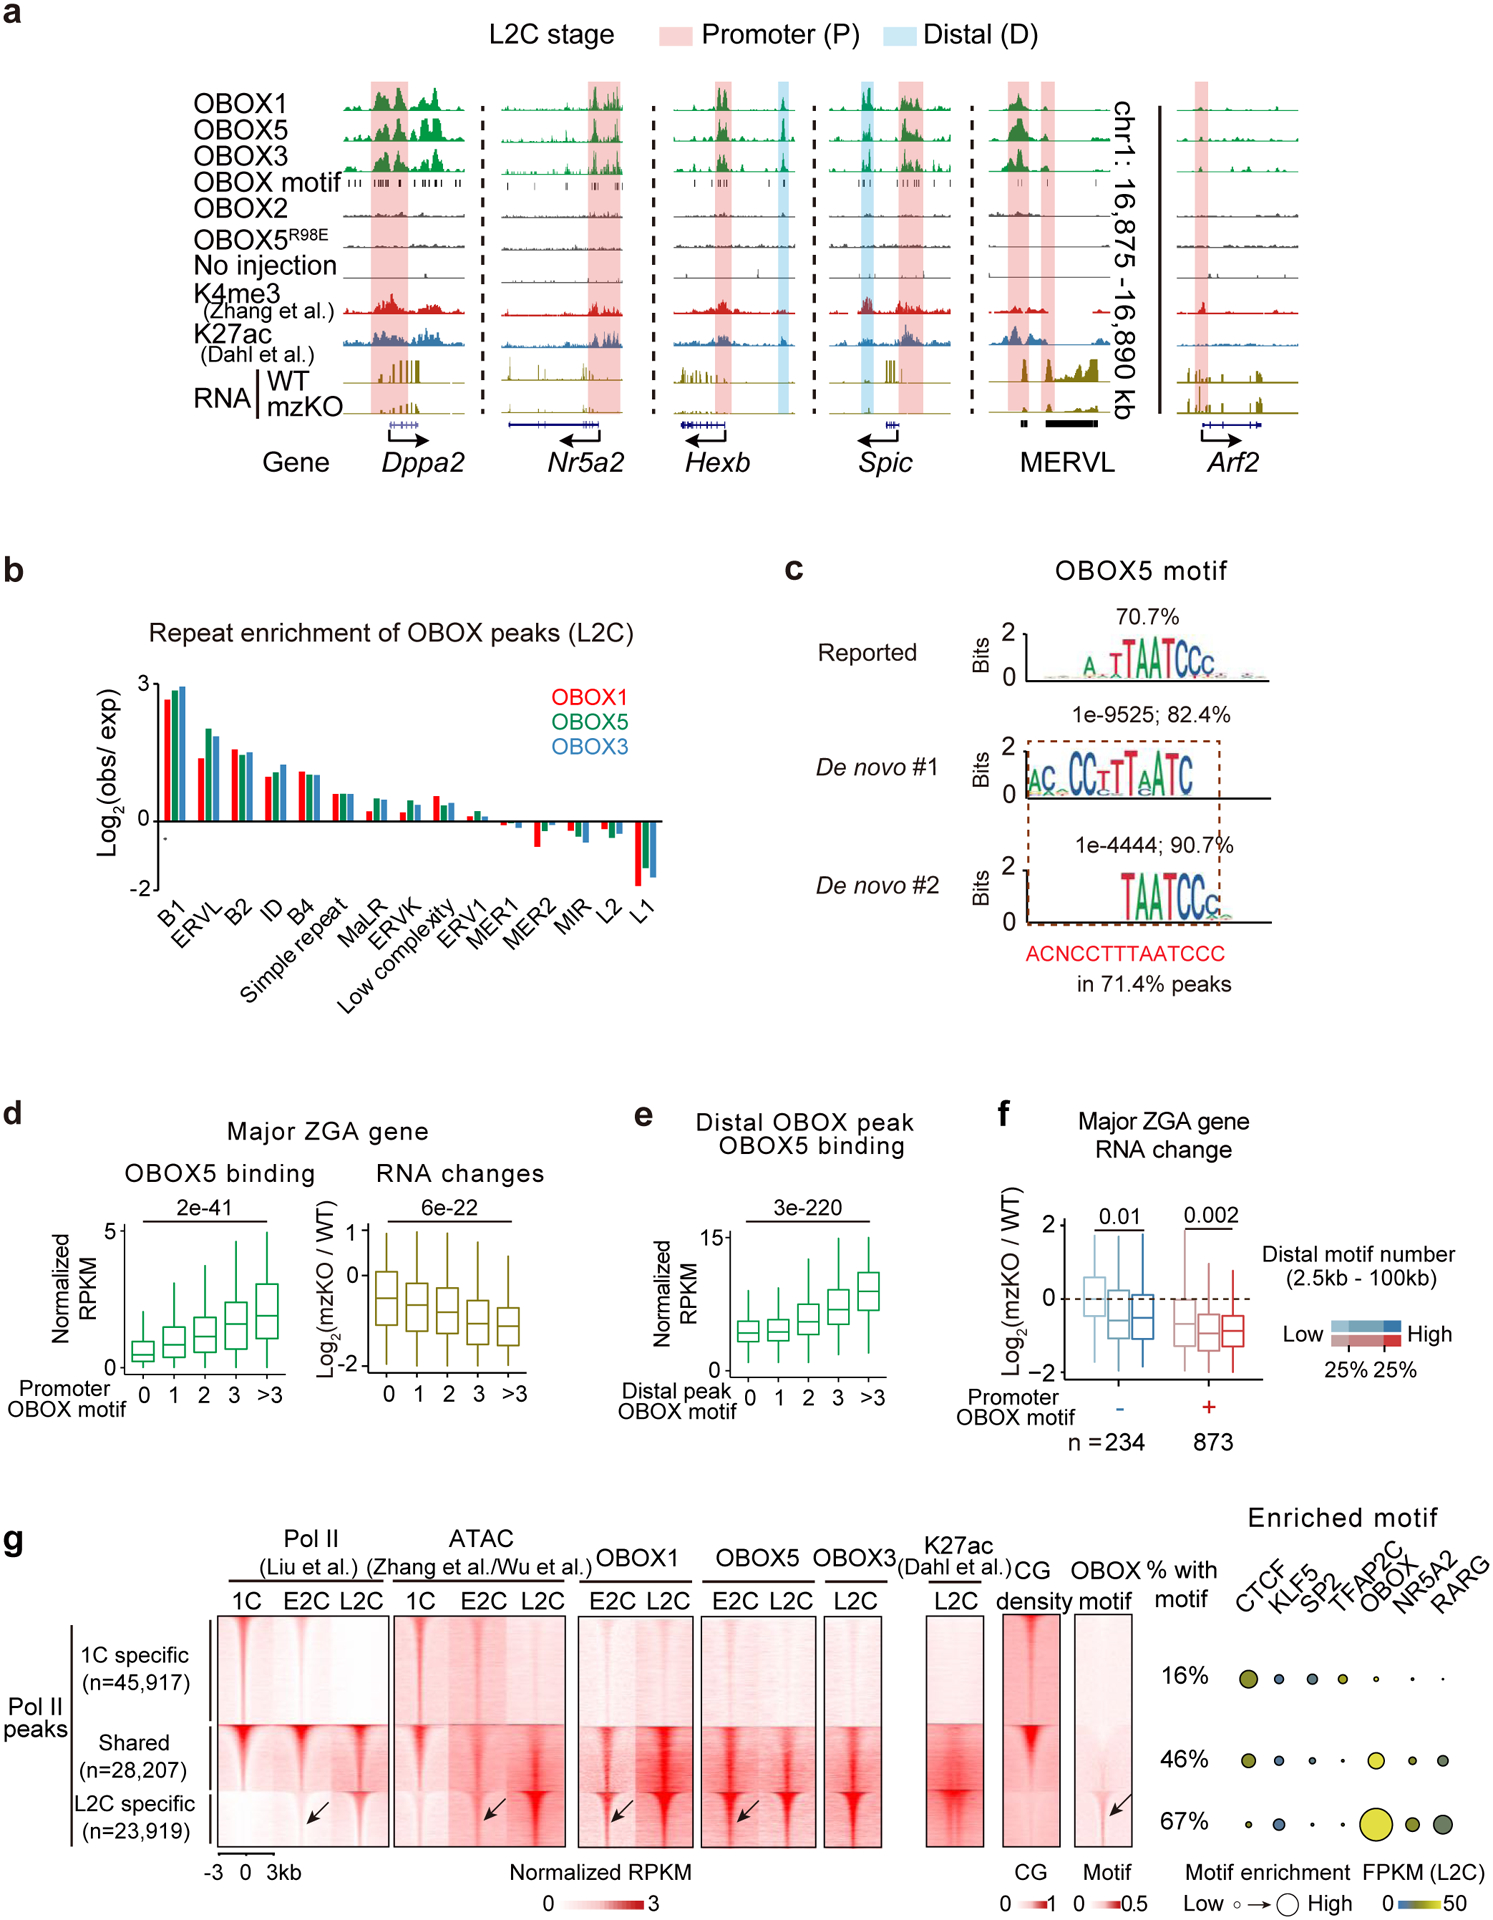
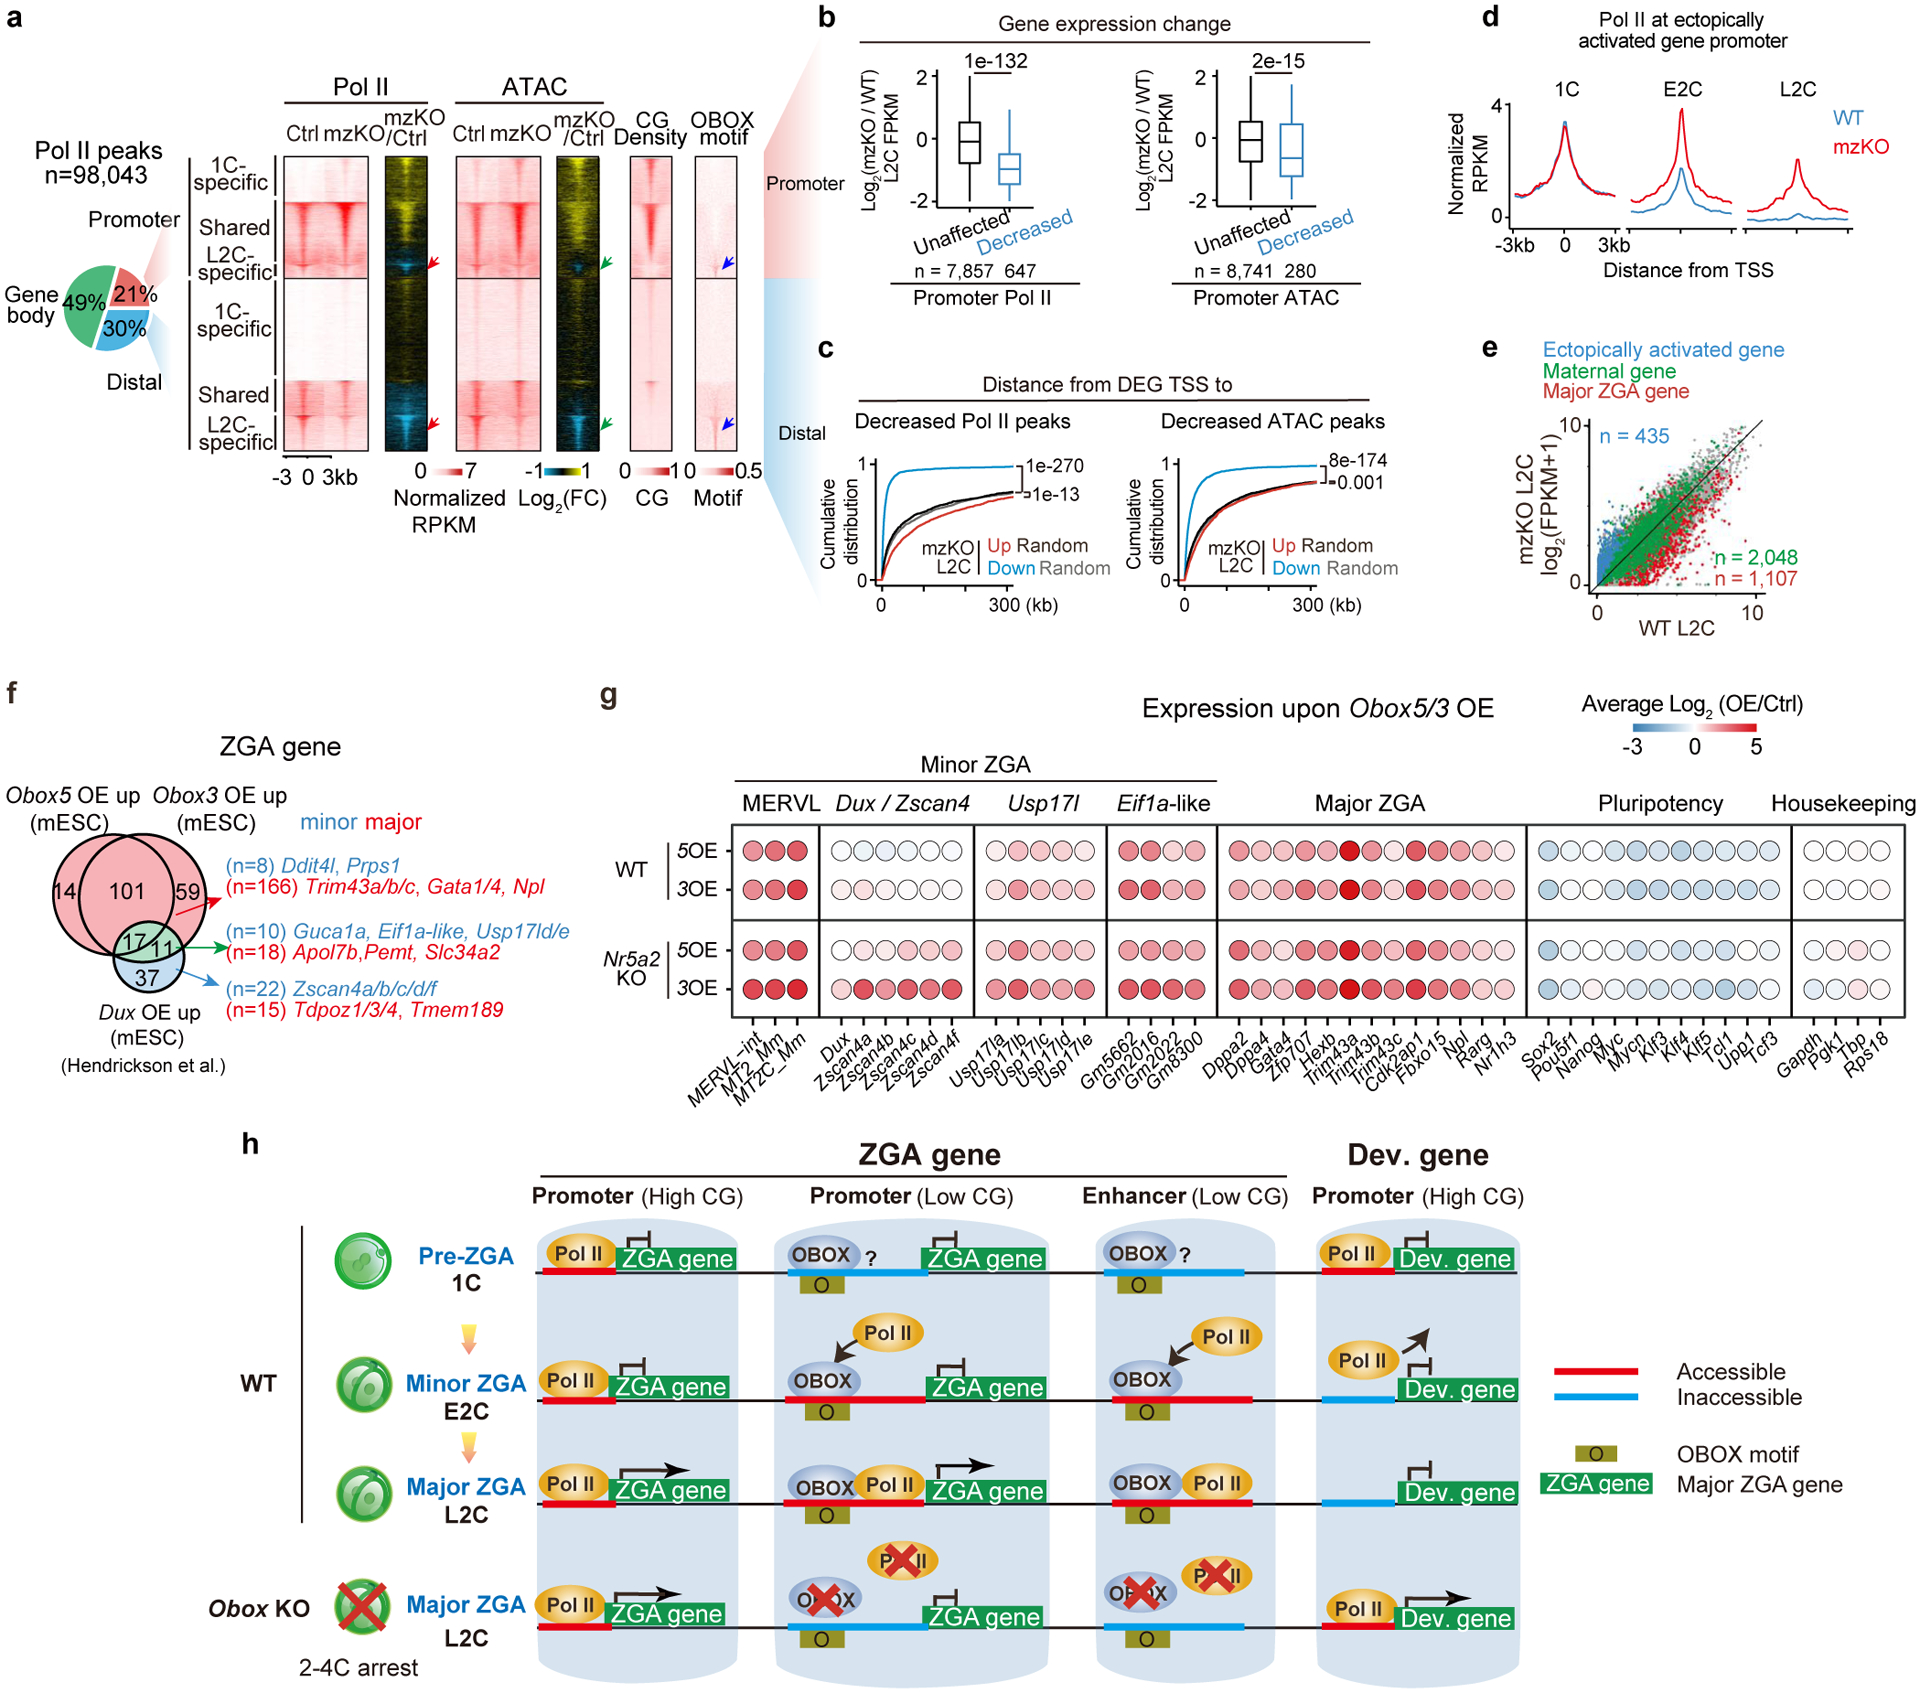
Zygotic genome activation (ZGA) activates the quiescent genome to enable the maternal-to-zygotic transition1,2. However, the identity of transcription factors that underlie mammalian ZGA in vivo remains elusive. Here we show that OBOX, a PRD-like homeobox domain transcription factor family (OBOX1-OBOX8)3-5, are key regulators of mouse ZGA. Mice deficient for maternally transcribed Obox1/2/5/7 and zygotically expressed Obox3/4 had a two-cell to four-cell arrest, accompanied by impaired ZGA. The Obox knockout defects could be rescued by restoring either maternal and zygotic OBOX, which suggests that maternal and zygotic OBOX redundantly support embryonic development. Chromatin-binding analysis showed that Obox knockout preferentially affected OBOX-binding targets. Mechanistically, OBOX facilitated the 'preconfiguration' of RNA polymerase II, as the polymerase relocated from the initial one-cell binding targets to ZGA gene promoters and distal enhancers. Impaired polymerase II preconfiguration in Obox mutants was accompanied by defective ZGA and chromatin accessibility transition, as well as aberrant activation of one-cell polymerase II targets. Finally, ectopic expression of OBOX activated ZGA genes and MERVL repeats in mouse embryonic stem cells. These data thus demonstrate that OBOX regulates mouse ZGA and early embryogenesis.


Conflict of interest statement

Competing interests The authors declare no competing financial interests.

Figures

Extended Data Fig. 1 |
Extended Data Fig. 1 |. The location and expression of Obox genes.
a, The UCSC genome browser snapshots showing Obox location and expression. b, Heatmap showing Obox mRNA levels in oocytes and embryos. c, CPE and PAS locations in maternal Obox 3’UTRs. d, Line plots showing poly(A) tail lengths of maternal Obox during oocyte maturation. e, Bar chart showing Obox3 mRNA levels in WT (2–4 biological replicates;10 oocytes or embryos for each group). f, OBOX3 immunofluorescence in 2C embryos. M2C, mid-2-cell; M-L2C, mid-to-late 2-cell (3 biological replicates). Scale bar, 20 μm. Arrow, nuclear OBOX3.
Extended Data Fig. 2 |
Extended Data Fig. 2 |. OBOX protein levels in oocytes and early embryos.
a-b, Line plots showing Obox mRNA and translation levels during oocyte maturation (2 biological replicates) and early embryo development (2 biological replicates) based on datasets from the previous publications,. NA, data not available. c, OBOX antibody epitope locations. d, Immunofluorescence showing OBOX signals detected by OBOX antibodies upon Flag-OBOX-GFP overexpression in mESCs (2 biological replicates). Scale bar, 10μm. e-h, OBOX immunofluorescence in mouse oocytes and embryos (3 biological replicates). BL, blastocyst. Scale bar, 20 μm.
Extended Data Fig. 3 |
Extended Data Fig. 3 |. Individual Obox knockdown had limited effects on preimplantation development.
a, Schematic of individual Obox knockdown. b, Bar chart showing the Obox knockdown efficiency in embryos (2 biological replicates; 10 embryos for each group). The control RNA levels were normalized to 1. Arrow, targeted Obox. c, Embryo morphology upon individual Obox knockdown at the blastocyst stage (2 biological replicates). Scale bars, 100 μm. d, Developmental rate upon individual Obox knockdown (2 biological replicates).
Extended Data Fig. 4 |
Extended Data Fig. 4 |. Obox depletion did not affect oocyte maturation.
a, Whole-genome sequencing (WGS) and RNA-seq showing Obox genes and expression. Yellow shade, the deleted Obox. #1/#2/#3, three Obox mzKO mice. b, RNA-seq showing Obox levels (2 or 3 biological replicates). KO, the knocked out Obox genes. c, OBOX staining in WT and Obox mzKO embryos (2 biological replicates). Scale bar, 20 μm. d, Tubulin and OBOX staining in WT and Obox−/− oocytes (3 biological replicates). Scale bars, 5 μm (top) and 20 μm (bottom). e, Bar chart showing offspring numbers with different crossing strategies. 37, 23, and 16 cages for WT × WT, heterozygote × heterozygote, and homozygote × homozygote, respectively. ns, not significant (P-value = 0.69, two-sided t-test). Data are presented as mean values ± SD. f, Fertility test of mzKO (four female mice per group). g, HE staining (3 biological replicates). Scale bar, 0.25mm. h, Bright-field images and bar charts showing oocyte morphology and maturation percentages upon OBOX depletion (2 biological replications). GVBD, germinal vesicle breakdown; PB1, the first polar body. Scale bar, 75μm. i, Bar chart showing the numbers of ovulated oocytes per mouse. n, number of mice used. P-value = 0.84, two-sided t-test. Data are presented as mean values ± SD. j, Volcano plot showing gene expression changes between Obox−/− and WT oocytes (2 biological replicates). Dashed line, adjusted P-value threshold 0.05. k, Embryo morphology and developmental rate in vitro (5 biological replicates). Scale bar, 75 μm.
Extended Data Fig. 5 |
Extended Data Fig. 5 |. Maternal and zygotic OBOX redundantly support early development.
a, Expression of stage-specific genes in WT, Obox mutant, and rescued embryos. BL*2C, Obox mzKO embryos arrested at 2C when WT developed to blastocyst. b, Schematic of OBOX3 rescue in Obox mzKO embryos with embryo morphology and developmental rates shown (3 biological replicates). Scale bar, 100 μm. c-d, OBOX4 expression (c), embryo morphology, and developmental rate (d) with or without Obox4 rescue (3 biological replicates). Scale bar, 75 μm. e, RNA-seq showing Obox levels in WT and maternal Obox knockout embryos. Check and cross, the presence or absence of Obox mRNAs. f, OBOX3 immunofluorescence in WT and Obox mKO embryos (3 biological replicates). Scale bar, 20 μm. g-h, Embryo morphology, developmental rate (g), and expression of stage-specific genes (h) for WT and Obox mKO embryos in vivo at the blastocyst stage (2 biological replicates). Scale bar, 100 μm. i, Obox expression levels in Obox mutant embryos.
Extended Data Fig. 6 |
Extended Data Fig. 6 |. Obox depletion impaired ZGA and MERVL activation.
a, Hierarchical clustering based on RNA-seq (2 biological replicates for E2C and 3 for L2C). b, Volcano plot showing gene expression changes upon Obox depletion (2 biological replicates for E2C and 3 for L2C). Dashed line, adjusted P-value threshold 0.05. GO terms are shown. c, Balloon plot showing gene expression changes (mzKO/WT) for MERVL and ZGA genes at 2C (2 biological replicates for E2C and 3 for L2C). d, Scatter plot showing gene expression fold-changes upon Obox depletion (2 biological replicates for E2C and 3 for L2C). FC, fold-change. Yellow lines, local regression fitting. e, Violin plot showing maternal and ZGA gene expression changes from oocytes to E2C or L2C in WT and Obox mzKO embryos (2 biological replicates for MII, E2C and 3 for L2C). Centre line, median; box, 25th and 75th percentiles; whiskers, 1.5 × IQR.
Extended Data Fig. 7 |
Extended Data Fig. 7 |. OBOX binding in 2-cell embryos.
a, Stage-specific gene expression upon Obox overexpression in WT embryos. b, Luciferase reporter assay showing OBOX gene activation abilities in HEK293 cells (2 biological replicates). ΔHD, homeobox domain deletion. c, Heatmap showing OBOX binding at L2C. OBOX motif densities and H3K27ac are shown. d, Scatter plot comparing OBOX binding at L2C. e, Bar chart showing the genomic distribution of OBOX binding at L2C. f, Heatmap showing OBOX binding on MERVL at L2C. OBOX motif is shown. n, peak number. g, Motif identified in OBOX binding sites in embryos. Percentages and P-values are shown. h, OBOX motif reporter assay in WT mouse embryos (2 biological replicates). Exposure time is shown. i, Luciferase reporter intensities in HEK293 cells (2 biological replicates). j, OBOX motif reporter assay in WT and Obox mzKO embryos (3 biological replicates). + and −, presence and absence of Obox1/5 mRNAs or extended motif, respectively. Scale bar, 75 μm. k, Bar chart showing OBOX motif occurrence at the stage-specific gene promoters. l-m, Box plots showing OBOX binding enrichment at major ZGA gene promoters (l) and distal regions (m) in WT L2C. 234, 272, 232, 169, and 201 genes have 0, 1, 2, 3, and >3 OBOX motifs on promoters, respectively. 9,855, 18,416, 7,142, 2,135, and 1,257 distal OBOX1 binding peaks have 0, 1, 2, 3, and >3 OBOX motifs, respectively. 5,918, 15,350, 4,795, 1,000, and 261 distal OBOX3 binding peaks have 0, 1, 2, 3, and >3 OBOX motifs, respectively. P-values, two-sided Wilcoxon rank-sum test. Centre line, median; box, 25th and 75th percentiles; whiskers, 1.5 × IQR. n, Percentages of ZGA genes that showed gene expression changes upon Obox depletion at L2C (3 biological replicates).
Extended Data Fig. 8 |
Extended Data Fig. 8 |. Depletion of OBOX led to Pol II pre-configuration defects and ectopic activation of 1C Pol II targets.
a, Pol II binding, CG density, and OBOX motif enrichment at 1C-specific, shared, and L2C-specific Pol II peaks in WT and Obox mzKO embryos. Red and blue arrows indicate L2C-specific Pol II binding and enrichment of the OBOX motif, respectively. b, Top, OBOX binding at example genes in WT embryos. OBOX motif and CG density are shown. Middle, Pol II binding and ATAC enrichment in WT and Obox mzKO embryos (2 biological replicates). P (+/−), promoter with or without the OBOX motif; D (+), distal enhancer with the OBOX motif. Bottom, bar charts showing gene expression (2 biological replicates for MII and 3 for L2C). Error bars, mean ± SE. c, Hierarchical clustering based on Pol II Stacc-seq (2 biological replicates). d, Percentages of Pol II or ATAC peaks with OBOX motif at the promoters or distal regions at L2C. e, Box plot showing RNA levels of ectopically activated genes, major ZGA genes, and maternal genes. n, gene number. Centre line, median; box, 25th and 75th percentiles; whiskers, 1.5 × IQR. f, Percentages of ectopically activated genes or all genes (control) that are 1C-specific Pol II targets or Polycomb targets (PcG). P-values, two-sided Fisher’s exact test. g, RNA levels in WT oocytes and embryos for ectopically activated genes. GO terms and example genes are shown. Centre line, median; box, 25th and 75th percentiles; whiskers, 1.5 × IQR. h, Heatmap showing gene expression in ICM, TE, and the ratio of TE/ICM in WT embryos for ectopically activated ICM and TE genes in Obox knockout embryos. Gene expression for WT and Obox mzKO MII oocytes (2 biological replicates) and embryos (3 biological replicates) is mapped. n indicates gene number. 4C*, the stage when WT developed to 4C and Obox mzKO embryos arrested at 2–4C. i, Bar chart showing gene expression of example ICM and TE genes from h.
Extended Data Fig. 9 |
Extended Data Fig. 9 |. Obox overexpression activated ZGA genes and MERVL in 2i mESCs.
a, Obox expression levels upon overexpression in 2i mESCs (4 biological replicates). Error bars, mean ±SE. b, Bar chart showing the activated ZGA gene numbers upon Obox overexpression in 2i mESCs (4 biological replicates). P-values, two-sided Fisher’s exact test. c, Venn diagram showing the overlaps among Obox OE upregulated genes in 2i mESCs and ZGA genes. P-value, two-sided Fisher’s exact test. Green indicates the combined ZGA gene list activated by OBOX3/5. d, Scatter plot showing gene expression fold-changes upon Obox overexpression in 2i mESCs (4 biological replicates). e, OBOX binding at example OBOX-activated ZGA genes and MERVL in embryos. OBOX motif and RNA levels are shown. f, OBOX binding enrichment in embryos at the promoters of differentially expressed genes (DEGs) upon Obox overexpression in 2i mESCs. g, Line charts showing DEG upon Obox overexpression in 2i mESCs (4 biological replicates) for their expression in oocytes and embryos. Error bars, mean ± SE. n, gene number. h, Venn diagram showing the overlap between Obox activated ZGA genes in 2i mESCs (4 biological replicates) and downregulated ZGA genes in Obox mzKO embryos (2 biological replicates for E2C and 3 for L2C)). P-value, two-sided Fisher’s exact test. Green indicates the combined ZGA gene list activated by OBOX3/5 and downregulated in Obox mzKO embryos. i, Volcano plot showing the repeat expression changes upon Obox overexpression in 2i mESCs (4 biological replicates). Dashed line, adjusted P-value threshold 0.05.
Extended Data Fig. 10 |
Extended Data Fig. 10 |. OBOX activated ZGA genes in mESCs independent of DUX and NR5A2.
a, Bar charts showing Dux, Zscan4, and Dppa expression in 2C embryos (top, 2 biological replicates for E2C and 3 for L2C) and mESCs (bottom, 4–5 biological replicates). b, The UCSC browser snapshots showing OBOX binding at 2C. Pol II, ATAC, and OBOX motif are shown. c, Heatmap showing Obox expression upon Dux overexpression in 2i mESCs (2 biological replicates). d, Heatmap showing Obox expression upon Dux knockout (2 biological replicates for L1C and 3 for L2C). e, Venn diagram showing the overlap of downregulated ZGA genes between Obox knockout and Dux knockout embryos,. n, ZGA gene numbers. f, Venn diagram showing the overlap of OBOX-activated ZGA genes and upregulated ZGA genes in 2CLCs compared to mESCs. P-value, two-sided Fisher’s exact test. Green indicates the combined ZGA gene list activated by OBOX3/5 and in 2CLC. g, Heatmap showing Obox expression upon Nr5a2 knockdown in embryos. h, Scatter plot comparing the ZGA gene expression changes upon Obox overexpression between WT and Nr5a2 knockout mESCs (2 replicates).
Fig. 1.
Fig. 1.. OBOX expression in mouse oocytes and preimplantation embryos.
a, Top 250 TFs based on the translation levels (RPF, ribosome protected fragments) or motif enrichment in all distal accessible regions or those near ZGA genes based on ATAC-seq (left) in embryos. PRD-like homeobox family (red), nuclear receptor (NR) (blue), and Kruppel-like factors (KLF) (green) TFs and their ranks are indicated. OBOX, OTX2, GSC, CRX, and PITX1 binding motifs are shown (right). E2C, early 2-cell; L2C, late 2-cell. b, Line plots showing mRNA and translation levels of maternal, minor, and major ZGA Obox in oocytes and early embryos (2 biological replicates). c, Sequence alignment of OBOX proteins based on Clustal Omega.
Fig. 2.
Fig. 2.. Maternal and zygotic OBOX redundantly supported embryo development.
a, Embryo morphology and developmental rates of WT and Obox mzKO embryos dissected in vivo (4 biological replicates). Scale bar, 75 μm. b, OBOX rescue through overexpression of Obox1/5/7 (OE 1/5/7) or Obox3 (OE 3) mRNA, and the resulting embryo morphology and developmental rates (3 biological replicates). Scale bar, 75 μm. c, Offspring numbers for either WT or Obox−/− female mice crossed with WT male mice (three litters for each group). The presence or absence of Obox mRNAs in embryos is indicated. ns, not significant (P-value = 0.52, two-sided t-test). d, Offspring types and numbers for Obox+/− female mice crossed with Obox−/− male mice (total of 108 pups from 16 litters). P-value = 0.07, two-sided paired t-test. e, Summary of genotypes and phenotypes from different Obox mutant mouse crossing.
Fig. 3.
Fig. 3.. The loss of OBOX caused defective minor and major ZGAs.
a, Heatmap showing minor and major ZGA gene expression in WT and Obox mzKO embryos (2 biological replicates for E2C and 3 for L2C). n, ZGA gene number. b, Volcano plot showing repeat expression changes comparing Obox mzKO and WT E2C embryos (2 biological replicates). Dashed line, adjusted P-value threshold 0.05. c, Bar charts showing minor and major ZGA gene expression in WT and Obox mzKO embryos (2 biological replicates for E2C and 3 for L2C; 10 embryos per group).
Fig. 4.
Fig. 4.. OBOX binding in 2C embryos.
a, The UCSC browser snapshots showing OBOX1/5/3 binding at example genes and repeats in L2C embryos. Stacc-seq of OBOX2, OBOX5R98E binding, and Stacc-seq in embryos without injection are negative controls. H3K4me3, H3K27ac, OBOX motif, and RNA levels in WT and Obox mzKO embryos are also shown. b, Bar chart showing repeat enrichment at OBOX binding peaks at L2C. c, Reported motif, de novo top 1, 2, and combined extended motif identified by OBOX5 binding peaks in embryos. The percentages of peaks containing these motifs and P-values are shown. d, Box plots showing OBOX5 binding at major ZGA gene promoters in WT L2C embryos (left) and the major ZGA gene expression fold-changes upon OBOX depletion (right, 3 biological replicates). P-value, two-sided Wilcoxon rank-sum test. 234, 272, 232, 169, and 201 genes have 0, 1, 2, 3, and >3 OBOX motifs on promoters, respectively. Centre line, median; box, 25th and 75th percentiles; whiskers, 1.5 × IQR (same for d and e). e, Box plot showing OBOX5 binding enrichment at distal binding peaks in L2C embryos. P-value, two-sided Wilcoxon rank-sum test. 5,885, 16,226, 5,314, 1,370, and 561 distal OBOX3 binding peaks have 0, 1, 2, 3, and >3 OBOX motifs, respectively. f, Box plots showing ZGA gene expression changes upon Obox knockout (3 biological replicates). P-value, two-sided Wilcoxon rank-sum test. n, major ZGA gene number. g, Left, heatmaps showing Pol II binding, chromatin accessibility (ATAC),, OBOX binding, H3K27ac, CG density and OBOX motif enrichment at 1C-specific, shared, and L2C-specific Pol II peaks in WT embryo. The percentages of peaks with at least one OBOX motif are shown. The arrows indicate Pol II, accessible chromatin, OBOX1/5 binding, and OBOX motif at the L2C-specific Pol II peaks in the E2C embryos. Right, enrichment of known transcription factor motifs. Motif P-value, area of the circle.
Fig. 5.
Fig. 5.. OBOX regulated Pol II pre-configuration in embryos and its overexpression activated ZGA genes and MERVL in mESCs.
a, Pie chart showing Pol II peak distribution in the genome. Heatmaps showing Pol II binding and ATAC signals at 1C-specific, shared, and L2C-Pol II peaks at L2C (2 biological replicates). CG density and OBOX motif enrichment are shown. b, Box plots showing expression changes for genes with promoter Pol II binding or ATAC enrichment decreased or unaffected in Obox mzKO embryos (2 biological replicates). P-values, two-sided Wilcoxon rank-sum test. n, gene number. c, Empirical cumulative density function of the distance from downregulated or upregulated gene transcription start sites (TSS) to the nearest decreased distal Pol II peaks or ATAC peaks (2 biological replicates). P-values, two-sided Wilcoxon rank-sum test. Down-regulated genes, n = 2,026; up-regulated genes, n = 1,486. Equal numbers of random control genes are included. The decreased distal Pol II and ATAC peak numbers are 23,039 and 14,364, respectively. d, Promoter Pol II enrichment (Z-score normalized; 2 biological replicates) for the ectopically activated genes. e, Scatter plots comparing gene expression between WT and Obox mzKO embryos (3 biological replicates). f, Venn diagram showing the overlap of Obox (4 biological replicates) or Dux (2 biological replicates) overexpression upregulated ZGA genes in 2i mESCs. n, ZGA gene numbers. g, Balloon plot showing average gene expression changes after overexpressing Obox5 or Obox3 in WT (top, 4 biological replicates) or Nr5a2 KO (bottom, 2 biological replicates) 2i mESCs. Housekeeping genes, control. h, A model illustrating the role of OBOX in ZGA. Before ZGA (1C), promoters with high CG densities are initially accessible and bound by Pol II. Later (E2C and L2C), Pol II leaves 1C-specific targets (with mechanisms unclear) and OBOX guides Pol II to CG-poor ZGA gene promoters and enhancers. The loss of OBOX leads to impaired Pol II binding at ZGA gene promoters and enhancers, defective ZGA, and aberrant Pol II retaining in 1C targets, accompanied by ectopic gene activation and 2–4C arrest.

Comment in

References

    1. Jukam D, Shariati SAM & Skotheim JM Zygotic Genome Activation in Vertebrates. Dev Cell 42, 316–332, doi:10.1016/j.devcel.2017.07.026 (2017). - DOI - PMC - PubMed
    1. Lee MT, Bonneau AR & Giraldez AJ Zygotic genome activation during the maternal-to-zygotic transition. Annu Rev Cell Dev Biol 30, 581–613, doi:10.1146/annurev-cellbio-100913-013027 (2014). - DOI - PMC - PubMed
    1. Wilming LG, Boychenko V & Harrow JL Comprehensive comparative homeobox gene annotation in human and mouse. Database (Oxford) 2015, doi:10.1093/database/bav091 (2015). - DOI - PMC - PubMed
    1. Rajkovic A, Yan C, Yan W, Klysik M & Matzuk MM Obox, a family of homeobox genes preferentially expressed in germ cells. Genomics 79, 711–717, doi:10.1006/geno.2002.6759 (2002). - DOI - PubMed
    1. Royall AH, Maeso I, Dunwell TL & Holland PWH Mouse Obox and Crxos modulate preimplantation transcriptional profiles revealing similarity between paralogous mouse and human homeobox genes. Evodevo 9, 2, doi:10.1186/s13227-018-0091-4 (2018). - DOI - PMC - PubMed

Publication types

MeSH terms