. 2023 Nov;152(5):1261-1272.
doi: 10.1016/j.jaci.2023.06.024. Epub 2023 Jul 15.

RelB-deficient autoinflammatory pathology presents as interferonopathy, but in mice is interferon-independent

Affiliations

RelB-deficient autoinflammatory pathology presents as interferonopathy, but in mice is interferon-independent

Héctor I Navarro et al. J Allergy Clin Immunol. 2023 Nov.

Abstract

Background: Autoimmune diseases are leading causes of ill health and morbidity and have diverse etiology. Two signaling pathways are key drivers of autoimmune pathology, interferon and nuclear factor-κB (NF-κB)/RelA, defining the 2 broad labels of interferonopathies and relopathies. Prior work has established that genetic loss of function of the NF-κB subunit RelB leads to autoimmune and inflammatory pathology in mice and humans.

Objective: We sought to characterize RelB-deficient autoimmunity by unbiased profiling of the responses of immune sentinel cells to stimulus and to determine the functional role of dysregulated gene programs in the RelB-deficient pathology.

Methods: Transcriptomic profiling was performed on fibroblasts and dendritic cells derived from patients with RelB deficiency and knockout mice, and transcriptomic responses and pathology were assessed in mice deficient in both RelB and the type I interferon receptor.

Results: We found that loss of RelB in patient-derived fibroblasts and mouse myeloid cells results in elevated induction of hundreds of interferon-stimulated genes. Removing hyperexpression of the interferon-stimulated gene program did not ameliorate the autoimmune pathology of RelB knockout mice. Instead, we found that RelB suppresses a different set of inflammatory response genes in a manner that is independent of interferon signaling but associated with NF-κB binding motifs.

Conclusion: Although transcriptomic profiling would describe RelB-deficient autoimmune disease as an interferonopathy, the genetic evidence indicates that the pathology in mice is interferon-independent.

Keywords: RelB; autoimmunity; dendritic cells; inflammation; interferonopathy; relopathy.


Conflict of interest statement

Conflict of Interest:

The authors declare that research in this study was conducted in the absence of a conflict of interest.

Figures

Fig. 1
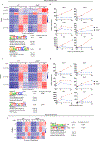
Fig. 1. Fibroblasts obtained from a human RelB-null donor show hyperexpression of type I interferon and interferon-stimulated genes.
a Heatmap of z-scored log2CPM of all poly(I:C)(10µg/ml)-induced (FC>4 and FDR <0.01) genes in Control or P1 (RelB-null) derived fibroblasts (740 genes). Each row represents individual genes, and each column is from an individual time point post stimulation. R1 and R2 are experimental replicates. Red and blue colors represent distance from mean log2CPM value for each gene. b Top two results of known motif analysis results for gene clusters from Fig. 1a. Motif analysis considered −4kb to +1kB with respect to the transcription start site (TSS). Cluster B did not generate motifs with given parameters. (N.A.=No motif result) c Gene ontology results for gene clusters from Fig. 1a. d Line graphs of gene expression (log2CPM) for Ifn-β, and Ifn- λ3, and several ISGs during poly(I:C)-stimulation (0,2,4,8 and 15hr) (blue line represents control patient derived fibroblasts, Rep. 1= large circle, Rep.2= small circle, red line represents P1 patient derived fibroblasts, Rep. 1= large square, Rep.2= small square).
Fig. 2
Fig. 2. Loss of RelB in mouse myeloid cells recapitulate hyperexpression of type I IFN and interferon stimulated gene programs.
a Heatmap of z-scored mRNA expression of all poly(I:C)-induced (10µg/ml) (logFC>1) genes in WT GMCSF MCs (425 genes) (upper panel). Motif analysis and GO results for gene clusters from Fig. 2a (lower panel) b Line graphs of mRNA expression during poly(I:C)-stimulation (0,1,3,8 and 24hr), blue line (circle) represents WT GMCSF MCs, red line (square) represents RelB−/− GMCSF MCs c (Top) Heatmap of z-scored mRNA expression of all CPG-induced (0.1µM) (logFC>1) genes in WT MCs (415 genes). c (Bottom) Motif analysis and GO results for gene clusters from Fig. 2c d Line graphs of mRNA expression during CpG-stimulation (0,1,3,8 and 24hr), same color key as Fig 2b. e (Left) Heatmap of z-scored mRNA expression of all LPS-induced (logFC>1) genes in WT or RelB−/− MCSF MCs (1,243 unique genes). e (Right) Motif analysis and gene ontology results from gene cluster B of Fig. 2e. Each row in heatmaps represents individual genes, each column is an individual time point during stimulation. Motif analysis showing top statistically significant motif analysis result (known or de-novo) considering −1kb to +1kB with respect to the TSS.
Fig. 3
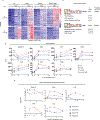
Fig. 3. Type I IFN receptor compound deficiency ablates the elevated IFN-stimulated gene program but reveals other immune response genes suppressed by RelB independent of type I IFN signaling.
a Heatmap of z-scored CPM of all RelB−/− hyper-expressed genes in WT, RelB−/−, IFNAR−/−, and IFNAR−/−RelB−/− MCs. Genes selected for CpG-induced (0.1µM) (logFC>1) in WT or RelB−/− MCs & hyper-expressed (FC>1.5) in RelB−/− MCs relative to WT MCs at any time point (334 genes). Each row represents individual genes, each column is from an individual time point during stimulation. b Top known motif analysis and gene ontology results for gene clusters from Fig. 3a. c Line graphs of CPM for IFN-independent hyper-expressed genes from cluster A from Fig. 3a and genes with similar functions during CpG-stimulation (0,1,3, and 8hr), dark blue line (closed circle) represents WT GMCSF MCs, dark red line (closed square) represents RelB−/− GMCSF MCs, light blue line (open circle) represents IFNAR−/− GMCSF MCs, light red line (open square) represents IFNAR−/−RelB−/− GMCSF MCs. d Line graphs of log2CPM for genes from cluster A in Fig. 3a and genes with similar functions in patient derived fibroblasts from Fig. 1a. Poly(I:C)-stimulation (0,2,4,8 and 15hr), (blue line represents control patient derived fibroblasts, Rep. 1= large circle, Rep.2= small circle, red line represents P1 patient derived fibroblasts, Rep. 1= large square, Rep.2= small square). Motif analysis considered −1kb to +1kB with respect to the TSS.
Fig. 4
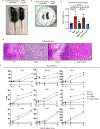
Fig. 4. Ablation of the elevated type I IFN-stimulated gene program does not rescue RelB-null pathology.
a Representative image of IFNAR−/−;RelB−/− (Right) and healthy litter mate (Left) at 4 weeks of age, ruler for scale. b Representative image of spleens from IFNAR−/−;RelB−/− mice (Right) and healthy litter mate (Left) c Spleen weights from age-matched WT ( solid dark blue), RelB−/− ( solid dark red), IFNAR−/−( checkered light blue), IFNAR−/−RelB−/− (checkered light red), and IFNARhetRelBhet (solid light blue) mice. Error bars indicate S.D. Statistical analysis was done using unpaired 2-tailed students t-test d Representative images from histology of WT, RelB−/−, IFNAR−/−, and IFNAR−/−RelB−/− spleens, demonstrating loss of white pulp and expansion of red pulp in IFNAR−/−RelB−/− spleens. White bar for scale (bottom right, 50µm) e Line graphs of gene expression (CPM) for ISGs showing loss of induction in IFNAR−/− (light blue, open circle) and IFNAR−/−RelB−/− (light red, open square) mice during CpG-stimulation (0,1,3, and 8hr). Dark blue line (closed circle) represents WT GMCSF MCs, dark red line (closed square) represents RelB−/− GMCSF MCs, light blue line (open circle) represents IFNAR−/− GMCSF MCs, light red line (open square) represents IFNAR−/−RelB−/− GMCSF MCs.

Similar articles

Cited by

References

    1. Committee for the Assessment of NIH Research on Autoimmune Diseases, Board on Population Health and Public Health Practice, Health and Medicine Division, National Academies of Sciences, Engineering, and Medicine. Enhancing NIH Research on Autoimmune Disease [Internet] Washington (DC): National Academies Press (US); 2022. [cited 2022 Nov 2]. (The National Academies Collection: Reports funded by National Institutes of Health). Available from: http://www.ncbi.nlm.nih.gov/books/NBK580299/ - PubMed
    1. Savic S, Coe J, Laws P. Autoinflammation: Interferonopathies and Other Autoinflammatory Diseases. J Invest Dermatol 2022. Mar;142(3 Pt B):781–92. - PubMed
    1. Ancient missense mutations in a new member of the RoRet gene family are likely to cause familial Mediterranean fever. The International FMF Consortium - PubMed [Internet] [cited 2022 Nov 2]. Available from: https://pubmed.ncbi.nlm.nih.gov/9288758/ - PubMed
    1. Shoham NG, Centola M, Mansfield E, Hull KM, Wood G, Wise CA, et al. Pyrin binds the PSTPIP1/CD2BP1 protein, defining familial Mediterranean fever and PAPA syndrome as disorders in the same pathway. Proc Natl Acad Sci U S A 2003. Nov 11;100(23):13501–6. - PMC - PubMed
    1. Romberg N, Al Moussawi K, Nelson-Williams C, Stiegler AL, Loring E, Choi M, et al. Mutation of NLRC4 causes a syndrome of enterocolitis and autoinflammation. Nat Genet 2014. Oct;46(10):1135–9. - PMC - PubMed

Publication types