Randomized Controlled Trial
. 2023 Nov;152(5):1247-1260.
doi: 10.1016/j.jaci.2023.06.025. Epub 2023 Jul 15.

Nasal and blood transcriptomic pathways underpinning the clinical response to grass pollen immunotherapy

Affiliations
Randomized Controlled Trial

Nasal and blood transcriptomic pathways underpinning the clinical response to grass pollen immunotherapy

Matthew C Altman et al. J Allergy Clin Immunol. 2023 Nov.

Abstract

Background: Allergen immunotherapy (AIT) is a well-established disease-modifying therapy for allergic rhinitis, yet the fundamental mechanisms underlying its clinical effect remain inadequately understood. Gauging Response in Allergic Rhinitis to Sublingual and Subcutaneous Immunotherapy was a randomized, double-blind, placebo-controlled trial of individuals allergic to timothy grass who received 2 years of placebo (n = 30), subcutaneous immunotherapy (SCIT) (n = 27), or sublingual immunotherapy (SLIT) (n = 27) and were then followed for 1 additional year.

Objective: We used yearly biospecimens from the Gauging Response in Allergic Rhinitis to Sublingual and Subcutaneous Immunotherapy study to identify molecular mechanisms of response.

Methods: We used longitudinal transcriptomic profiling of nasal brush and PBMC samples after allergen provocation to uncover airway and systemic expression pathways mediating responsiveness to AIT.

Trial registration: ClinicalTrials.gov Identifier: NCT01335139, EudraCT Number: 2010-023536-16.

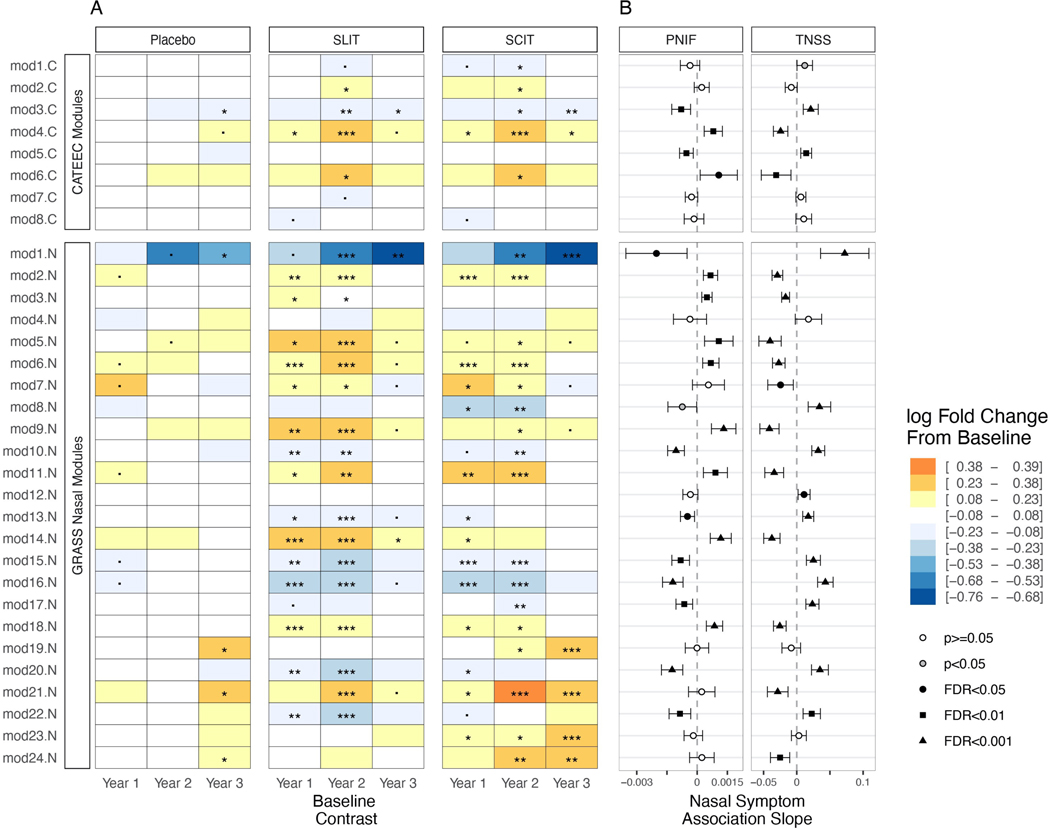
Results: SCIT and SLIT demonstrated similar changes in gene module expression over time. In nasal samples, alterations included downregulation of pathways of mucus hypersecretion, leukocyte migration/activation, and endoplasmic reticulum stress (log2 fold changes -0.133 to -0.640, false discovery rates [FDRs] <0.05). We observed upregulation of modules related to epithelial development, junction formation, and lipid metabolism (log2 fold changes 0.104 to 0.393, FDRs <0.05). In PBMCs, modules related to cellular stress response and type 2 cytokine signaling were reduced by immunotherapy (log2 fold changes -0.611 to -0.828, FDRs <0.05). Expression of these modules was also significantly associated with both Total Nasal Symptom Score and peak nasal inspiratory flow, indicating important links between treatment, module expression, and allergen response.

Conclusions: Our results identify specific molecular responses of the nasal airway impacting barrier function, leukocyte migration activation, and mucus secretion that are affected by both SCIT and SLIT, offering potential targets to guide novel strategies for AIT.

Keywords: Allergen immunotherapy; RNA sequencing; allergic rhinitis; subcutaneous immunotherapy; sublingual immunotherapy.


Conflict of interest statement

Disclaimer: Dr Togias’ co-authorship of this publication does not constitute an endorsement by the US National Institute of Allergy and Infectious Diseases, the National Institutes of Health or any other agency of the United States government.

GWS reports lecture fees from ALK-Abello and Mylan; sponsorship to attend a virtual conference (EAACI 2021) from GSK. MHS reports research grants Medical Research Council, Allergy Therapeutics, LETI Laboratorios, Revolo Biotherapeutics and lecture fees from Allergy Therapeutics and Leti Laboratorios. SRD has received research Grants from personal fees for consultancies from Revelo, ANGANY Inc., ALK and lecture fees from Abbott Laboratories, ALK, Allergopharma, Pneumo Update GmbH and Stallergenes. RMS, DL, NDJ, MS, SP, TQ, SS, ES, AOE, MP, MRJ, RVP, report no competing interests.

Competing interests: All authors, with the exception of AT report grants from NIH/NIAID during the conduct of study. MCA reports consulting fees from Regeneron outside the submitted work.

Figures

Figure 1.
Figure 1.
Differential module expression from post NAC nasal brush samples. Indicated are a) fold change values of log2 normalized module expression (logFC) in each treatment group contrasting years 1, 2, and 3 to baseline values; and b) association (model βs; 95% CI) of two clinical endpoints to module expression, PNIF and TNSS. Annotations in panel A indicate significance of log FC as follows: ˙ p < 0.05, * FDR<0.05, **FDR<0.01, ***FDR<0.001. Corresponding significance of β-coefficients in panel B is indicated by point color and shape legend included in the figure.
Figure 2.
Figure 2.
Differentially expressed modules from nasal brush samples collected post NAC in each treatment group at year 2. Volcano plots of modules differentially expressed at year 2 in (A) placebo, (B) SLIT, (C) SCIT with a negative change (blue) or positive change (red) seen in log-2 fold change versus -log10 FDR-value (top row). Volcano plots of modular expression with association to the regression slope coefficient compared to TNSS (D) and PNIF (E) seen with negative association (blue) or positive association (red) (bottom row). 5/32 modules that showed negative change in expression in both SLIT and SCIT were found to be positively associated with TNSS while being negatively associated with PNIF. Conversely, 10/32 modules showed a positive change in differential expression in both SLIT and SCIT and were found to be negatively associated with TNSS while being positively associated with PNIF.
Figure 3.
Figure 3.
Changes in modular gene expression from post NAC nasal brush samples over the duration of the GRASS study. Boxplot with log2 fold change at year 1, year 2, and year 3 relative to year 0 post NAC challenge in the placebo (grey), SLIT (blue) and SCIT (red) study groups. Modules with significantly decreased expression over time as compared to placebo are represented by upper row, (A) module 1.N (462 genes) and (B) module 3.C (96 genes). Gene expression in healthy controls (yellow) following nasal allergen challenge with grass pollen is also depicted for (C) module 1.N and (D) module 3.C. (E) Gene network plot of module 1.N from nasal brush samples depicting all known molecular interactions in STRING and significantly enriched for “T-cell immunity”. Genes are represented as circular nodes, and known gene–gene interactions from STRING are shown as connecting edges. The size of each node is proportional to the number of interactions. The networks are drawn as force-directed graphs, meaning that genes toward the center have the greatest centrality within the network. This module was seen to be decreased by immunotherapy. Significant changes within each group at a given timepoint relative to year 0 are noted with: *p-adj<0.05, **p-adj<0.01, ***p-adj<0.001.
Figure 4.
Figure 4.
Changes in modular gene expression from post NAC nasal brush samples over the duration of the GRASS study. Boxplot with log2 fold change at year 1, year 2, and year 3 relative to year 0 post NAC challenge in patient groups of placebo (grey), SLIT (blue) and SCIT (red). Modules with significantly increased expression noted in lower row by (A) module 2.N (148 genes), and (B) module 6.N (86 genes). Gene expression in healthy controls (yellow) following nasal allergen challenge with grass pollen is also depicted for (C) module 2.N and (D) module 6.N. (E) Gene network plot from nasal brush samples of modules 5.N, 6.N, 7.N, 9.N, 11.N, 18.N, 21.N depicting all known molecular interactions from STRING and significantly enriched for pathways related to both lipid metabolism and epithelial barrier integrity, which were seen to be increased by immunotherapy. Genes are represented as circular nodes, and known gene–gene interactions from STRING are shown as connecting edges. The size of each node is proportional to the number of interactions. The networks are drawn as force-directed graphs, meaning that genes toward the center have the greatest centrality within the network. Significant changes within each group at a given timepoint relative to year 0 are noted with: *p-adj<0.05, **p-adj<0.01, ***p-adj<0.00.
Figure 5.
Figure 5.
Schematic showing causal mediation of treatment effects (SCIT and SLIT) on TNSS by module 2.N. in nasal brush samples. Lower panel shows observed direct effects of SCIT (red) and SLIT (blue) therapies on TNSS (outcome) relative to Placebo (grey) at each time point. Upper panel shows effects of SCIT and SLIT therapies on Module 2.N expression (mediator) relative to Placebo at each time point. Right panel shows the relationship of Module 2.N expression to TNSS within each group, by which the direct effect on TNSS may be mediated. Module 2.N demonstrated significant mediating effect of both SCIT and SLIT on TNSS across the duration of the GRASS study in a moderated causal mediation analysis, accounting for 30.0% and 27.0% of the effect in SCIT and SLIT, respectively (p<0.05). Statistical results of this analysis are presented in the figure; “β on mediator” indicates the β-coefficient and associated p-value of the model comparing Module 2.N expression by each treatment group contrasted to placebo while adjusting for visit; “β mediator” indicates the β-coefficient and associated p-value of module expression in relation to TNSS by treatment group adjusting for visit; “β on TNSSAUC w/o mediator (w/ mediator)” shows the change in the β-coefficient of the model comparing TNSS by each treatment group contrasted to placebo, adjusting for visit, either without or with adjusting for Module 2.N expression, showing had Module 2.N expression partially accounts for the treatment effect on TNSS.
Figure 6.
Figure 6.
Differentially expressed modules from post NAC PBMC samples in each treatment group at year 2. Volcano plots of modules differentially expressed at year 2 in placebo (A), SLIT (B), SCIT (C) with a negative change (blue) or positive change (red) seen in log 2 fold change versus -log10 p-value (top row). Volcano plots of modular expression with association of (D) TNSS and (E) PNIF seen with negative association (blue) or positive association (red) in Bcoefficient versus -log10 p-value (bottom row).
Figure 7.
Figure 7.
Changes in post NAC PBMC modular gene expression over time. Boxplot showing Log2 fold changes in the allergen-provoked expression of (A) module 4.B and (B) module 11.B from year 0 to year 1, year 2, and year 3 in placebo (grey), SLIT (red) and SCIT (blue) participants. (C) Gene network plot of genes from 4.B containing molecules significantly enriched for IL-4/−13 signaling, and decreased by immunotherapy. (D) Gene network plot of 11.B, containing molecules significantly enriched as cytokine signaling, and decreased by immunotherapy. Significant changes within each group at a given timepoint relative to year 0 are noted with: *p-adj<0.05, **p-adj<0.01, ***p-adj<0.001
Figure 8.
Figure 8.
Schematic showing causal mediation of treatment effects (SCIT and SLIT) on TNSS by module 11.B in PBMC samples. Lower panel shows observed direct effects of SCIT (red) and SLIT (blue) therapies on TNSS (outcome) relative to Placebo (grey) at each time point. Upper panel shows effects of SCIT and SLIT therapies on Module 11.B expression (mediator) relative to Placebo at each time point. Right panel shows the relationship of Module 11.B expression to TNSS within each group, by which the direct effect on TNSS may be mediated. Module 11.B demonstrated significant mediating effect of both SCIT and SLIT on TNSS across the duration of the GRASS study in a moderated causal mediation analysis, accounting for 21.4% and 15.1% of the effect in SCIT and SLIT, respectively (p<0.05). Statistical results of this analysis are presented in the figure; “β on mediator” indicates the β-coefficient and associated p-value of the model comparing Module 11.B expression by each treatment group contrasted to placebo while adjusting for visit; “β mediator” indicates the β-coefficient and associated p-value of module expression in relation to TNSS by treatment group adjusting for visit; “β on TNSSAUC w/o mediator (w/ mediator)” shows the change in the β-coefficient of the model comparing TNSS by each treatment group contrasted to placebo, adjusting for visit, either without or with adjusting for Module 2.N expression, showing had Module 11.B expression partially accounts for the treatment effect on TNSS.

References

    1. Wheatley LM, Togias A. Clinical practice. Allergic rhinitis. N Engl J Med 2015; 372:456–63. - PMC - PubMed
    1. Guerra S, Sherrill DL, Martinez FD, Barbee RA. Rhinitis as an independent risk factor for adult-onset asthma. Journal of Allergy and Clinical Immunology 2002; 109:419–25. - PubMed
    1. Shaaban R, Zureik M, Soussan D, Neukirch C, Heinrich J, Sunyer J, et al. Rhinitis and onset of asthma: a longitudinal population-based study. The Lancet 2008; 372:1049–57. - PubMed
    1. Small P, Keith PK, Kim H. Allergic rhinitis. Allergy, asthma, and clinical immunology : official journal of the Canadian Society of Allergy and Clinical Immunology 2018; 14:51-. - PMC - PubMed
    1. Larsen JN, Broge L, Jacobi H. Allergy immunotherapy: the future of allergy treatment. Drug Discov Today 2016; 21:26–37. - PubMed

Publication types

Associated data