. 2023;16(5):685-709.
doi: 10.1016/j.jcmgh.2023.07.006. Epub 2023 Jul 15.

Inhibition of Abelson Tyrosine-Protein Kinase 2 Suppresses the Development of Alcohol-Associated Liver Disease by Decreasing PPARgamma Expression

Affiliations

Inhibition of Abelson Tyrosine-Protein Kinase 2 Suppresses the Development of Alcohol-Associated Liver Disease by Decreasing PPARgamma Expression

Greg Malnassy et al. Cell Mol Gastroenterol Hepatol. 2023.

Abstract

Background & aims: Alcohol-associated liver disease (ALD) represents a spectrum of alcohol use-related liver diseases. Outside of alcohol abstinence, there are currently no Food and Drug Administration-approved treatments for advanced ALD, necessitating a greater understanding of ALD pathogenesis and potential molecular targets for therapeutic intervention. The ABL-family proteins, including ABL1 and ABL2, are non-receptor tyrosine kinases that participate in a diverse set of cellular functions. We investigated the role of the ABL kinases in alcohol-associated liver disease.

Methods: We used samples from patients with ALD compared with healthy controls to elucidate a clinical phenotype. We established strains of liver-specific Abl1 and Abl2 knockout mice and subjected them to the National Institute on Alcohol Abuse and Alcoholism acute-on-chronic alcohol feeding regimen. Murine samples were subjected to RNA sequencing, AST, Oil Red O staining, H&E staining, Western blotting, and quantitative polymerase chain reaction to assess phenotypic changes after alcohol feeding. In vitro modeling in HepG2 cells as well as primary hepatocytes from C57BL6/J mice was used to establish this mechanistic link of ALD pathogenesis.

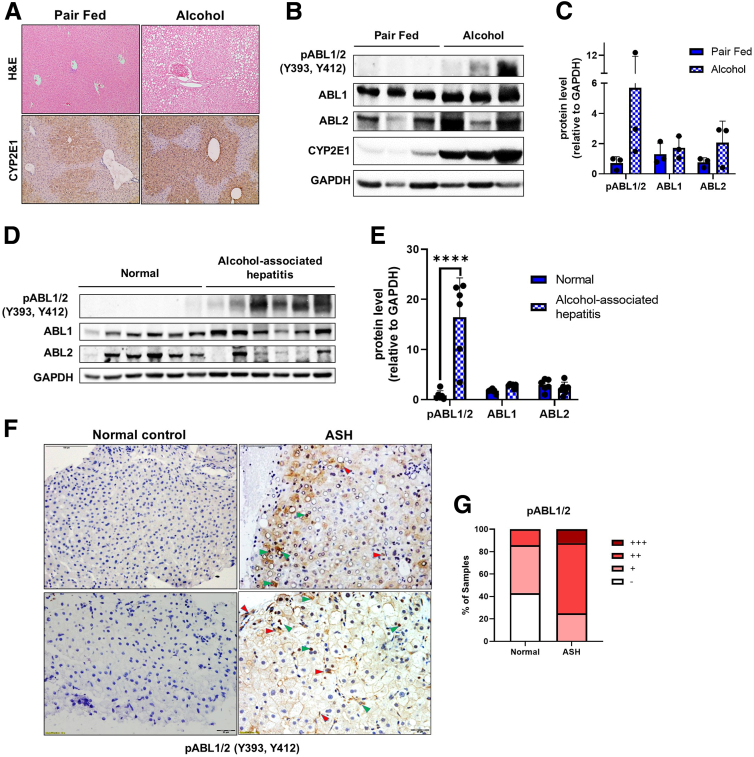
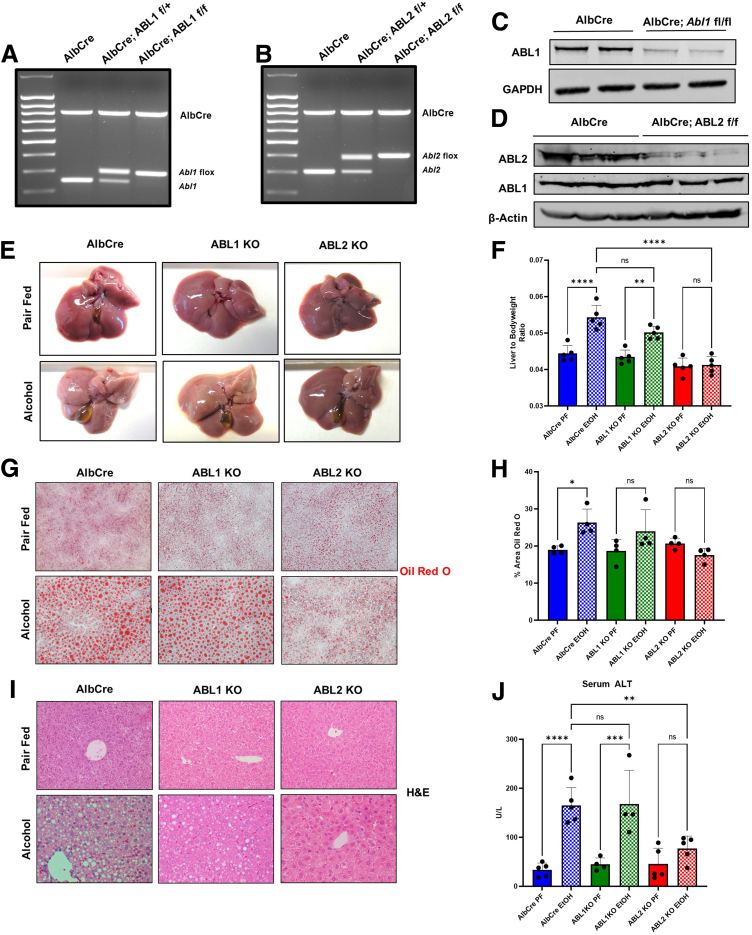
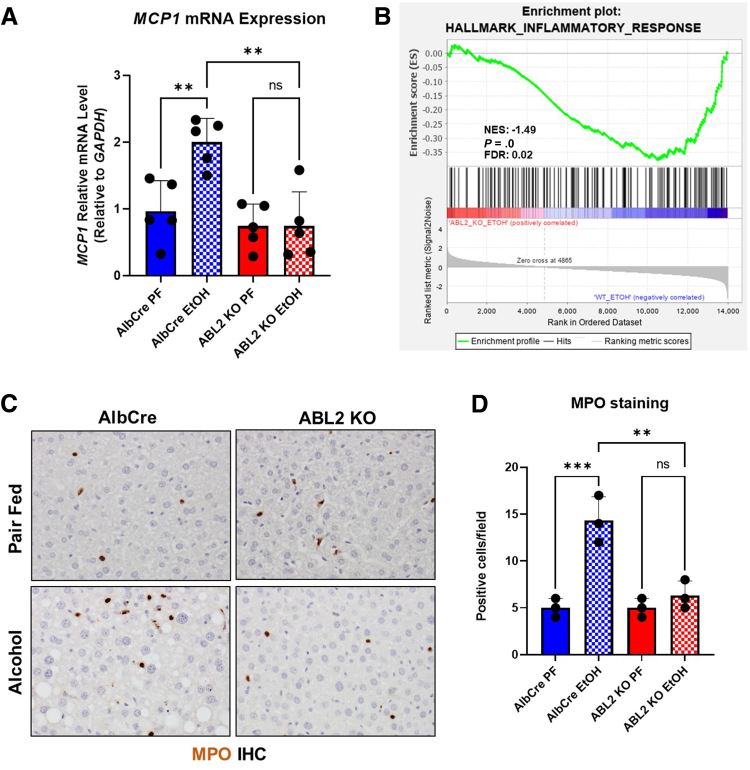
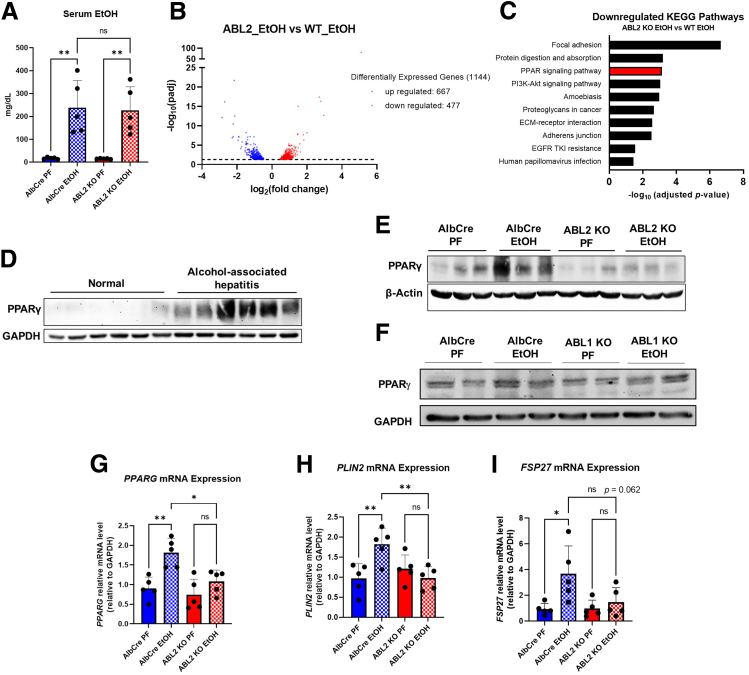
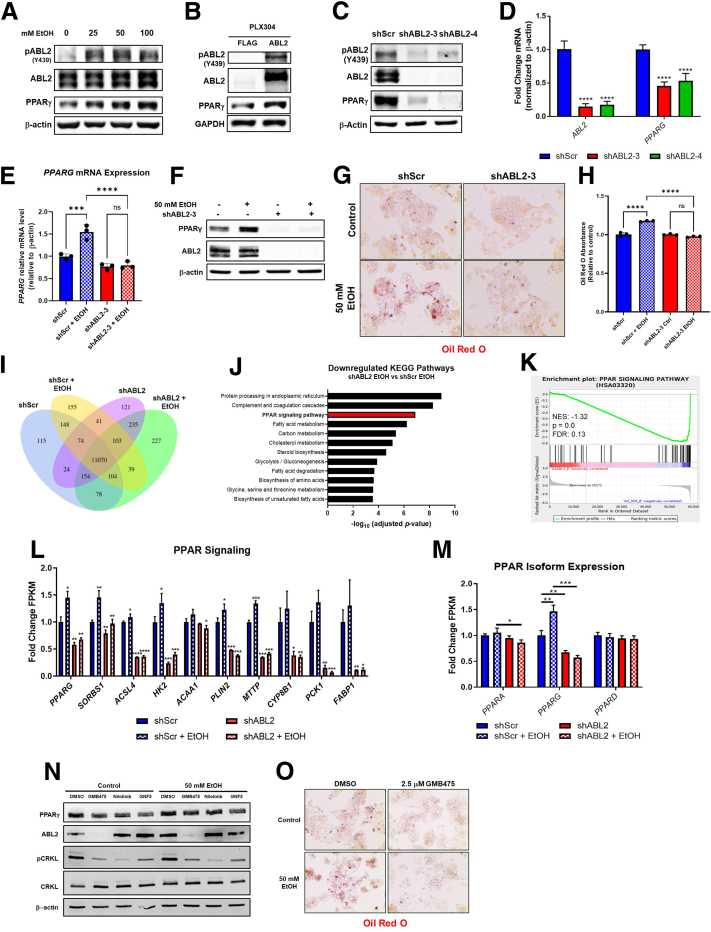
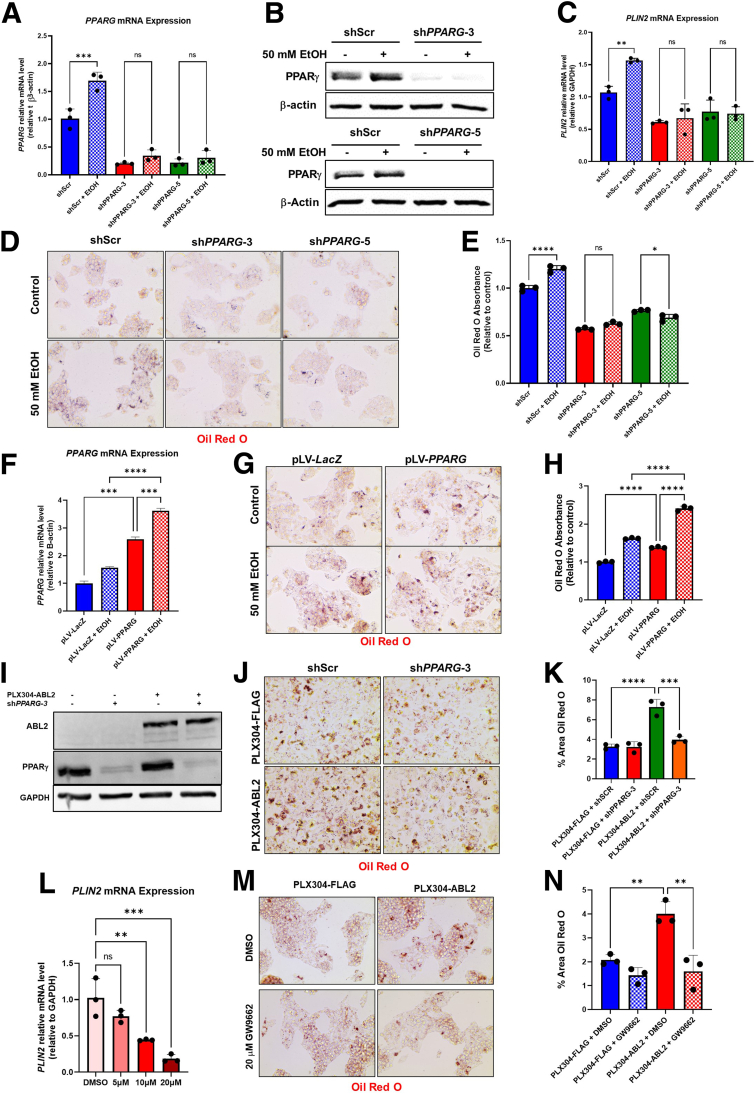
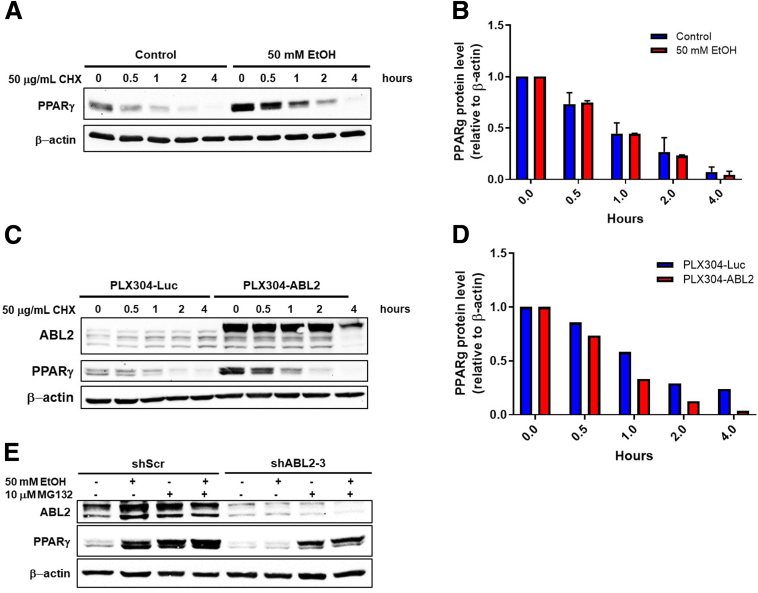
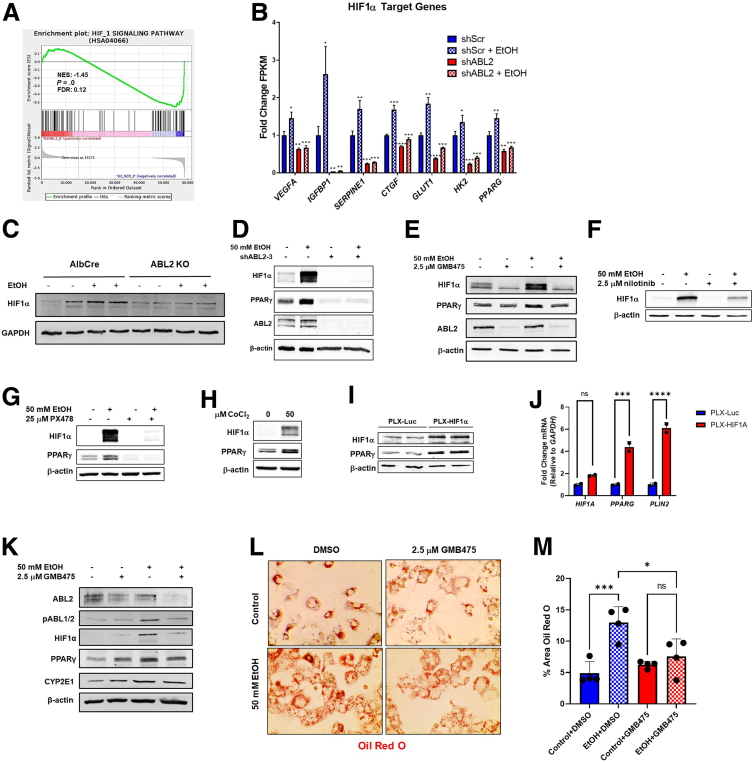
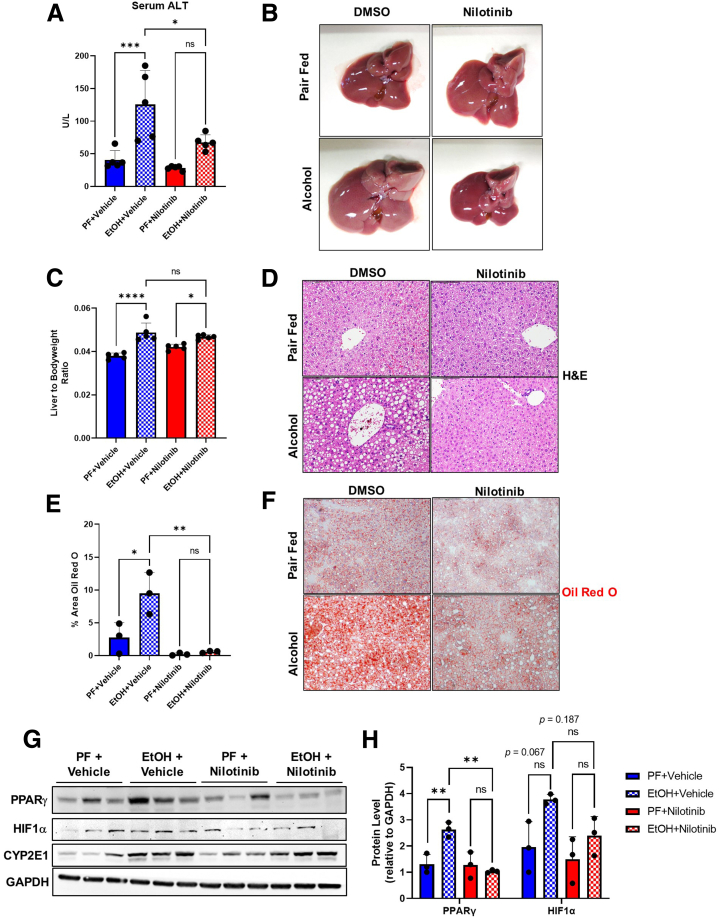
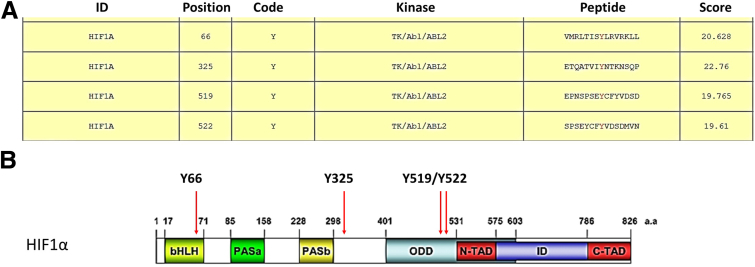
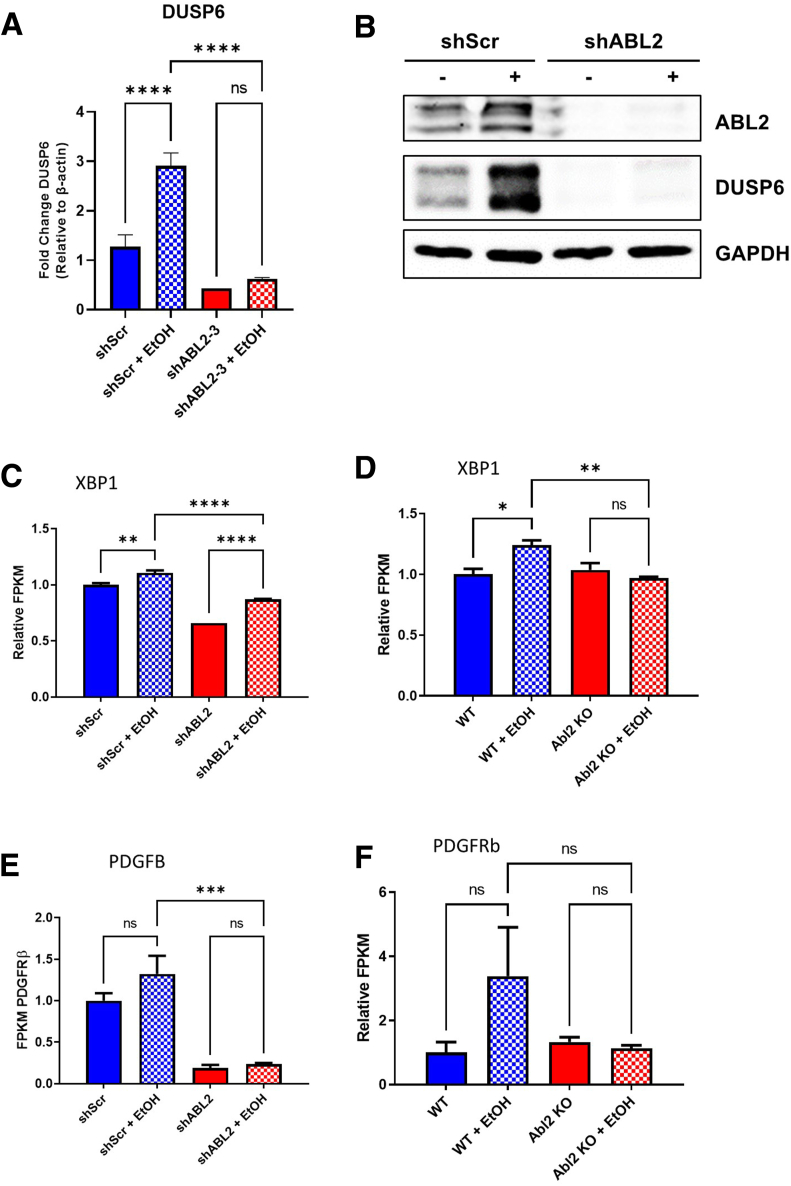
Results: We demonstrate that the ABL kinases are highly activated in ALD patient liver samples as well as in liver tissues from mice subjected to an alcohol feeding regimen. We found that the liver-specific knockout of Abl2, but not Abl1, attenuated alcohol-induced steatosis, liver injury, and inflammation. Subsequent RNA sequencing and gene set enrichment analyses of mouse liver tissues revealed that relative to wild-type alcohol-fed mice, Abl2 knockout alcohol-fed mice exhibited numerous pathway changes, including significantly decreased peroxisome proliferator activated receptor (PPAR) signaling. Further examination revealed that PPARγ, a previously identified regulator of ALD pathogenesis, was induced upon alcohol feeding in wild-type mice, but not in Abl2 knockout mice. In vitro analyses revealed that shRNA-mediated knockdown of ABL2 abolished the alcohol-induced accumulation of PPARγ as well as subsequent lipid accumulation. Conversely, forced overexpression of ABL2 resulted in increased PPARγ protein expression. Furthermore, we demonstrated that the regulation of hypoxia inducible factor 1 subunit alpha (HIF1α) by ABL2 is required for alcohol-induced PPARγ expression. Furthermore, treatment with ABL kinase inhibitors attenuated alcohol-induced PPARγ expression, lipid droplet formation, and liver injury.

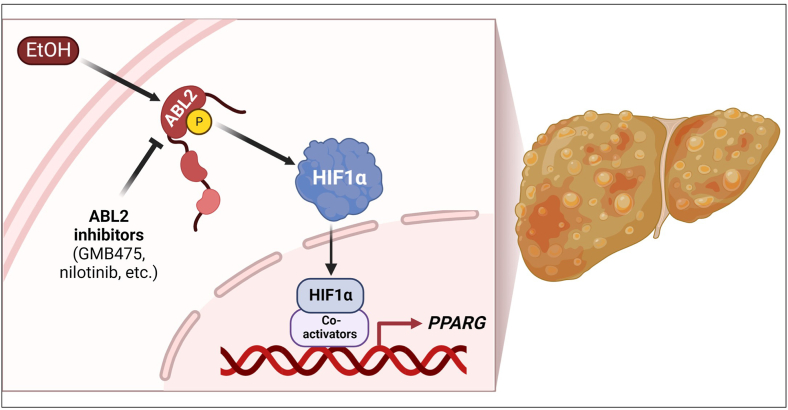
Conclusions: On the basis of our current evidence, we propose that alcohol-induced ABL2 activation promotes ALD through increasing HIF1α and the subsequent PPARγ expression, and ABL2 inhibition may serve as a promising target for the treatment of ALD.

Keywords: ABL2; Alcohol-Associated Liver Disease; HIF1α; Nilotinib; PPARγ.


Figures

Figure 1
Figure 1
ABL kinases are activated in murine models of alcoholism and alcoholic hepatitis patients. (A) Representative H&E (upper; original magnification, ×200) and CYP2E1 immunohistochemistry (lower; original magnification, ×200) staining of mouse liver tissue following NIAAA 10d + 1b acute-on-chronic alcohol feeding model (n = 8 mice per group). Equal males and females were used for each group. (B) Western blot analysis with (C) quantification of liver tissue from isolated NIAAA model 10d + 1b acute-on-chronic pair- and alcohol-fed mice. (D) Western blot analysis with (E) quantification of liver tissue from healthy donors and alcohol-associated hepatitis patients. Statistical analysis was conducted by t test. (F) Immunohistochemistry staining for pABL(1/2) proteins with (G) quantification in normal human livers and livers of ASH patients was evaluated by immunohistochemistry. Green arrows indicate hepatocytes with cytoplasmic and/or nuclear expression, and red arrows represent non-hepatocytes with cytoplasmic and/or nuclear expression, as determined by a pathologist. Values are mean ± standard error of the mean. Statistical analysis conducted by t test. ∗P < .05, ∗∗P < .01, ∗∗∗P < .001, ∗∗∗∗P < .0001.
Figure 2
Figure 2
Abl2 knockout, but not Abl1 knockout, attenuates alcohol-induced steatosis and liver injury. Genotyping PCR of (A) ABL1 and (B) ABL2 KO mice. Western blot confirmation analysis of liver tissue from (C) ABL1 and (D) ABL2 KO mice. (E) Gross images of AlbCre, ABL1 KO, and ABL2 KO mouse livers immediately after NIAAA 10d + 1b acute-on-chronic alcohol feeding (n = 5 mice per group). Equal males and females were used for each group. (F) Liver-to-body weight ratios of pair- and alcohol-fed mice from (E). Statistical analysis was conducted by one-way analysis of variance (ANOVA) test. (G) Oil Red O representative images and (H) staining quantification of pair- and alcohol-fed mice from (E). Statistical analysis conducted by one-way ANOVA test. (I) Representative H&E staining of mouse liver tissue from (E) (original magnification, ×200. (J) Serum ALT measurements of mouse serum from (E). Statistical analysis conducted by one-way ANOVA test. Values are mean ± standard error of the mean. ∗P < .05, ∗∗P < .01, ∗∗∗P < .001, ∗∗∗∗P < .0001.
Figure 3
Figure 3
ABL2 knockout attenuates alcohol-induced inflammatory response. (A) qPCR analysis of MCP1 expression in mouse liver tissue from AlbCre and ABL2 KO mouse livers immediately after NIAAA 10d + 1b acute-on-chronic alcohol feeding (n = 5 mice per group). Statistical analysis conducted by one-way ANOVA test. (B) Gene set enrichment analysis plot of Hallmark Inflammatory Response. (C) Immunohistochemistry staining and (D) quantification (n = 3) of myeloperoxidase in ABL2 KO and AlbCre control mice after alcohol feeding. Statistical analysis conducted by one-way ANOVA. Values are mean ± standard error of the mean. ∗P < .05, ∗∗P < .01, ∗∗∗P < .001, ∗∗∗∗P < .0001.
Figure 4
Figure 4
Deletion of Abl2 in hepatocytes does not affect morphology, histology, proliferation, or apoptosis in mouse liver. (A) Photographs of livers and representative pictures of H&E, Ki67 immunohistochemistry, and TUNEL from AlbCre and AlbCre; Abl2flox/flox mice at 6–8 weeks of age. (B) Quantification of Ki67 staining (n = 3). (C) Quantification of TUNEL staining (n = 3). Statistical analysis conducted by Student t test. Values are mean ± standard error of the mean. ∗P < .05, ∗∗P < .01, ∗∗∗P < .001, ∗∗∗∗P < .0001.
Figure 5
Figure 5
Hepatic deletion of Abl2 suppresses alcohol-induced PPAR signaling and PPARγ. (A) Serum EtOH levels from AlbCre control and ABL2 KO mice with both pair-fed and alcohol-fed groups (n = 5). Statistical analysis conducted by one-way ANOVA test. (B) Volcano plot and (C) top 10 down-regulated KEGG pathways from RNASeq analysis of ABL2 KO and WT NIAAA 10d + 1b alcohol-fed mice (n = 3 mice per group). Equal males and females were used for each group. (D) Western blot analysis of liver tissue from healthy donors and alcoholic hepatitis patients. (E) Western blot analysis of liver tissue from NIAAA 10d + 1b AlbCre and ABL2 KO pair- and alcohol-fed mice (n = 3 mice per group). (F) Western blot analysis of liver tissue from NIAAA 10d + 1b AlbCre and ABL1 KO pair- and alcohol-fed mice (n = 2 mice per group). qPCR analysis of (G) Pparg, (H) Plin2, and (I) Fsp27 mRNA expression of NIAAA 10d + 1b AlbCre and ABL2 KO pair- and alcohol-fed mouse liver tissue (n = 5 mice per group). Statistical analysis conducted by one-way ANOVA test. Values are mean ± standard error of the mean. ∗P < .05, ∗∗P < .01, ∗∗∗P < .001, ∗∗∗∗P < .0001.
Figure 6
Figure 6
Alcohol promotes ABL2 activation and PPARγ expression in ABL2-dependent manner in vitro. (A) Western blot analysis of HepG2 cells cultured in absence and presence of increasing alcohol concentrations for 72 hours. Data are representative of 3 independent experiments. (B) Western blot analysis of HepG2 cells transiently transfected with control (PLX304-FLAG) and ABL2-overexpressing vectors (PLX304-ABL2) for 48 hours. Data are representative of 3 independent experiments. (C) Western blot and (D) qPCR analysis of stable control (shScr) and ABL2 knockdown (shABL2-3 and shABL2-4) HepG2 cells. Statistical analysis conducted by one-way ANOVA test. (E) qPCR analysis of Pparg mRNA expression and of shScr control and shABL2 knockdown cells cultured in absence and presence of 50 mmol/L alcohol for 48 hours. Data are representative of 3 independent experiments. Statistical analysis conducted by one-way ANOVA test. (F) Western blot analysis of shScr control and shABL2 knockdown cells cultured in absence and presence of 50 mmol/L alcohol for 48 hours. Data are representative of 3 independent experiments. (G) Oil Red O staining (original magnification, ×100) with (H) quantification of control (shScr) and ABL2 knockdown cells cultured in absence and presence of 50 mmol/L alcohol for 48 hours. Data are representative of 3 independent experiments. Statistical analysis conducted by one-way ANOVA test. (I) Venn diagram of differentially expressed genes among shScr and shABL2 cells treated without and with 50 mmol/L alcohol for 72 hours (n = 3 technical replicates per condition). (J) Top down-regulated KEGG pathways between ABL2 knockdown and shScr cells cultured in absence and presence of 50 mmol/L alcohol for 72 hours (n = 3 technical replicates per condition). (K) PPAR signaling gene set enrichment analysis plot of shABL2 and shScr cultured in absence and presence of 50 mmol/L alcohol for 72 hours. (L) Fragments per kilobase of transcript per million mapped reads (FPKM) data of PPAR signaling genes (n = 3 technical replicates per gene). Statistical analysis conducted by one-way ANOVA test. (M) FPKM data of PPAR isoforms. Statistical analysis conducted by one-way ANOVA test. (N) Western blot analysis of HepG2 cells treated with vehicle (DMSO) or 2.5 μmol/L ABL kinase inhibitors in absence and presence of 50 mmol/L alcohol for 48 hours. (O) Oil Red O staining of HepG2 cells treated with vehicle (DMSO) or 2.5 μmol/L GMB475 in absence and presence of 50 mmol/L alcohol (original magnification, ×100). Results are representative of 3+ biological replicate experiments. Values are mean ± standard errors of the mean. ∗P < .05, ∗∗P < .01, ∗∗∗P < .001, ∗∗∗∗P < .0001.
Figure 7
Figure 7
PPARγ promotes alcohol-induced steatosis. (A) qPCR analysis of PPARG mRNA expression of PPARγ knockdown cells cultured in absence and presence of 50 mmol/L alcohol for 48 hours. Data are representative from 3 independent experiments. Statistical analysis conducted by one-way ANOVA test. (B) Western blot confirmation of control (shScr) and PPARG knockdown HepG2 cells cultured in absence and presence of 50 mmol/L alcohol for 48 hours. Data are representative from 2 independent experiments with biological duplicates. (C) PLIN2 mRNA expression of PPARγ knockdown cells cultured in absence and presence of 50 mmol/L alcohol for 48 hours. Data are representative from 3 independent experiments. Statistical analysis conducted by one-way ANOVA test. (D) Oil Red O staining (original magnification, ×100) and (E) quantification of control (shScr) and PPARG knockdown HepG2 cells (shPPARγ-3 and shPPARγ-5) cultured in absence and presence of 50 mmol/L alcohol for 48 hours. Data are representative from 2 independent experiments with biological duplicates. Statistical analysis conducted by one-way ANOVA test. (F) qPCR analysis of PPARG mRNA expression of stable control (pLV-LacZ) and PPARG-overexpressing (pLV-PPARg) HepG2 cells cultured in absence and presence of 50 mmol/L alcohol for 48 hours. Data are representative from 2 independent experiments with biological duplicates. Statistical analysis conducted by one-way ANOVA test. (G) Oil Red O staining (original magnification, ×100) and (H) quantification of stable control (pLV-LacZ) and PPARG-overexpressing (pLV-PPARG) HepG2 cells. Data are representative from 2 independent experiments with biological duplicates. Statistical analysis conducted by one-way ANOVA test. (I) Western blot confirmation of simultaneous ABL2 overexpression and PPARγ knockdown in HepG2 cells. Data are representative from 2 independent experiments. (J) Oil Red O staining and (K) quantification of HepG2 cells with PLX304-ABL2 or control PLX304-FLAG expression and shPPARG-3 or shScr control. Data are representative from 2 independent experiments with biological duplicates. Statistical analysis conducted by one-way ANOVA test. (L) qPCR analysis of PLIN2 mRNA expression in HepG2 cells treated with 0, 5, 10, or 20 μmol/L GW9662. Data are representative from 3 independent experiments. Statistical analysis conducted by one-way ANOVA test. (M) Oil Red O staining and (N) quantification of HepG2 cells with PLX304-ABL2 or control PLX304-FLAG expression treated with 20 μmol/L GW9662 or DMSO control. Data are representative from 3 independent experiments. Statistical analysis conducted by one-way ANOVA test. Values are mean ± standard error of the mean. ∗P < .05, ∗∗P < .01, ∗∗∗P < .001, ∗∗∗∗P < .0001.
Figure 8
Figure 8
Alcohol does not promote PPARγ stability. (A) Western blot analysis of wild-type HepG2 cells cultured in absence and presence of 50 mmol/L alcohol before 50 μg/mL cycloheximide treatment for 0, 0.5, 1, 2, and 4 hours. (B) Quantification of PPARγ protein levels from (A) after β-actin normalization. Values are mean ± standard error of the mean of 2 biological replicate experiments. (C) Western blot analysis of stable control (PLX-Luc) and ABL2-overexpressing HepG2 cells treated with 50 μg/mL cycloheximide for 0, 0.5, 1, 2, and 4 hours with accompanying (D) quantification for C. (E) MG132 treatment of alcohol-treated shScr and shABL2 cells. Data are representative of n = 3+ biological replicates. Values are mean ± standard error of the mean.
Figure 9
Figure 9
Alcohol induces ABL2-mediated PPARγ via HIF1α. (A) Gene set enrichment analysis plot of HIF1 signaling. (B) FPKM data of HIF1 signaling genes (n = 3 technical replicates per condition). (C) Western blot analysis of HIF1α in liver tissue from NIAAA 10d + 1b AlbCre and ABL2 KO pair- and alcohol-fed mice (n = 2 mice per group). (D) Western blot analysis of shScr and shABL2 HepG2 cells cultured in absence and presence of 50 mmol/L alcohol for 48 hours. Data are representative of 3 biological replicate experiments. Western blot analysis of vehicle (DMSO). (E) GMB475- and (F) nilotinib-treated HepG2 cells cultured in absence and presence of 50 mmol/L alcohol for 48 hours. Data are representative of 2 biological replicate experiments. (G) Western blot analysis of HepG2 cells treated with vehicle (DMSO) or 25 μmol/L PX478 for 48 hours in absence and presence of 50 mmol/L alcohol. Data are representative of 3 biological replicate experiments. (H) Western blot analysis of HepG2 cells treated with vehicle (H2O) or 50 mmol/L cobalt chloride for 48 hours. Data are representative of 3 biological replicates. (I) Western blot and (J) qPCR analysis of stable control (PLX-Luc) and HIF1A-overexpressing HepG2 cells after 5 days of 2 μg/mL blasticidin selection. Data are representative of 2 biological replicate experiments. Statistical analysis conducted by one-way ANOVA test. (K) Western blot analysis of vehicle (DMSO) or GMB475-treated mouse primary hepatocytes cultured in absence and presence of 50 mmol/L alcohol for 48 hours. Data are representative from 2 independent experiments with biological duplicates. (L) Oil Red staining (original magnification, ×100) of vehicle (DMSO) or GMB475-treated mouse primary hepatocytes cultured in absence and presence of 50 mmol/L alcohol for 48 hours with accompanying (M) quantification. Data are representative from 2 independent experiments with biological duplicates. Statistical analysis conducted by one-way ANOVA test. Values are mean ± standard error of the mean. ∗P < .05, ∗∗P < .01, ∗∗∗P < .001, ∗∗∗∗P < .0001.
Figure 10
Figure 10
ABL2 inhibition attenuates alcohol-induced liver injury in vivo. C57BL6/J mice were subjected to NIAAA 10d + 1b acute-on-chronic alcohol feeding model. Ethanol-fed and pair-fed mice were further stratified into nilotinib or vehicle treatment groups (n = 5 mice per group). Both males and females were used for each group. (A) ALT measurements from serum of treated mice (n = 5). Statistical analysis conducted by one-way ANOVA test. (B) Gross images of livers. (C) Liver to body weight ratios (n = 5). Statistical analysis conducted by one-way ANOVA test. (D) Representative H&E (original magnification, ×200) staining of mouse liver tissue. (E) Oil Red O quantification (n = 3) (F) and staining (original magnification, ×200). Statistical analysis conducted by one-way ANOVA test. (G) Western blot analysis with (H) quantification of liver tissue (n = 3). Statistical analysis conducted by one-way ANOVA test. Data shown are representative of entire cohort. Values are mean ± standard error of the mean. ∗P < .05, ∗∗P < .01, ∗∗∗P < .001, ∗∗∗∗P < .0001.
Figure 11
Figure 11
Schematic model for role of ABL2 and action mechanisms in ALD development. ABL kinases are highly activated in AH patient liver samples as well as liver tissues from mice subjected to an alcohol-feeding regimen. Knockout of ABL2, but not ABL1, abrogated alcohol-induced steatosis, liver injury, and inflammation in mice. Mechanistically, ABL2 inhibition suppresses alcohol-induced steatosis by decreasing PPARγ expression through regulation of HIF1α. Created with BioRender.com.
Figure 12
Figure 12
Putative ABL2 tyrosine phosphorylation sites on HIF1α. (A) Phosphorylation site prediction tool GPS 5.0 identified 4 putative ABL2 tyrosine phosphorylation sites on HIF1α. (B) Diagram indicates location of putative ABL2 tyrosine phosphorylation sites on HIF1α.
Figure 13
Figure 13
Assessment of potential mediators of ABL2-dependent alcohol-induced liver injury. (A) Real-time PCR analysis of DUSP6 mRNA levels in stable control (shScr) and ABL2 knockdown HepG2 cells cultured in absence and presence of 50 mmol/L alcohol for 48 hours. Statistical analysis conducted by one-way ANOVA test. (B) Western blot analysis of DUSP6 protein levels from (A). (C) FPKM data of XBP1 expression from RNA sequencing performed on stable control (shScr) and ABL2 knockdown HepG2 cells cultured in absence and presence of 50 mmol/L alcohol for 48 hours. Statistical analysis conducted by one-way ANOVA test. (D) FPKM data of XBP1 mRNA expression from RNA sequencing performed on NIAAA 10d + 1b AlbCre and ABL2 KO pair- and alcohol-fed mouse liver tissue (n = 5 mice per group). Statistical analysis conducted by one-way ANOVA test. (E) FPKM data of PDGFB expression from RNA sequencing performed on expression of stable control (shScr) and ABL2 knockdown HepG2 cells cultured in absence and presence of 50 mmol/L alcohol for 48 hours. Statistical analysis conducted by one-way ANOVA test. (F) FPKM data of PDGFB mRNA expression from RNA sequencing performed on NIAAA 10d + 1b AlbCre and ABL2 KO pair- and alcohol-fed mouse liver tissue (n = 5 mice per group). Statistical analysis conducted by one-way ANOVA test. Values are mean ± standard error of the mean. ∗P < .05, ∗∗P < .01, ∗∗∗P < .001, ∗∗∗∗P < .0001.

Similar articles

Cited by

References

    1. Yoon Y.-H., Chen C.M. National Institute on Alcohol Abuse and Alcoholism; 2018. Liver cirrhosis mortality in the United States: national, state, and regional trends, 2000-2015. - PMC - PubMed
    1. Gao B., Bataller R. Alcoholic liver disease: pathogenesis and new therapeutic targets. Gastroenterology. 2011;141:1572–1585. - PMC - PubMed
    1. Osna N.A., Donohue T.M., Kharbanda K.K. Alcoholic liver disease: pathogenesis and current management. Alcohol Res. 2017;38:147–161. - PMC - PubMed
    1. Zhou Z., Wang L., Song Z., et al. A critical involvement of oxidative stress in acute alcohol-induced hepatic TNF-alpha production. Am J Pathol. 2003;163:1137–1146. - PMC - PubMed
    1. Lieber C.S. Alcoholic fatty liver: its pathogenesis and mechanism of progression to inflammation and fibrosis. Alcohol. 2004;34:9–19. - PubMed

Publication types