. 2023 Oct;51(10):1403-1418.
doi: 10.1124/dmd.123.001403. Epub 2023 Jul 17.

Utility of Minimal Physiologically Based Pharmacokinetic Models for Assessing Fractional Distribution, Oral Absorption, and Series-Compartment Models of Hepatic Clearance

Affiliations

Utility of Minimal Physiologically Based Pharmacokinetic Models for Assessing Fractional Distribution, Oral Absorption, and Series-Compartment Models of Hepatic Clearance

Xiaonan Li et al. Drug Metab Dispos. 2023 Oct.

Abstract

Minimal physiologically based pharmacokinetic (mPBPK) models are physiologically relevant, require less information than full PBPK models, and offer flexibility in pharmacokinetics (PK). The well-stirred hepatic model (WSM) is commonly used in PBPK, whereas the more plausible dispersion model (DM) poses computational complexities. The series-compartment model (SCM) mimics the DM but is easier to operate. This work implements the SCM and mPBPK models for assessing fractional tissue distribution, oral absorption, and hepatic clearance using literature-reported blood and liver concentration-time data in rats for compounds mainly cleared by the liver. Further handled were various complexities, including nonlinear hepatic binding and metabolism, differing absorption kinetics, and sites of administration. The SCM containing one to five (n) liver subcompartments yields similar fittings and provides comparable estimates for hepatic extraction ratio (ER), prehepatic availability (Fg ), and first-order absorption rate constants (ka ). However, they produce decreased intrinsic clearances (CLint ) and liver-to-plasma partition coefficients (Kph ) with increasing n as expected. Model simulations demonstrated changes in intravenous and oral PK profiles with alterations in Kph and ka and with hepatic metabolic zonation. The permeability (PAMPA P) of the various compounds well explained the fitted fractional distribution (fd ) parameters. The SCM and mPBPK models offer advantages in distinguishing systemic, extrahepatic, and hepatic clearances. The SCM allows for incorporation of liver zonation and is useful in assessing changes in internal concentration gradients potentially masked by similar blood PK profiles. Improved assessment of intraorgan drug concentrations may offer insights into active moieties driving metabolism, biliary excretion, pharmacodynamics, and hepatic toxicity. SIGNIFICANCE STATEMENT: The minimal physiologically based pharmacokinetic model and the series-compartment model are useful in assessing oral absorption and hepatic clearance. They add flexibility in accounting for various drug- or system-specific complexities, including fractional distribution, nonlinear binding and saturable hepatic metabolism, and hepatic zonation. These models can offer improved insights into the intraorgan concentrations that reflect physiologically active moieties often driving disposition, pharmacodynamics, and toxicity.


Figures

None
Graphical abstract
Fig. 1.
Fig. 1.
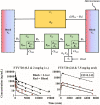
Minimal PBPK model extended with the hepatic series-compartment model (SCM) containing n liver subcompartments. The model components shown with broken lines are applied as needed.
Fig. 2.
Fig. 2.
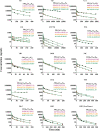
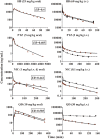
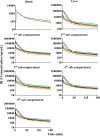
Blood and liver concentration-time profiles of 14 model compounds after intravenous dosing. Measured concentrations in blood and liver are indicated by solid symbols in red and black. Solid and dashed lines represent model fittings of blood and liver data by one-tissue mPBPK extended with the SCM containing one (purple), two (orange), and five (green) liver subcompartments. The estimated ER, fubCLint, and Kph (Bmax and Kd for CQ and QD) values for each of the compounds are listed with the same color coding as those for the model fittings.
Fig. 3.
Fig. 3.
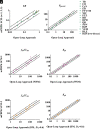
Comparisons of the estimated ER (A), Kph,AR (B), fubCLint (C and E), and Kph (D and F) by the one-tissue mPBPK model with the SCM (n = 1, 2, and 5) and those obtained by the open-loop approach (Li and Jusko, 2022). The Kph values for CQ and QD shown were calculated from Bmax/Kd. The parameter values for DZP estimated by the two-tissue mPBPK model with the SCM are also plotted for comparisons (open triangles). The solid line represents unity, and the dashed lines indicate 2-fold range from unity. The color coding is the same as used in Fig. 2.
Fig. 4.
Fig. 4.
Blood and liver concentration-time profiles of DPH after i.v. bolus administration of 10- (red), 25- (green), or 40- (orange) mg/kg doses. Closed circles and solid lines represent the observations and model fittings of blood concentrations. Open circles and dashed lines indicate the observed and model-fitted liver concentrations. The measured data in panel (A) were obtained from Gerber et al. (1971), and those in panel (B) were from Itoh et al. (1988).
Fig. 5.
Fig. 5.
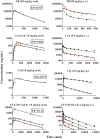
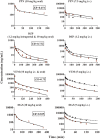
Blood and liver concentration-time profiles of TB, CyA, CQ, and FTY720 after oral, intravenous, or intraperitoneal (CQ only) dosing. Measured concentrations in blood and liver are indicated by solid and open symbols. Solid and dashed purple lines represent model fittings of blood and liver data by the SCM with one liver subcompartment (=WSM). The estimated ER value for each of the compounds is listed.
Fig. 6.
Fig. 6.
Blood and liver concentration-time profiles of HB, PTZ, NIC, and QD after oral or intravenous dosing. Symbols, lines, and color coding are the same as used in Fig. 5.
Fig. 7.
Fig. 7.
Blood and liver concentration-time profiles of PPN, DZP, VEM, and DLZ after oral, intravenous, or intraportal (DZP only) dosing. Symbols, lines, and color coding are the same as used in Fig. 5.
Fig. 8.
Fig. 8.
Relationship between the model estimated tissue fd and the apparent PAMPA P (i.e., fupP/Rb).
Fig. 9.
Fig. 9.
Effects of changing Kph on predicting the blood and liver concentration-time profiles for DLZ after intravenous or oral dosing by the mPBPK model extended with the SCM (n = 1 and 5). Color coded lines represent model simulations with Kph (17.87 for SCM1 and 8.09 for SCM5, black), −2-fold Kph (green), +2-fold Kph (orange), −5-fold Kph (red), and +5-fold Kph (purple).
Fig. 10.
Fig. 10.
Fold changes in the PK parameters calculated based on the PK profiles for DLZ simulated with varying values of Kph displayed in Fig. 9. Different colors represent the results obtained by the mPBPK model extended with SCM-1 (purple) or SCM-5 (green). The nominal PK parameter values at 1 × Kph are listed with the same color coding as that for the indicated model.
Fig. 11.
Fig. 11.
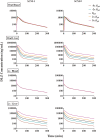
Effects of changing ka on predicting the blood, liver, and hepatic subcompartment concentration-time profiles for DLZ after oral dosing by the mPBPK model extended with the SCM (n = 5). Color coded lines indicate model simulations with ka (0.125 minutes−1, black), −2-fold ka (green), +2-fold ka (orange), −5-fold ka (red), and +5-fold ka (blue).
Fig. 12.
Fig. 12.
Fold changes in the PK parameters calculated based on the PK profiles for DLZ simulated with varying ka values shown in Fig. 11. Different compartments are color coded as indicated. The nominal parameter values at 1 × ka are listed with the same color coding as that used for the corresponding compartments.
Fig. 13.
Fig. 13.
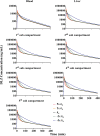
Simulated concentration-time profiles for DLZ in blood, liver, and each of the liver subcompartments in rats after bolus administration of a 5-mg/kg i.v. dose (solid lines) or 20-mg/kg oral dose (dashed lines). Different hepatic zonation patterns are color coded as follows: lower PP CLint (green), uniform CLint (black), and lower PV CLint (orange).
Fig. 14.
Fig. 14.
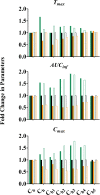
Fold changes in Tmax, AUCinf, and Cmax computed from the simulated PK profiles for DLZ in blood (Cb), liver (Ch), and each of the liver subcompartments (Ch1 through Ch5) after intravenous (solid bars) and oral (open bars) administration with hepatic enzyme zonation [lower PP CLint (green) or lower PV CLint (orange)] compared with those obtained with uniform enzyme distribution (black).

Similar articles

Cited by

References

    1. Abu-Zahra TN, Pang KS (2000) Effect of zonal transport and metabolism on hepatic removal: enalapril hydrolysis in zonal, isolated rat hepatocytes in vitro and correlation with perfusion data. Drug Metab Dispos 28:807–813. - PubMed
    1. Adelusi SA, Salako LA (1982) Kinetics of the distribution and elimination of chloroquine in the rat. Gen Pharmacol 13:433–437. - PubMed
    1. Al Shoyaib A, Archie SR, Karamyan VT(2019) Intraperitoneal Route of Drug Administration: Should it Be Used in Experimental Animal Studies? Pharm Res 37:12. - PMC - PubMed
    1. Allison AC, Young MR (1964) Uptake of dyes and drugs by living cells in culture. Life Sci 3:1407–1414. - PubMed
    1. Anissimov YG, Roberts MS (2002) A compartmental model of hepatic disposition kinetics: 1. Model development and application to linear kinetics. J Pharmacokinet Pharmacodyn 29:131–156. - PubMed

Publication types

LinkOut - more resources