

Effects of Ibudilast on Retinal Atrophy in Progressive Multiple Sclerosis Subtypes: Post Hoc Analyses of the SPRINT-MS Trial
- PMID: 37460235
- PMCID: PMC10491449
- DOI: 10.1212/WNL.0000000000207551
Effects of Ibudilast on Retinal Atrophy in Progressive Multiple Sclerosis Subtypes: Post Hoc Analyses of the SPRINT-MS Trial
Abstract
Background and objectives: Ganglion cell + inner plexiform layer (GCIPL) thinning, measured by optical coherence tomography (OCT), reflects global neurodegeneration in multiple sclerosis (MS). Atrophy of the inner (INL) and outer nuclear layer (ONL) may also be prominent in progressive MS (PMS). The phase 2, SPRINT-MS trial found reduced brain atrophy with ibudilast therapy in PMS. In this post hoc analysis of the SPRINT-MS trial, we investigate (1) retinal atrophy (2) differences in response by subtype and (3) associations between OCT and MRI measures of neurodegeneration.
Methods: In the multicenter, double-blind SPRINT-MS trial, participants with secondary progressive MS (SPMS) or primary progressive MS (PPMS) were randomized to ibudilast or placebo. OCT and MRI data were collected every 24 weeks for 96 weeks. Extensive OCT quality control and algorithmic segmentation produced consistent results across Cirrus HD-OCT and Spectralis devices. Primary endpoints were GCIPL, INL, and ONL atrophy, assessed by linear mixed-effects regression. Secondary endpoints were associations of OCT measures, brain parenchymal fraction, and cortical thickness, assessed by partial Pearson correlations.
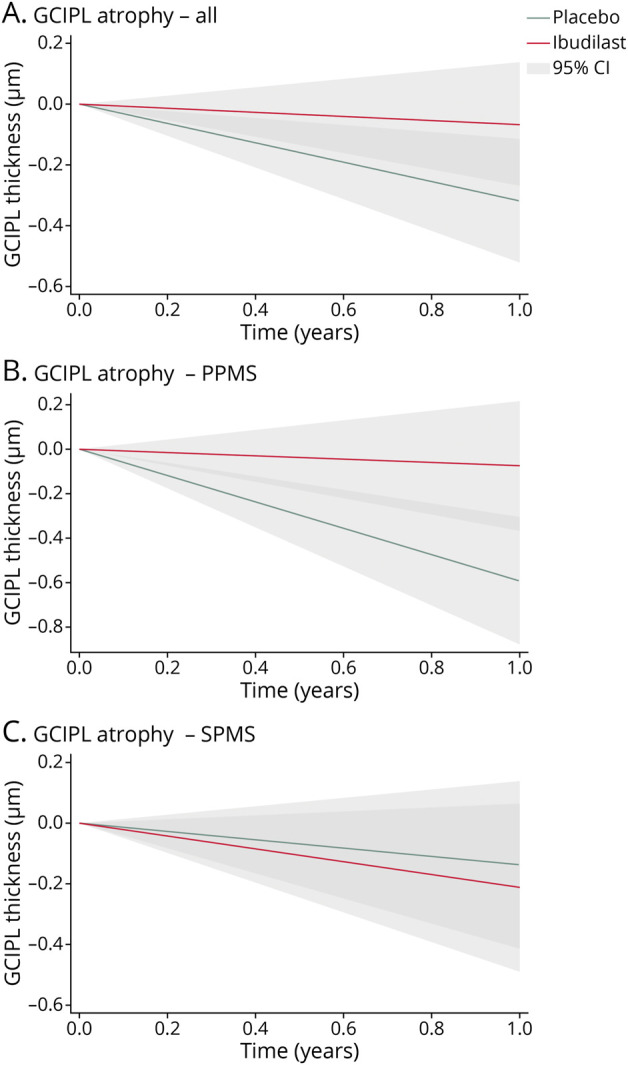
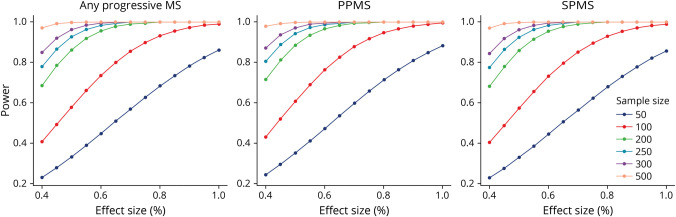
Results: One hundred thirty-four PPMS and 121 SPMS participants were included. GCIPL atrophy was 79% slower in the ibudilast (-0.07 ± 0.23 µm/y) vs placebo group (-0.32 ± 0.20 µm/y, p = 0.003). This effect predominated in the PPMS cohort (ibudilast: -0.08 ± 0.29 µm/y vs placebo: -0.60 ± 0.29 µm/y, a decrease of 87%, p < 0.001) and was not detected in the SPMS cohort (ibudilast: -0.21 ± 0.28 µm/y vs placebo: -0.14 ± 0.27 µm/y, p = 0.55). GCIPL, INL, and ONL atrophy rates correlated with whole brain atrophy rates across the cohort (r = 0.27, r = 0.26, and r = 0.20, respectively; p < 0.001). Power calculations from these data show future trials of similar size and design have ≥80% power to detect GCIPL atrophy effect sizes of approximately 40%.
Discussion: Ibudilast treatment decreased GCIPL atrophy in PMS, driven by the PPMS cohort, with no effect seen in SPMS. Modulated atrophy of retinal layers may be detectable in sample sizes smaller than the SPRINT-MS trial and correlate with whole brain atrophy in PMS, further highlighting their utility as outcomes in PMS.
Classification of evidence: This study provides Class II evidence that ibudilast reduces composite ganglion cell + inner plexiform layer atrophy, without reduction of inner or outer nuclear layer atrophy, in patients with primary progressive MS but not those with secondary progressive MS.
© 2023 American Academy of Neurology.
Figures
Comment in
-
Optical Coherence Tomography, Retinal Atrophy, and Neurodegeneration in Progressive Multiple Sclerosis: Sprinting to the Finish.Neurology. 2023 Sep 5;101(10):420-421. doi: 10.1212/WNL.0000000000207607. Epub 2023 Jul 17. Neurology. 2023. PMID: 37460230 No abstract available.
References
-
- Toussaint D, Périer O, Verstappen A, Bervoets S. Clinicopathological study of the visual pathways, eyes, and cerebral hemispheres in 32 cases of disseminated sclerosis. J Clin Neuroophthalmol. 1983;3(3):211-220. - PubMed
-
- Saidha S, Syc SB, Durbin MK, et al. Visual dysfunction in multiple sclerosis correlates better with optical coherence tomography derived estimates of macular ganglion cell layer thickness than peripapillary retinal nerve fiber layer thickness. Mult Scler. 2011;17(12):1449-1463. doi: 10.1177/1352458511418630 - DOI - PubMed
-
- Nguyen J, Rothman A, Gonzalez N, et al. Macular ganglion cell and inner plexiform layer thickness is more strongly associated with visual function in multiple sclerosis than bruch membrane opening–minimum rim width or peripapillary retinal nerve fiber layer thicknesses. J Neuroophthalmol. 2019;39(4):444-450. doi: 10.1097/wno.0000000000000768 - DOI - PMC - PubMed
Publication types
MeSH terms
Substances
Grants and funding
LinkOut - more resources
Full Text Sources
Medical
Research Materials