

Lung Function Trajectories and Associated Mortality among Adults with and without Airway Obstruction
- PMID: 37460250
- PMCID: PMC10867942
- DOI: 10.1164/rccm.202211-2166OC
Lung Function Trajectories and Associated Mortality among Adults with and without Airway Obstruction
Abstract
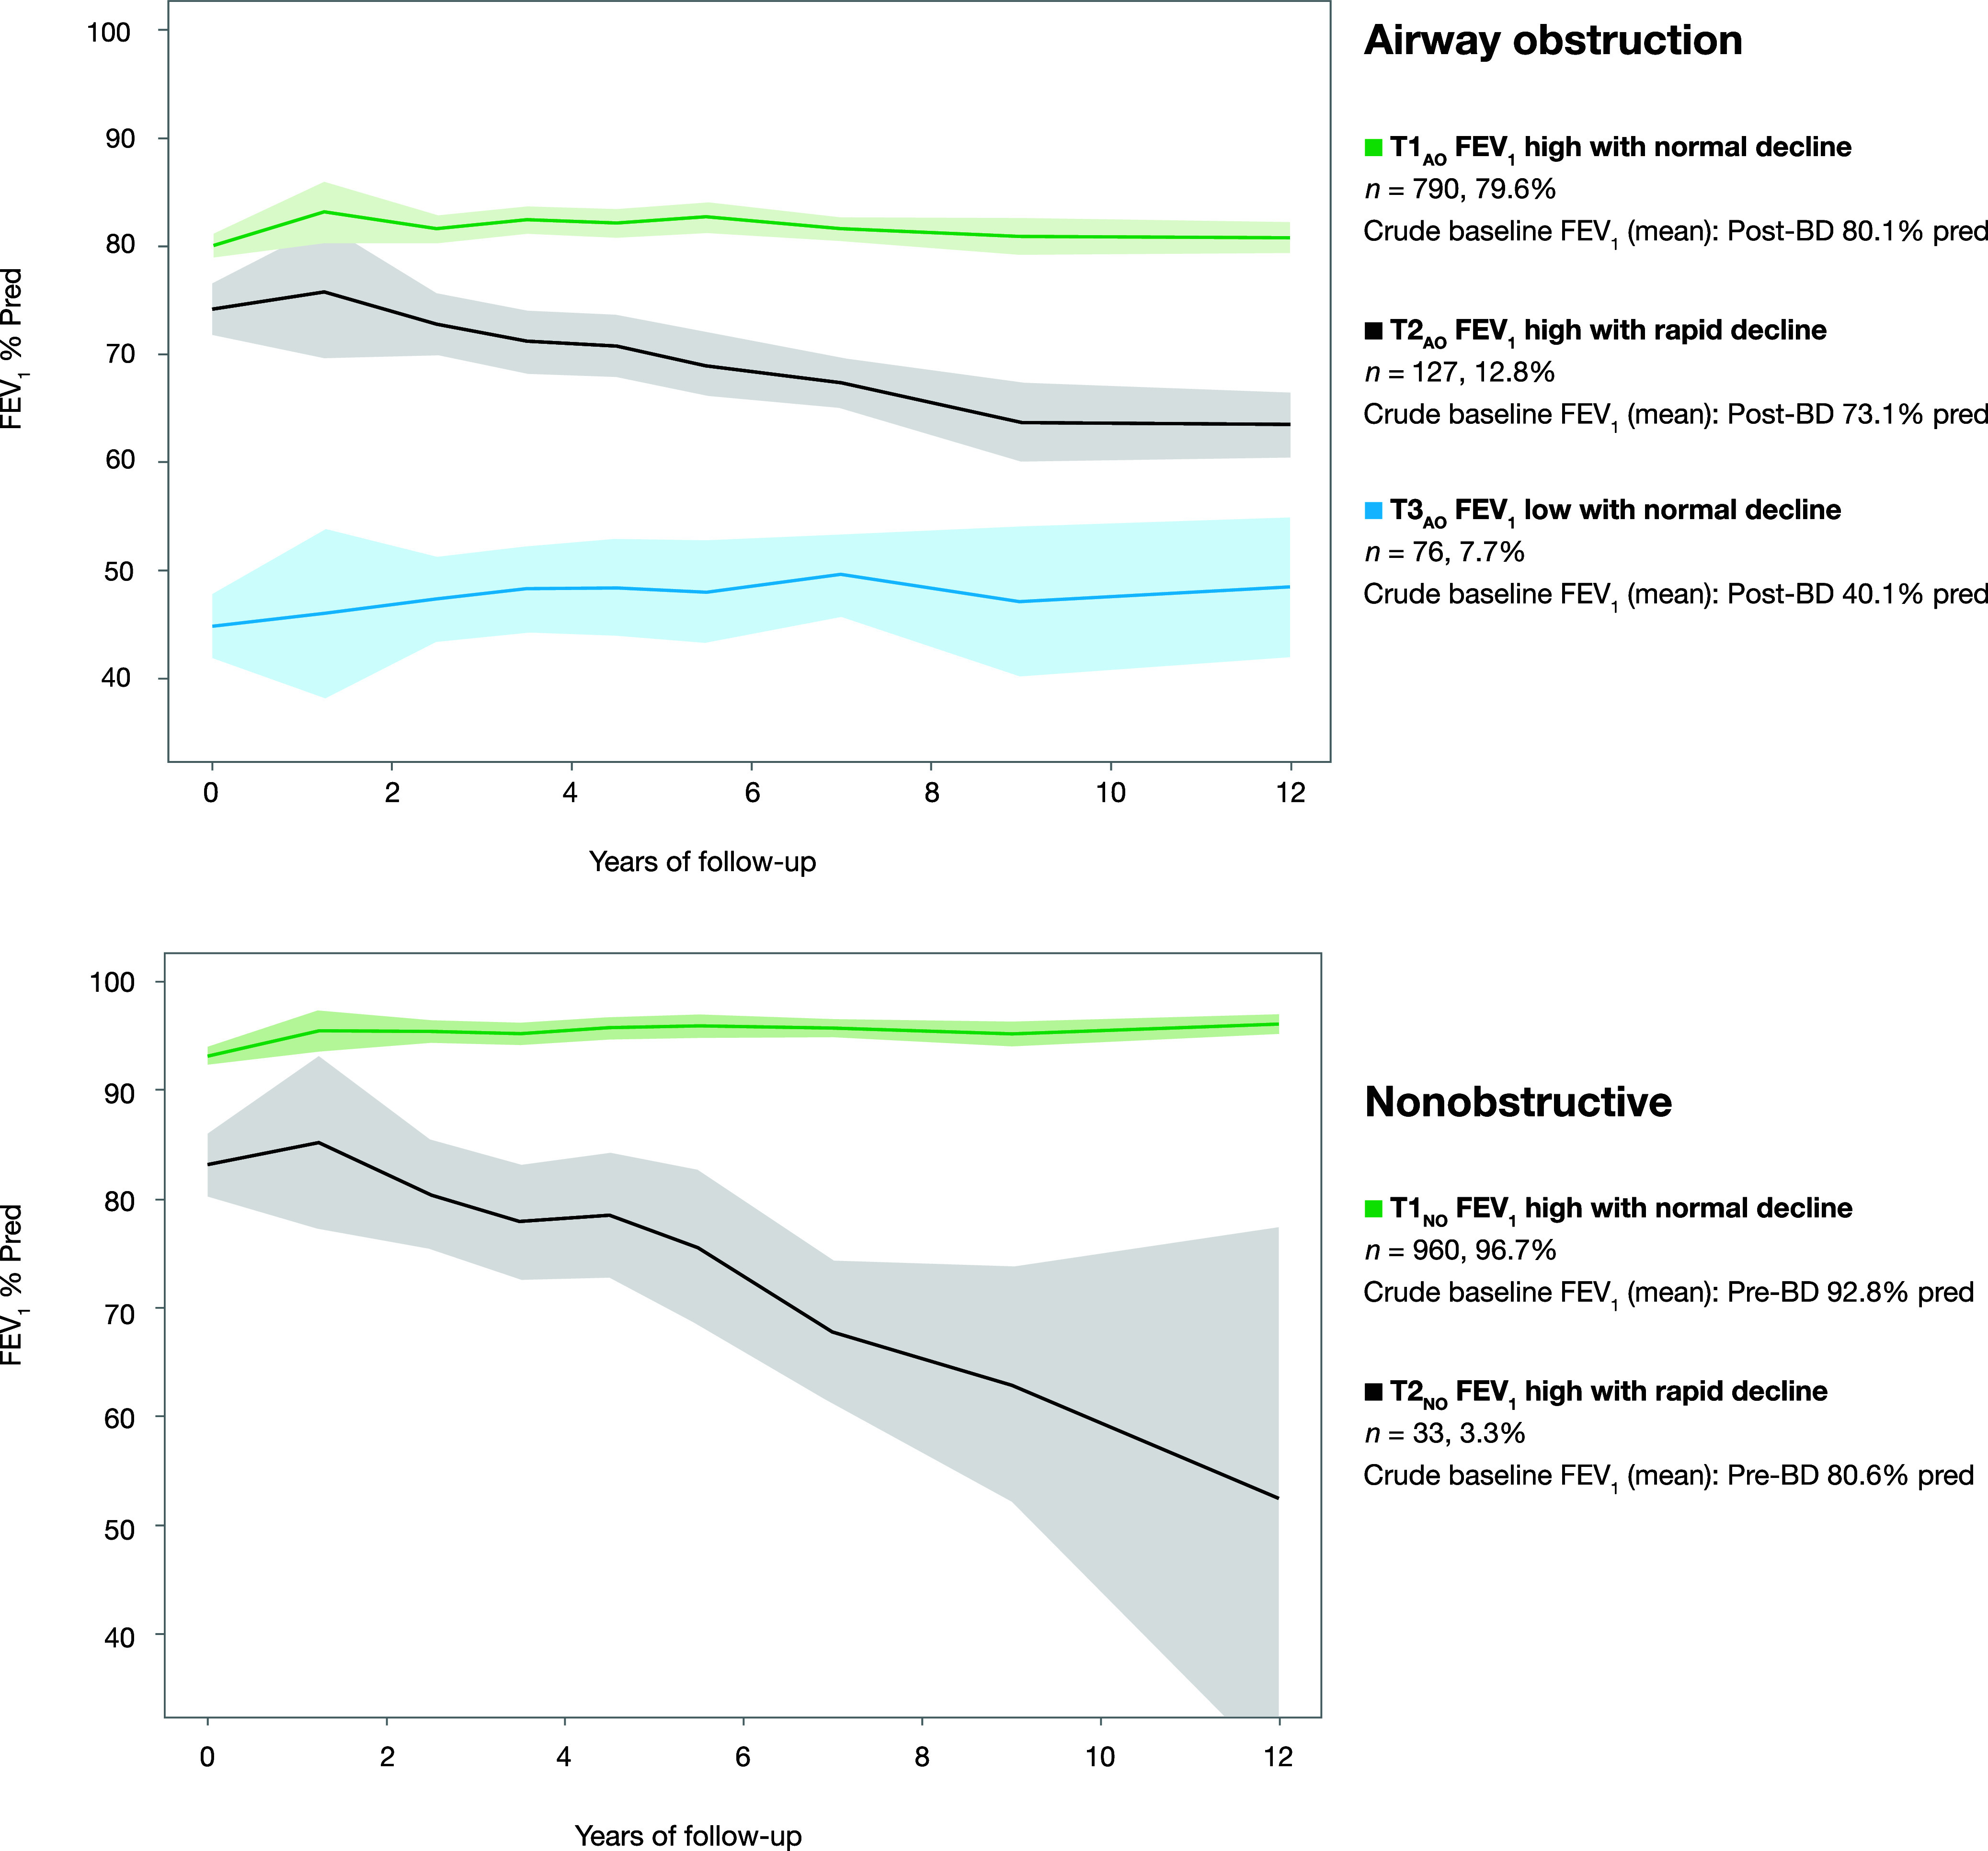
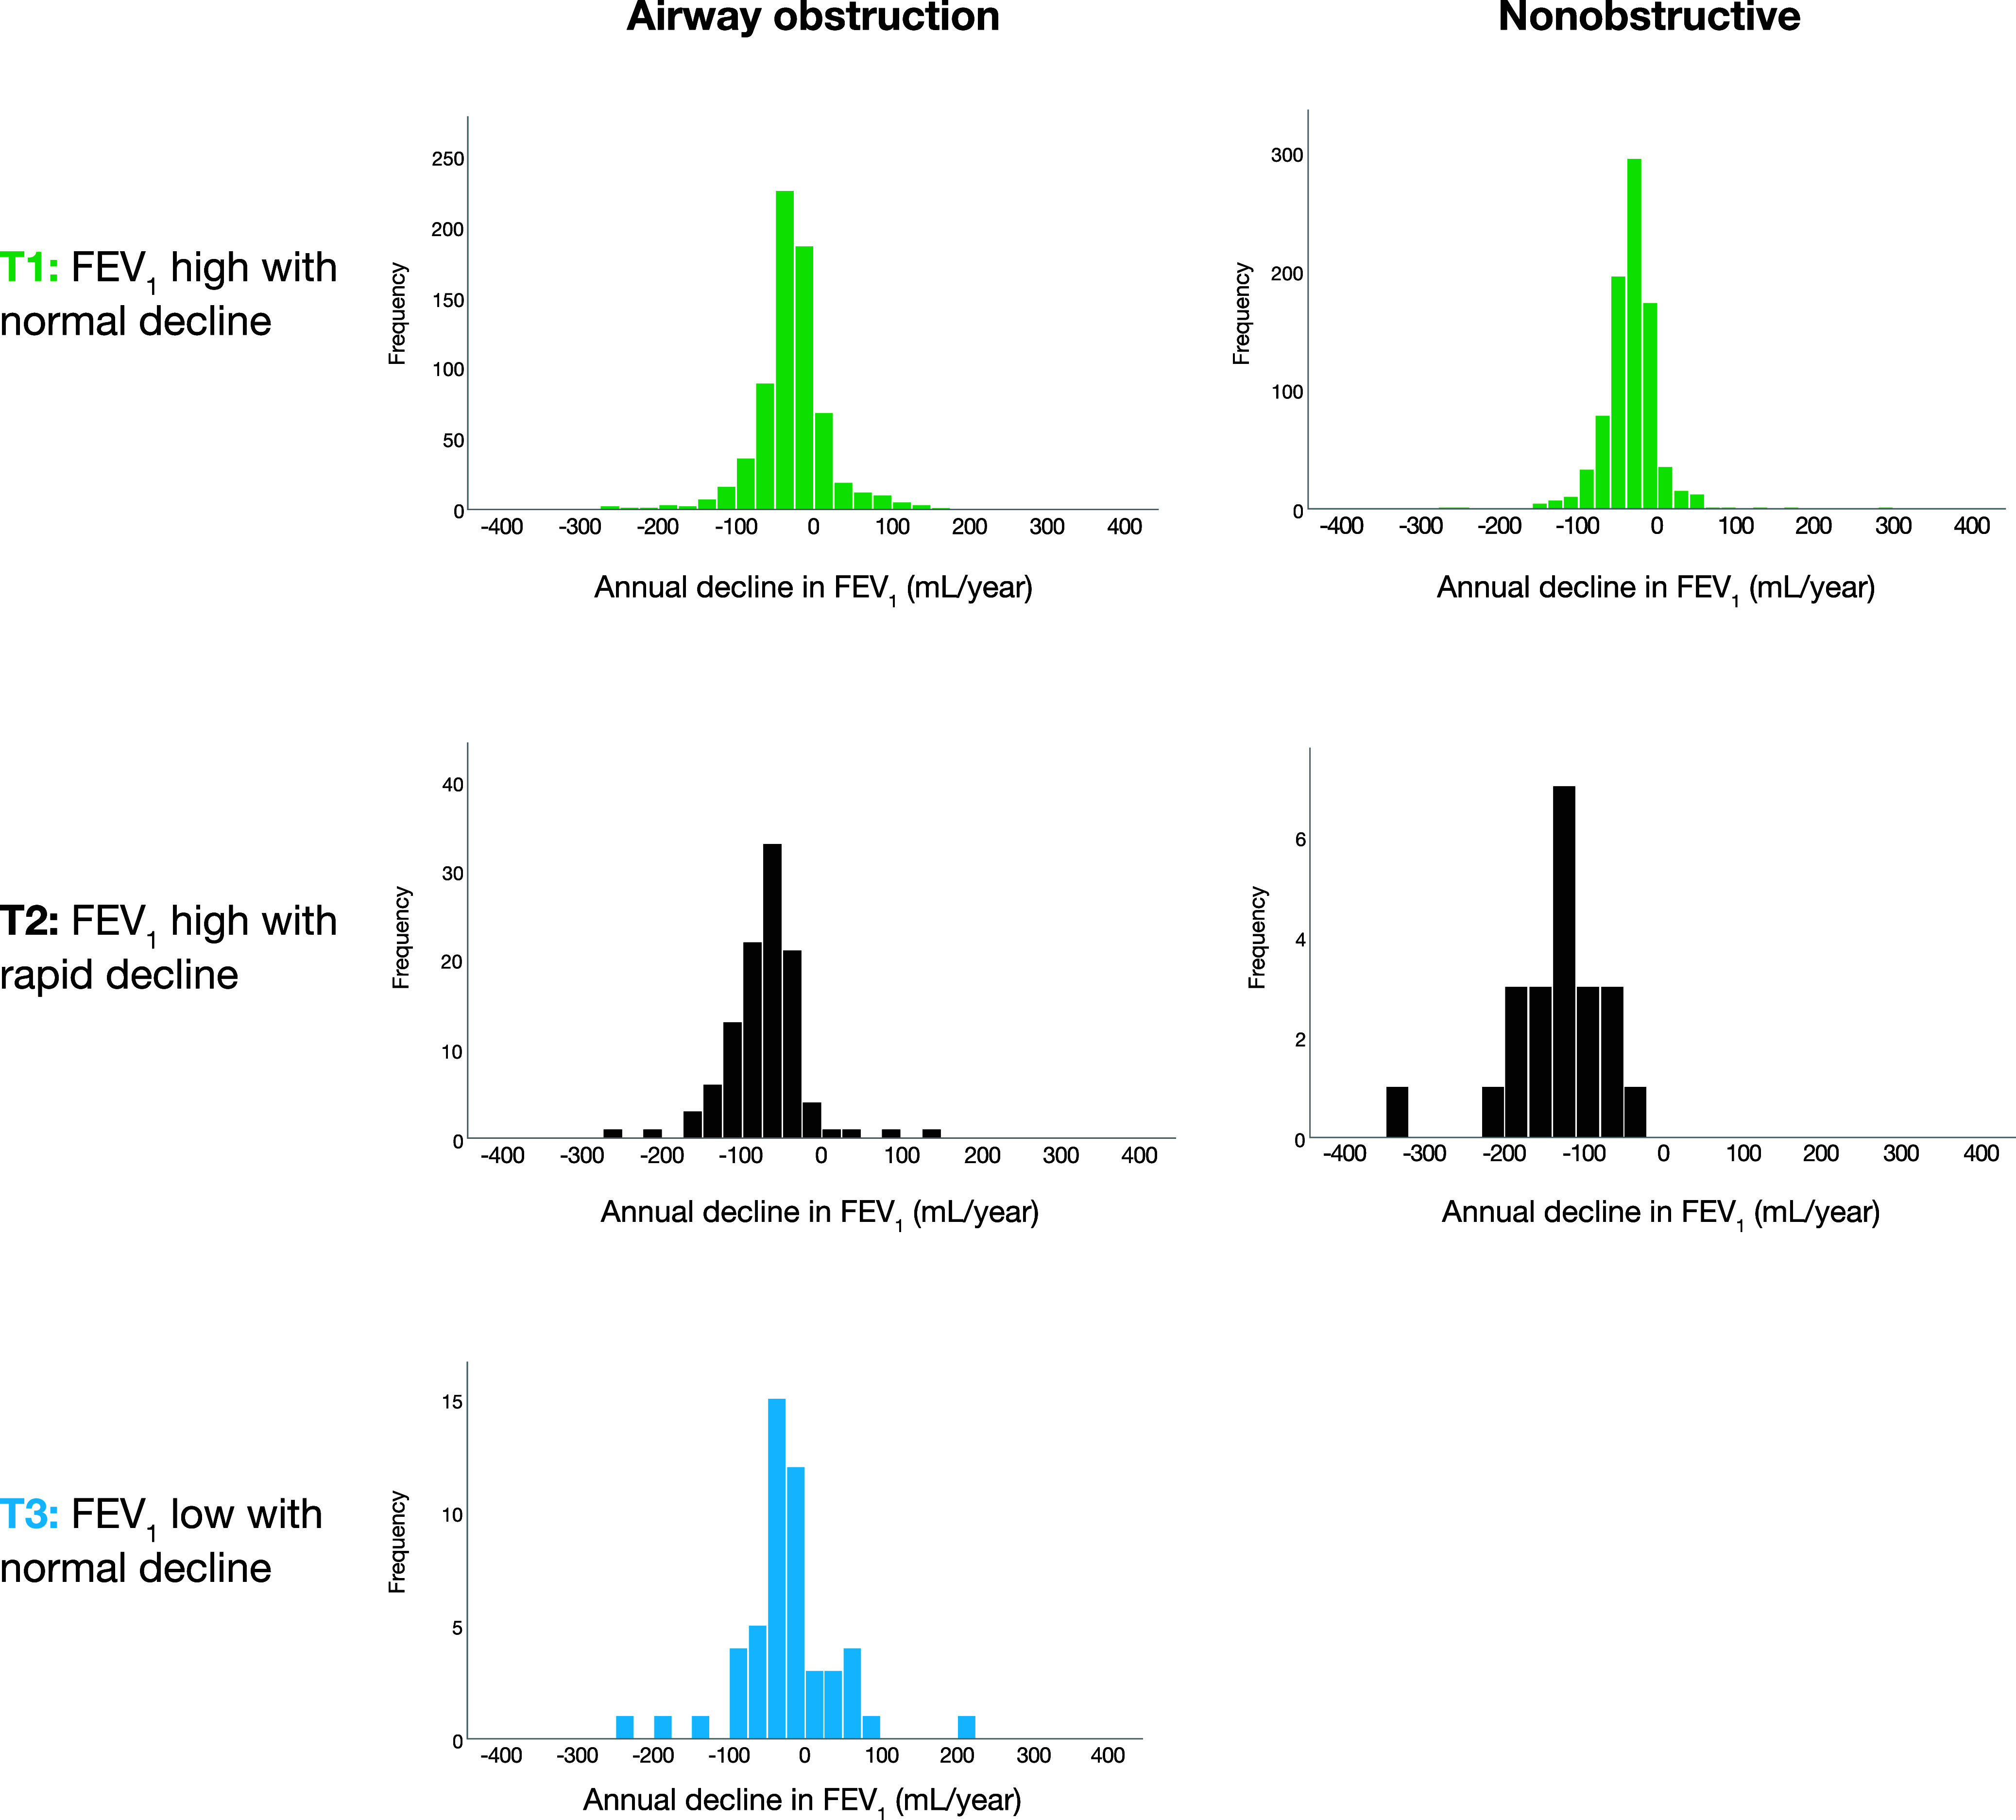
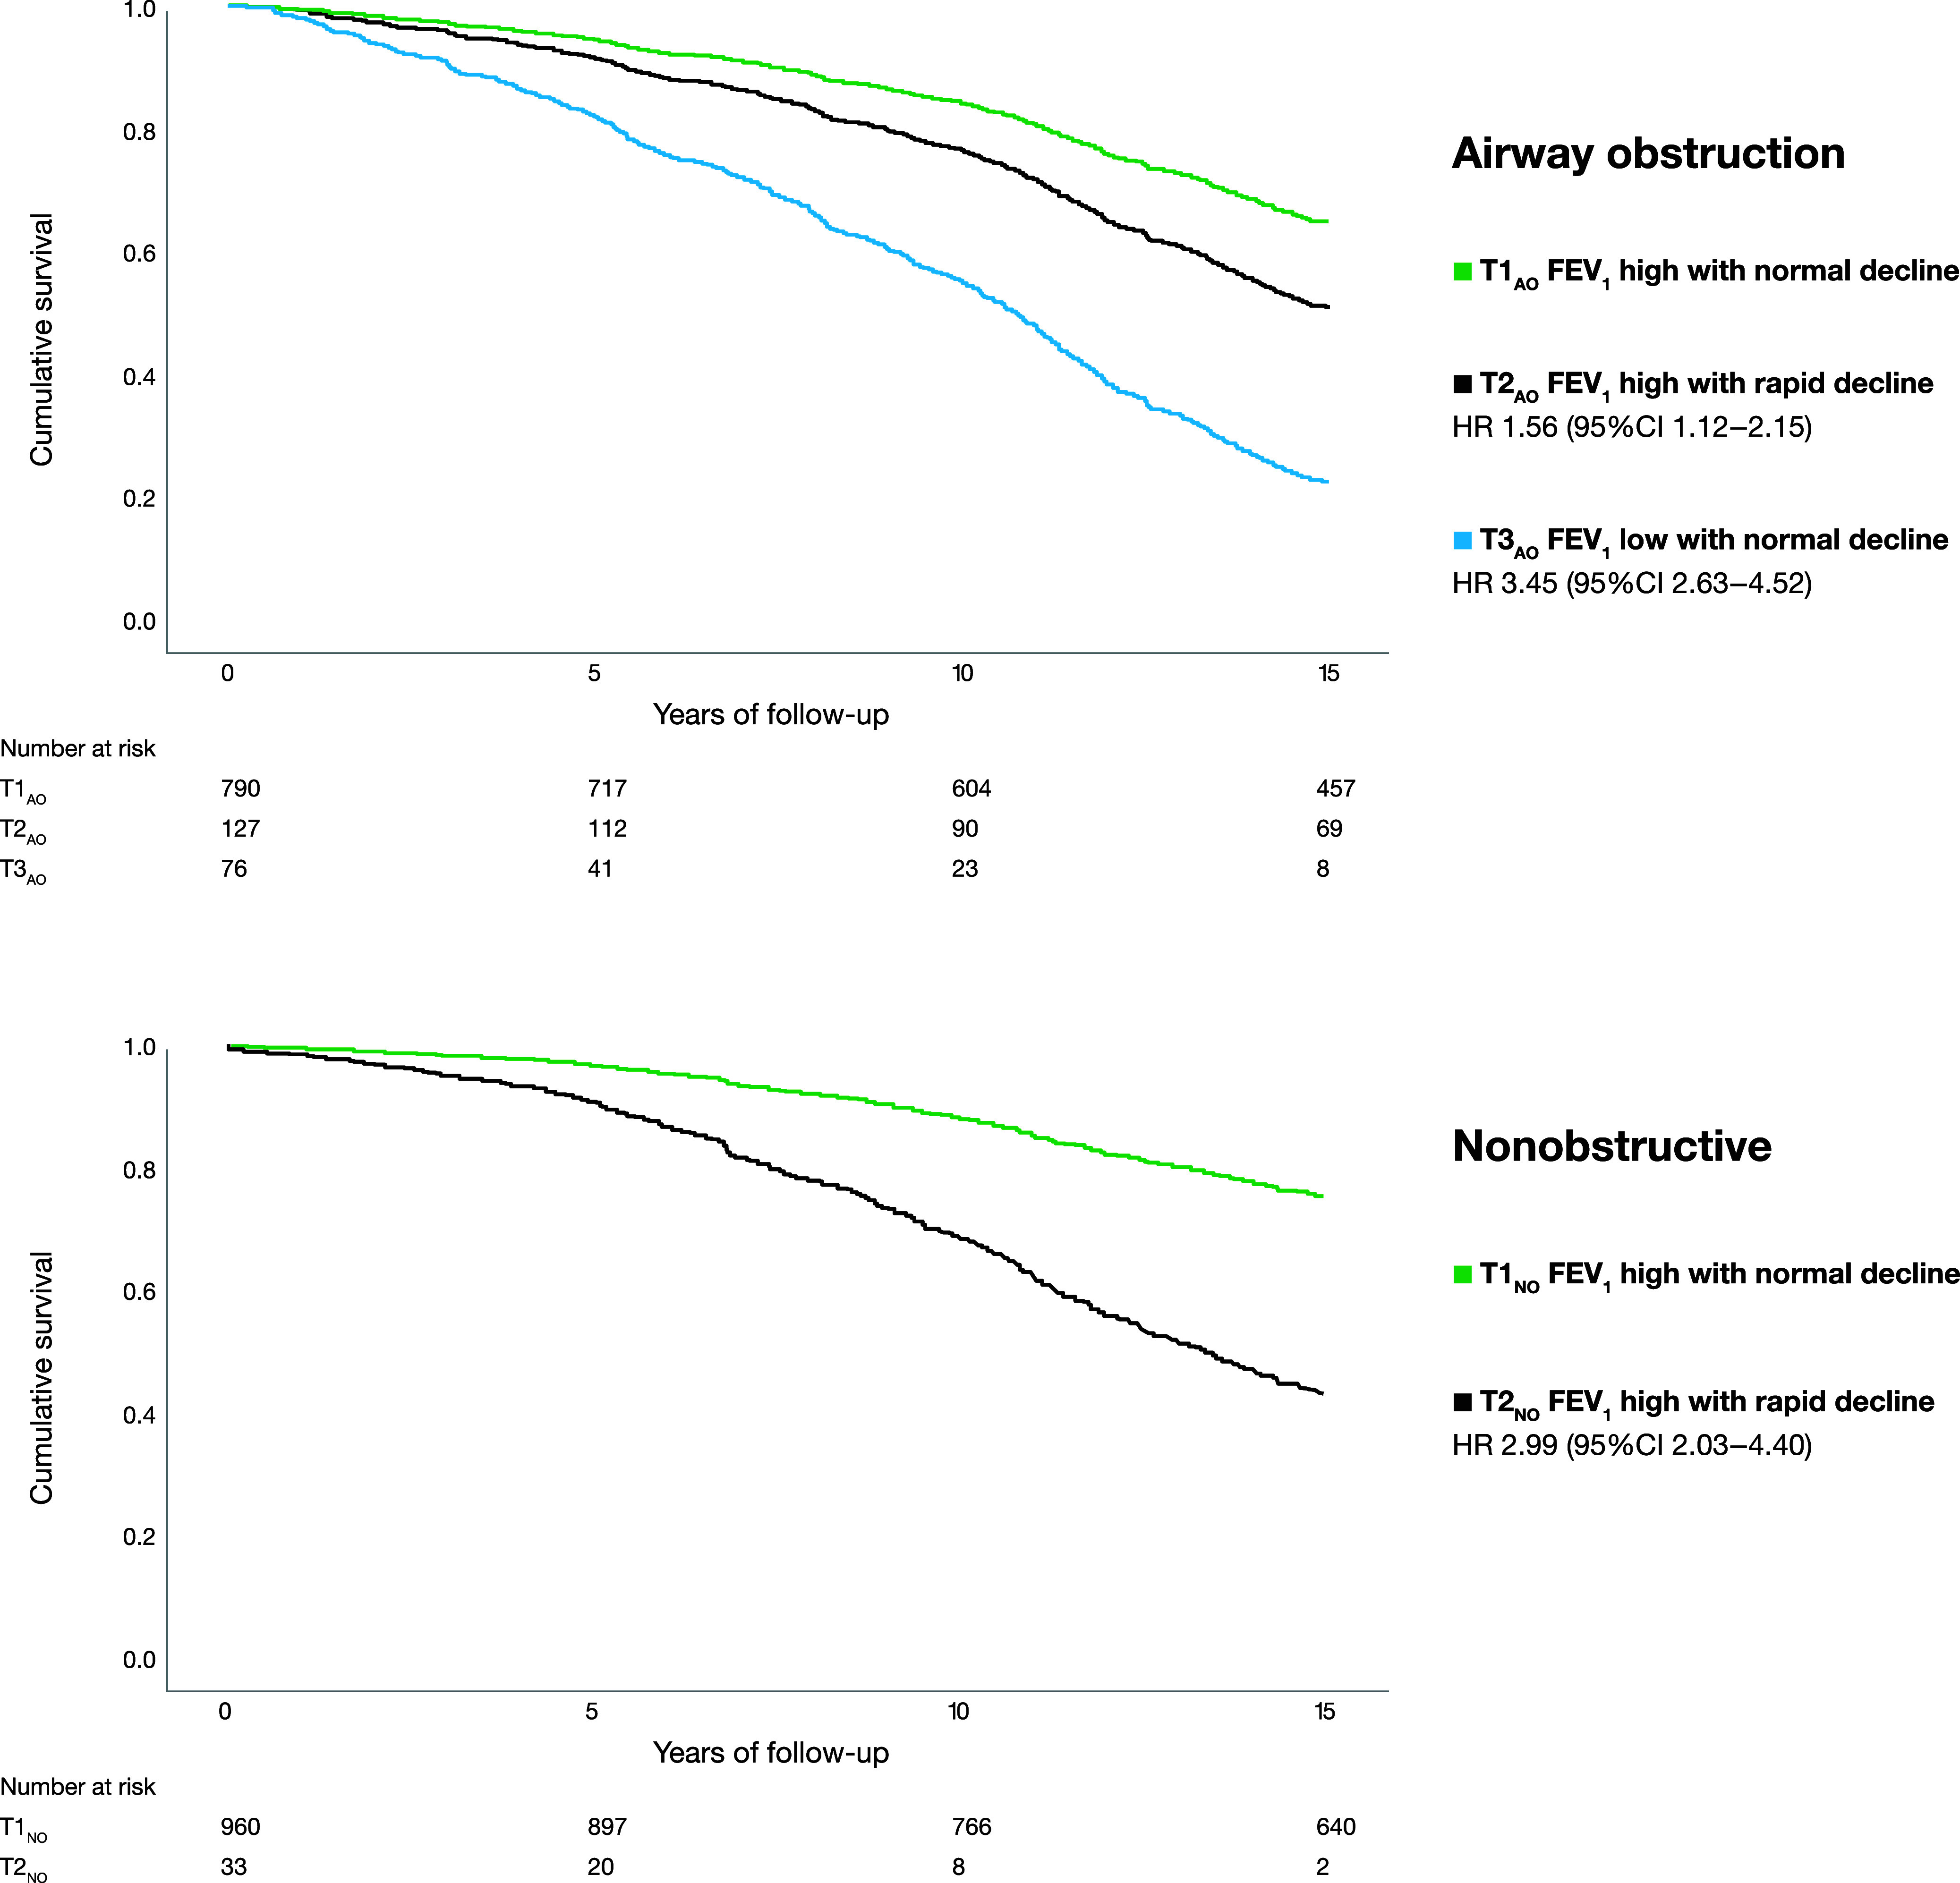
Rationale: Spirometry is essential for diagnosis and assessment of prognosis in patients with chronic obstructive pulmonary disease (COPD). Objectives: To identify FEV1 trajectories and their determinants on the basis of annual spirometry measurements among individuals with and without airway obstruction (AO) and to assess mortality in relation to trajectories. Methods: From 2002 through 2004, individuals with AO (FEV1/VC < 0.70, n = 993) and age- and sex-matched nonobstructive (NO) referents were recruited from population-based cohorts. Annual spirometry until 2014 was used in joint-survival latent-class mixed models to identify lung function trajectories. Mortality data were collected during 15 years of follow-up. Measurements and Main Results: Three trajectories were identified among the subjects with AO and two among the NO referents. Trajectory membership was driven by baseline FEV1% predicted (FEV1%pred) in both groups and also by pack-years in subjects with AO and current smoking in NO referents. Longitudinal FEV1%pred depended on baseline FEV1%pred, pack-years, and obesity. The trajectories were distributed as follows: among individuals with AO, 79.6% in AO trajectory 1 (FEV1 high with normal decline), 12.8% in AO trajectory 2 (FEV1 high with rapid decline), and 7.7% in AO trajectory 3 (FEV1 low with normal decline) (mean, 27, 72, and 26 ml/yr, respectively) and, among NO referents, 96.7% in NO trajectory 1 (FEV1 high with normal decline) and 3.3% in NO trajectory 2 (FEV1 high with rapid decline) (mean, 34 and 173 ml/yr, respectively). Hazard for death was increased for AO trajectories 2 (hazard ratio [HR], 1.56) and 3 (HR, 3.45) versus AO trajectory 1 and for NO trajectory 2 (HR, 2.99) versus NO trajectory 1. Conclusions: Three different FEV1 trajectories were identified among subjects with AO and two among NO referents, with different outcomes in terms of FEV1 decline and mortality. The FEV1 trajectories among subjects with AO and the relationship between low FVC and trajectory outcome are of particular clinical interest.
Keywords: FEV1; chronic obstructive pulmonary disease; natural history; prognosis.
Figures
Comment in
-
Going Down, Dooby Doo Down, Down: Identifying Rapid Spirometry Decline.Am J Respir Crit Care Med. 2023 Nov 15;208(10):1014-1015. doi: 10.1164/rccm.202307-1212ED. Am J Respir Crit Care Med. 2023. PMID: 37552692 Free PMC article. No abstract available.
-
Number of Follow-Up Years Needed to Identify a Rapid Decline in FEV1.Am J Respir Crit Care Med. 2024 Jan 1;209(1):119-120. doi: 10.1164/rccm.202309-1664LE. Am J Respir Crit Care Med. 2024. PMID: 37879065 Free PMC article. No abstract available.
-
Entwicklung der FEV1 als Prädiktor für die Mortalität.MMW Fortschr Med. 2024 May;166(8):29. doi: 10.1007/s15006-024-3887-2. MMW Fortschr Med. 2024. PMID: 38693379 Review. German. No abstract available.
References
-
- Adeloye D, Song P, Zhu Y, Campbell H, Sheikh A, Rudan I, NIHR RESPIRE Global Respiratory Health Unit Global, regional, and national prevalence of, and risk factors for, chronic obstructive pulmonary disease (COPD) in 2019: a systematic review and modelling analysis. Lancet Respir Med . 2022;10:447–458. - PMC - PubMed
-
- Wise RA. The value of forced expiratory volume in 1 second decline in the assessment of chronic obstructive pulmonary disease progression. Am J Med . 2006;119:4–11. - PubMed
-
- Vestbo J, Lange P. Natural history of COPD: focusing on change in FEV1. Respirology . 2016;21:34–43. - PubMed
Publication types
MeSH terms
Substances
Grants and funding
LinkOut - more resources
Full Text Sources
Medical
