

Comparison of retinal parameters between rhesus and cynomolgus macaques
- PMID: 37460311
- PMCID: PMC10877147
- DOI: 10.1538/expanim.22-0022
Comparison of retinal parameters between rhesus and cynomolgus macaques
Abstract
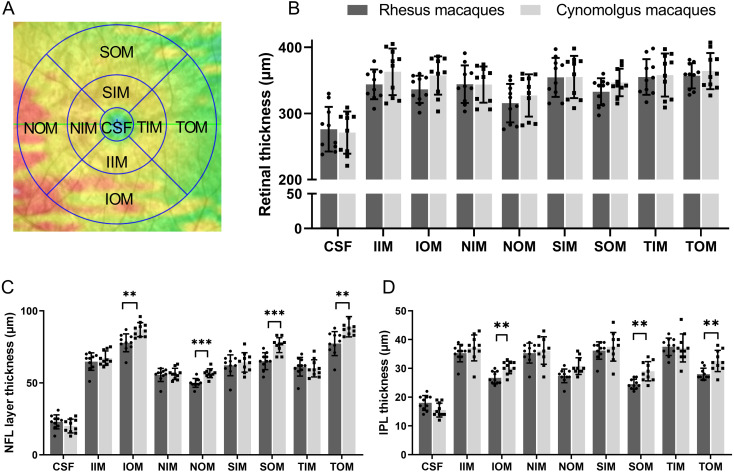
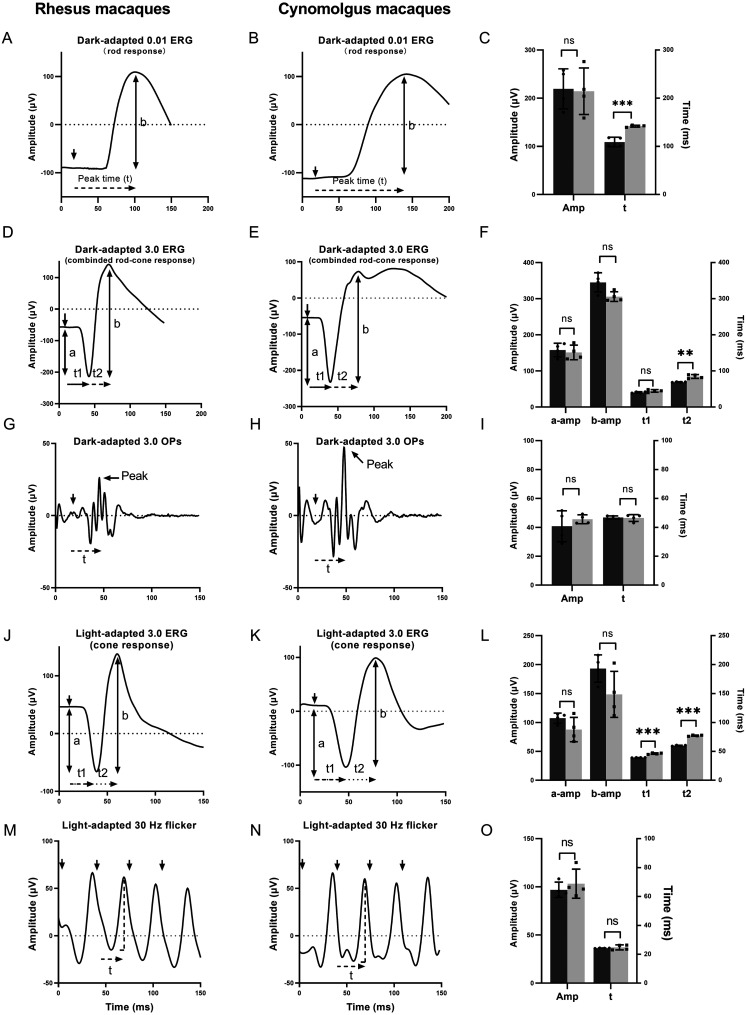
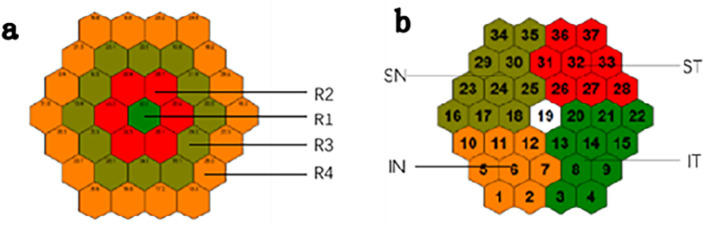
Nonhuman primates are important research models for basic vision research, preclinical pathogenesis, and treatment studies due to strong similarities in retinal structure and function with humans. We compared retinal parameters between 10 healthy normal rhesus macaques (Macaca mulatta) and 10 cynomolgus macaques (Macaca fascicularis) by optical coherence tomography and electroretinography. The Heidelberg Spectralis® HRA+OCT and Roland multifocal electrophysiometer were used to analyze retinal morphology, multifocal electroretinograms (mfERGs), and full-field electroretinograms (ff-ERGs). Mean retinal thickness was lowest in the central fovea of macaques and did not differ significantly between species, but the retinal thicknesses of the nerve fiber ganglion cell layer and the inner plexiform layer were significantly different. The amplitude density of the N1 wave was lower in rhesus macaques than in cynomolgus macaques in ring and quadrant areas. Dark-adapted 3.0 oscillatory potentials (reflection of amacrine cell activity) and light-adapted 30-hz flicker ERG (a sensitive cone-pathway-driven response) waveforms of the ff-ERG were similar in both species, while the times to peaks in dark-adapted 0.01 ERG (the rod-driven response of bipolar cells) and dark-adapted 3.0 ERG (combined rod and cone system responses) as well as the implicit times of the a- and b-waves in light-adapted 3.0 ERG (the single-flash cone response) were substantially different. This study provides normative retinal parameters for nonhuman primate research on basic and clinical ophthalmology, as well as a reference for researchers in the appropriate selection of rhesus or cynomolgus macaques as models for ophthalmology studies.
Keywords: cynomolgus macaques; electroretinogram; macula; retina; rhesus macaques.
Conflict of interest statement
All authors are affiliated with the State Key Laboratory of Ophthalmology, Zhongshan Ophthalmic Center, Sun Yat-Sen University, Guangzhou, Guangdong 510060, China. The authors have no potential competing interests to declare.
Figures
Similar articles
-
Interspecies and gender differences in multifocal electroretinograms of cynomolgus and rhesus macaques.Doc Ophthalmol. 2004 Jul;109(1):73-86. doi: 10.1007/s10633-004-2630-7. Doc Ophthalmol. 2004. PMID: 15675202
-
Rod-driven OFF pathway responses in the distal retina: dark-adapted flicker electroretinogram in mouse.PLoS One. 2012;7(8):e43856. doi: 10.1371/journal.pone.0043856. Epub 2012 Aug 24. PLoS One. 2012. PMID: 22937111 Free PMC article.
-
Relation between macular retinal ganglion cell/inner plexiform layer thickness and multifocal electroretinogram measures in experimental glaucoma.Invest Ophthalmol Vis Sci. 2014 Jun 26;55(7):4512-24. doi: 10.1167/iovs.14-13937. Invest Ophthalmol Vis Sci. 2014. PMID: 24970256 Free PMC article.
-
Human retinal dark adaptation tracked in vivo with the electroretinogram: insights into processes underlying recovery of cone- and rod-mediated vision.J Physiol. 2022 Nov;600(21):4603-4621. doi: 10.1113/JP283105. Epub 2022 Jun 7. J Physiol. 2022. PMID: 35612091 Free PMC article. Review.
-
[Animal models of human retinal and optic nerve diseases analysed using electroretinography].Nippon Ganka Gakkai Zasshi. 2010 Mar;114(3):248-78, discussion 279. Nippon Ganka Gakkai Zasshi. 2010. PMID: 20387538 Review. Japanese.
Cited by
-
Intravitreal Administration of Avacincaptad Pegol in a Nonhuman Primate Model of Dry Age-Related Macular Degeneration.Pharmacol Res Perspect. 2025 Feb;13(1):e70052. doi: 10.1002/prp2.70052. Pharmacol Res Perspect. 2025. PMID: 39722646 Free PMC article.
References
-
- Theodossiadis G, Chatziralli I, Theodossiadis P. Abnormal traction of the vitreous detected by swept-source optical coherence tomography is related to the maculopathy associated with optic disc pits. Graefes Arch Clin Exp Ophthalmol. 2016; 254: 1857–1858. doi: 10.1007/s00417-016-3379-x - DOI - PubMed
-
- Moschos MM, Nitoda E, Lavaris A, Chatziralli IP, Asproudis I, Androudi S, et al. The effect of fish consumption on macula structure and function of healthy individuals: an OCT and mfERG study. Eur Rev Med Pharmacol Sci. 2018; 22: 1203–1208. - PubMed
-
- Jonas JB, Hayreh SS. Ophthalmoscopic appearance of the normal optic nerve head in rhesus monkeys. Invest Ophthalmol Vis Sci. 2000; 41: 2978–2983. - PubMed
-
- Hood DC, Frishman LJ, Saszik S, Viswanathan S. Retinal origins of the primate multifocal ERG: implications for the human response. Invest Ophthalmol Vis Sci. 2002; 43: 1673–1685. - PubMed