. 2023 Jul 17;14(7):441.
doi: 10.1038/s41419-023-05963-1.

Bcl-2 family inhibitors sensitize human cancer models to therapy

Affiliations

Bcl-2 family inhibitors sensitize human cancer models to therapy

Elisabetta Valentini et al. Cell Death Dis. .

Abstract

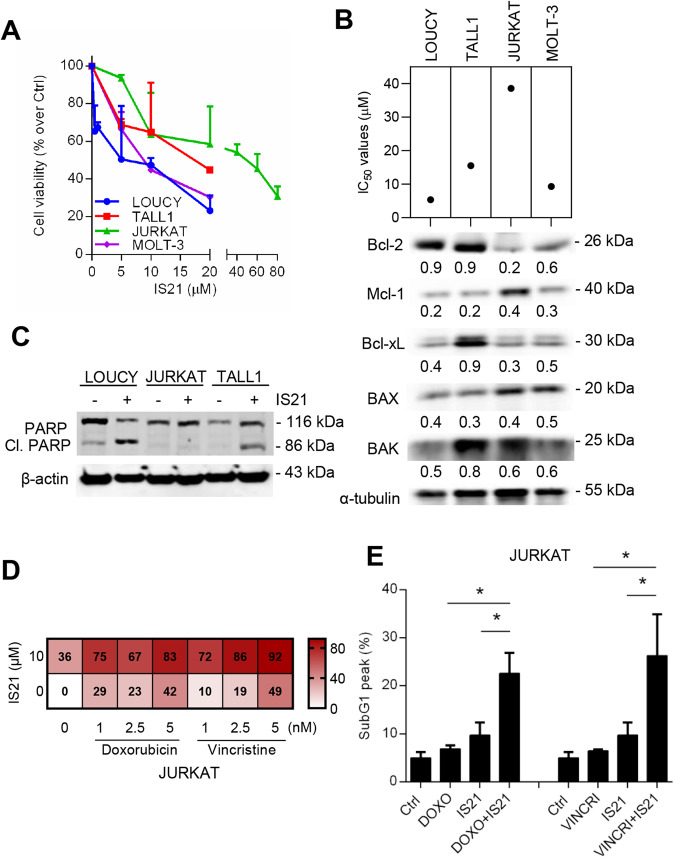
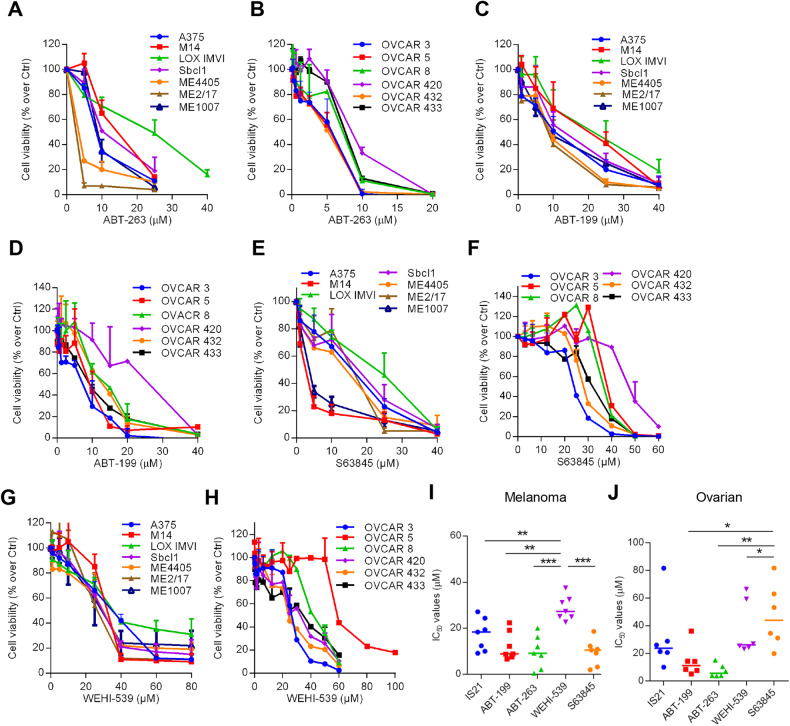
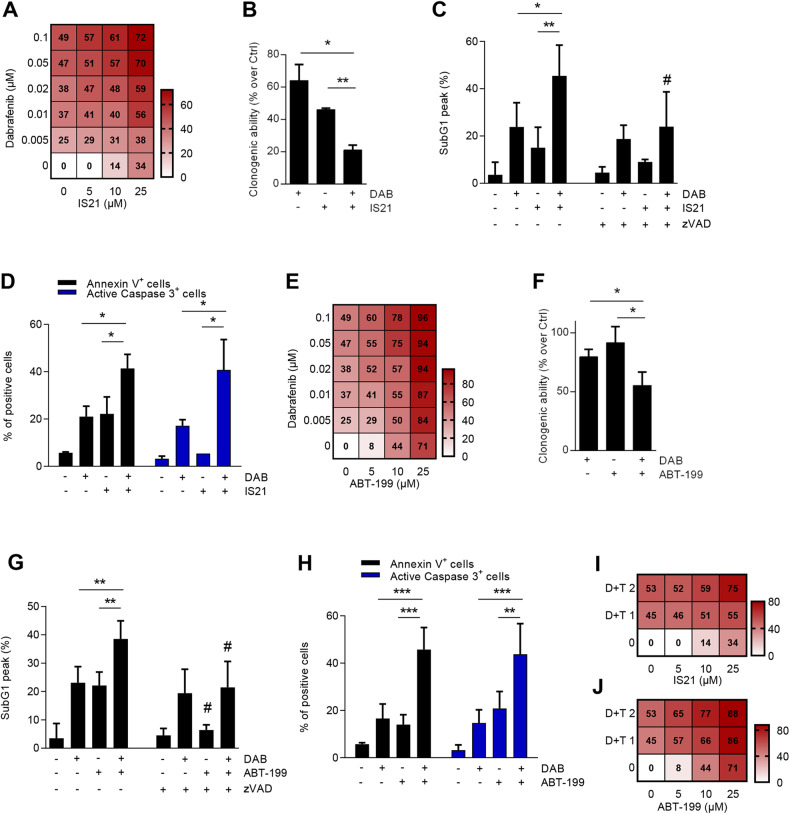
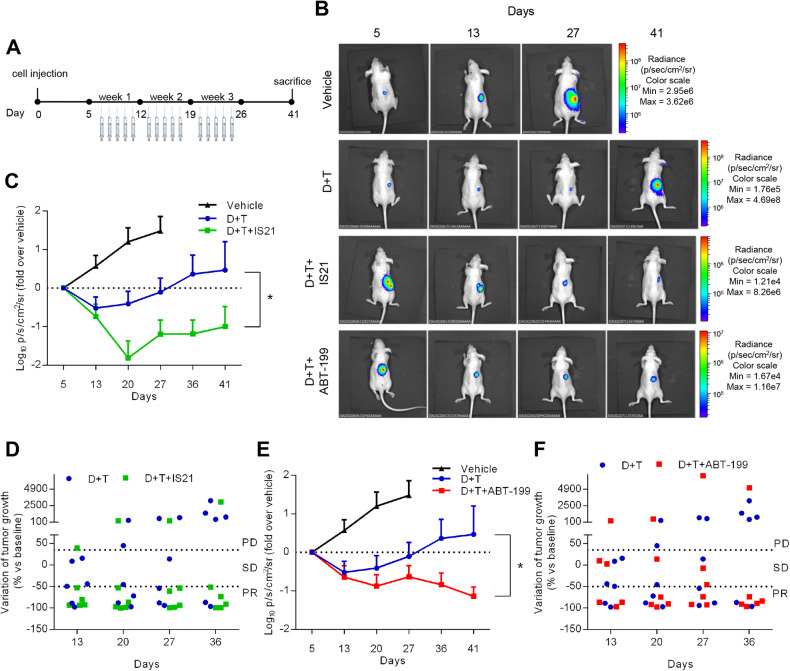
BH3 mimetics, targeting the Bcl-2 family anti-apoptotic proteins, represent a promising therapeutic opportunity in cancers. ABT-199, the first specific Bcl-2 inhibitor, was approved by FDA for the treatment of several hematological malignancies. We have recently discovered IS21, a novel pan BH3 mimetic with preclinical antitumor activity in several tumor types. Here, we evaluated the efficacy of IS21 and other BH3 mimetics, both as single agents and combined with the currently used antineoplastic agents in T-cell acute lymphoblastic leukemia, ovarian cancer, and melanoma. IS21 was found to be active in T-cell acute lymphoblastic leukemia, melanoma, lung, pancreatic, and ovarian cancer cell lines. Bcl-xL and Mcl-1 protein levels predicted IS21 sensitivity in melanoma and ovarian cancer, respectively. Exploring IS21 mechanism of action, we found that IS21 activity depends on the presence of BAX and BAK proteins: complexes between Bcl-2 and Bcl-xL proteins and their main binding partners were reduced after IS21 treatment. In combination experiments, BH3 mimetics sensitized leukemia cells to chemotherapy, ovarian cancer cells and melanoma models to PARP and MAPK inhibitors, respectively. We showed that this enhancing effect was related to the potentiation of the apoptotic pathway, both in hematologic and solid tumors. In conclusion, our data suggest the use of inhibitors of anti-apoptotic proteins as a therapeutic strategy to enhance the efficacy of anticancer treatment.


Conflict of interest statement

The authors declare no competing interests or personal relationships that could have appeared to influence the work reported in this paper.

Figures

Fig. 1
Fig. 1. IS21 reduces the viability and potentiates the efficacy of chemotherapy in T-ALL cell lines.
A Analysis of cell viability of the indicated T-ALL cell lines treated with increasing concentrations of IS21 for 48 h. B IC50 values of T-ALL cells treated as reported in A, and Western blot analysis of basal Bcl-2, Mcl-1, Bcl-xL, BAX, and BAK protein expression levels. The numbers indicate protein quantification by densitometric analysis. C Western blot analysis of PARP1 cleavage (Cl. PARP) in the indicated T-ALL cell lines treated with IS21 (20 μM, 48 h). D Heat map graph showing cell growth inhibitory effect of JURKAT cells treated with 10 μM IS21 alone or with the indicated concentrations of doxorubicin or vincristine for 48 h. E Cytofluorimetric quantification of JURKAT cells in the subG1 peak after treatment with doxorubicin (DOXO, 5 nM), vincristine (VINCRI, 2.5 nM) or IS21 (10 μM), alone or in combination for 48 h. p-values were calculated between single and combination treatments, *p < 0.05. B, C Reported Western blot images are representative of two independent experiments with similar results. β-actin and α-tubulin are shown as loading and transferring control, molecular weights are expressed in kilodalton (kDa). The results are reported as A “viability of treated cells/viability of control cells (Ctrl)” × 100, and D inhibition of cell proliferation of treated cells/inhibition of control cells × 100, and as the mean ± SD of three independent experiments.
Fig. 2
Fig. 2. IS21 reduces the viability of solid tumor cell lines and alters the interactions between Bcl-2 and Bcl-xL with their targets.
Analysis of cell viability of A melanoma and B ovarian cancer cell lines treated with increasing concentrations of IS21 for respectively 72 h and 5 days. Results are reported as “viability of treated cells/viability of control cells (Ctrl)” × 100, and as mean ± SD of three independent experiments. C Western blot analysis of BAX and BAK protein levels in A375 melanoma cell lines control (si-K), silenced for BAX (si-BAX), BAK (si-BAK), or both proteins (si-BAX + BAK). The same filter was used first for BAK and then for BAX. Analysis of D cell viability and E relative IC50 values of A375 melanoma cells silenced as reported in C and treated as reported in A. p-value was calculated between control and cells silenced for BAX, BAK or both, *p ≤ 0.05. FH Western blot analysis of Beclin-1, anti-apoptotic (Bcl-2, Bcl-xL, Mcl-1), and pro-apoptotic (BAX, BAK, BIM, NOXA) proteins after immunoprecipitation of A375 melanoma cells with F Bcl-2, G Bcl-xL, or H Mcl-1 antibodies after treatment with 20 μM IS21 for 48 h. Control cells (Ctrl). C, FH Reported western blot images are representative of two independent experiments with similar results. β-actin, α-tubulin, and Hsp72/73 are shown as loading and transferring control, molecular weights are expressed in kilodalton (kDa).
Fig. 3
Fig. 3. BH3 mimetics differentially affect cell viability of melanoma and ovarian cancer cell lines.
Cell growth inhibitory effect of (A, C, E, G) melanoma and (B, D, F, H) ovarian cancer cells treated with the indicated concentrations of A, B ABT-263, C, D ABT-199, E, F S63845, and G, H WEHI-539 for 72 h. IC50 values of I melanoma and J ovarian cancer cell lines treated as described in A, C, E, G and B, D, F, H, respectively. Results represent the mean ± SD of three independent experiments. I, J p-values were calculated between cells treated with each compound to all the others, *p < 0.05, **p < 0.01, and ***p < 0.001.
Fig. 4
Fig. 4. BH3 mimetics sensitize OVCAR 5 cells to olaparib.
Heat map graphs showing A cell growth inhibitory effect and B Loewe scores of cells treated with the indicated concentrations of IS21 and olaparib alone or in combination for 5 days. C Representative images (upper panel) and relative quantification (lower panel) of colony assay of cells treated for 10 days with olaparib (1.25 μM) and IS21 (10 μM) alone or in combination. Results represent the mean ± SD of three independent experiments. p-values were calculated between cells treated in combination and those treated with single agents, *p < 0.05, **p < 0.01. Heat map graphs showing D growth inhibitory effect and E Loewe scores of cells treated with the indicated concentrations of ABT-199 and olaparib alone or in combination for 5 days. A, D The results are reported as inhibition of treated cells/inhibition of control cells × 100, and as mean of three independent experiments. A, B, D, E The numbers inside the squares indicate values in every experimental point.
Fig. 5
Fig. 5. IS21 and ABT-199 potentiate the effect of trametinib in BRAF wild type Sbcl1 melanoma cells.
Heat map graphs showing A cell growth inhibitory effect and B Loewe scores of cells treated with the indicated concentrations of IS21 and trametinib alone or in combination for 48 h. C Quantification of colony assay of cells treated for 48 h with trametinib (TRAM, 0.01 μM) and IS21 (25 μM) alone or in combination and then plated for 10 days, before colony evaluation. D Cytofluorimetric quantification of cells in the subG1 peak after treatment with trametinib (0.01 μM) or IS21 (25 μM), alone or in combination for 48 h, in the presence or absence of zVAD (50 μM). Heat map graphs showing E cell growth inhibitory effect and F Loewe scores of cells treated with the indicated concentrations of ABT-199 and trametinib alone or in combination for 48 h. G Quantification of colony assay of cells treated for 48 h with trametinib (0.005 μM) or ABT-199 (10 μM) alone or in combination and then plated in 60 mm plate (200 cells) for 10 days. H Cytofluorimetric quantification of cells in the subG1 peak after treatment with trametinib (0.005 μM), or ABT-199 (10 μM) alone or in combination for 48 h, in the absence or presence of zVAD (50 μM). A, E The results are reported as inhibition of treated cells/inhibition of control cells × 100 and represented the mean of three independent experiments. A, B, E, F The numbers inside the squares indicate values in every experimental point. C, D, G, H Data are reported as mean ± SD of three independent experiments. p-values were calculated between single and combination treatments, *p < 0.05; **p < 0.01; ***p < 0.001; ****p < 0.0001, and between cells with or without zVAD, #p < 0.05 and ##p < 0.01.
Fig. 6
Fig. 6. IS21 and ABT-199 cooperate with dabrafenib to reduce the viability of A375 melanoma cells.
A Heat map graph showing the cell growth inhibitory effect of cells treated with the indicated concentrations of IS21 and dabrafenib alone or in combination for 48 h. B Quantification of colony assay of cells treated for 48 h with dabrafenib (DAB, 0.1 μM) and IS21 (25 μM) alone or in combination and then plated in 60 mm plate (200 cells) for 10 days, before colony evaluation. Cytofluorimetric quantification of C cells in the subG1 peak and D annexin V positive cells and activated caspase 3 in cells treated as reported in B, in the absence or presence of zVAD (50 μM). E Heat map graph showing cell growth inhibitory effect of cells treated with the indicated concentrations of dabrafenib or ABT-199 alone or in combination for 48 h. F Quantification of colony assay of cells treated for 48 h with dabrafenib (0.05 μM) or ABT-199 (10 μM) alone or in combination and then plated in 60 mm plate (200 cells) for 10 days. Cytofluorimetric quantification of G cells in the subG1 peak and H annexin V positive cells and activated caspase 3 in cells treated as reported in F, in the absence or presence of zVAD (50 μM). I, J Heat map graph showing the cell growth inhibitory effect of A375 cells treated with the indicated concentrations of I IS21, J ABT-199, dabrafenib+trametinib (D + T 1, dabrafenib 0.01 μM+trametinib 0.001 μM; D + T 2, dabrafenib 0.05 μM+trametinib 0.005 μM); alone or in combination for 48 h. A, E, I, J The results are reported as inhibition of treated cells/inhibition of control cells × 100 and represented the mean of three independent experiments. The numbers inside the squares indicate values in every experimental point. BD, FH Data are reported as mean ± SD of three independent experiments. p-values were calculated between single and combined treatments, *p < 0.05; **p < 0.01; ***p < 0.001, and between cells with or without zVAD, #p < 0.05.
Fig. 7
Fig. 7. IS21 and ABT-199 potentiate the effect of dabrafenib+trametinib in A375-derived xenografts.
A Schematic timeline of in vivo experiments. B Representative images of in vivo tumor growth analysis in nude mice injected with A375luc cells and treated with vehicle or with dabrafenib+trametinib (D + T) or D + T + IS21 or D + T + ABT-199 for three weeks. C, E Analysis of tumor growth after A375luc injection and treatment as reported in B. D, F Therapeutic response of single mice treated as reported in B assessed by using RECIST-like criteria; progression disease (PD ≥ 35% increase from baseline), partial response (PR ≥ −50% increase from baseline), stable disease (SD, intermediate changes). Experiments were repeated twice, *p < 0.05.

Similar articles

Cited by

References

    1. Vasan N, Baselga J, Hyman DM. A view on drug resistance in cancer. Nature. 2019;575:299–309. doi: 10.1038/s41586-019-1730-1. - DOI - PMC - PubMed
    1. Emran TB, Shahriar A, Mahmud AR, Rahman T, Abir MH, Siddiquee MF, et al. Multidrug resistance in cancer: understanding molecular mechanisms, immunoprevention and therapeutic approaches. Front Oncol. 2022;12:891652. doi: 10.3389/fonc.2022.891652. - DOI - PMC - PubMed
    1. Adams JM, Cory S. The BCL-2 arbiters of apoptosis and their growing role as cancer targets. Cell Death Differ. 2018;25:27–36. doi: 10.1038/cdd.2017.161. - DOI - PMC - PubMed
    1. Delbridge AR, Strasser A. The BCL-2 protein family, BH3-mimetics and cancer therapy. Cell Death Differ. 2015;22:1071–80. doi: 10.1038/cdd.2015.50. - DOI - PMC - PubMed
    1. Ashkenazi A, Fairbrother WJ, Leverson JD, Souers AJ. From basic apoptosis discoveries to advanced selective BCL-2 family inhibitors. Nat Rev Drug Discov. 2017;16:273–84. doi: 10.1038/nrd.2016.253. - DOI - PubMed

Publication types

MeSH terms

Substances