. 2023 Jul 17;13(1):261.
doi: 10.1038/s41398-023-02540-0.

Altered brain dynamic in major depressive disorder: state and trait features

Affiliations

Altered brain dynamic in major depressive disorder: state and trait features

Nooshin Javaheripour et al. Transl Psychiatry. .

Abstract

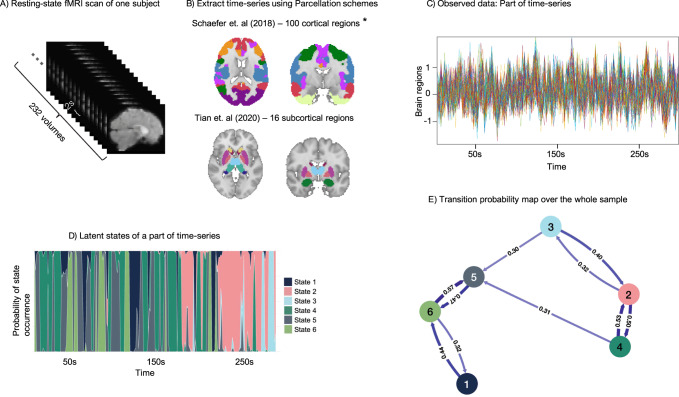
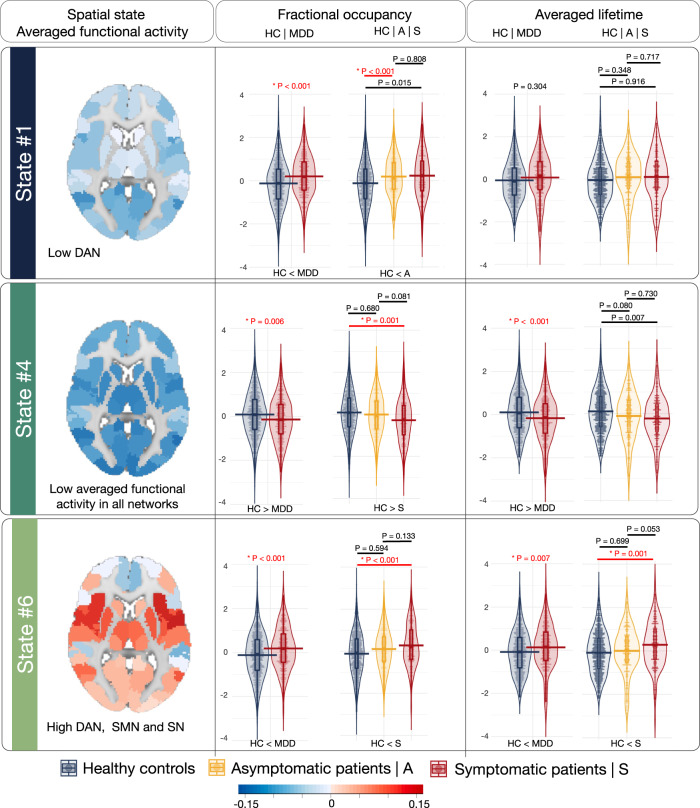
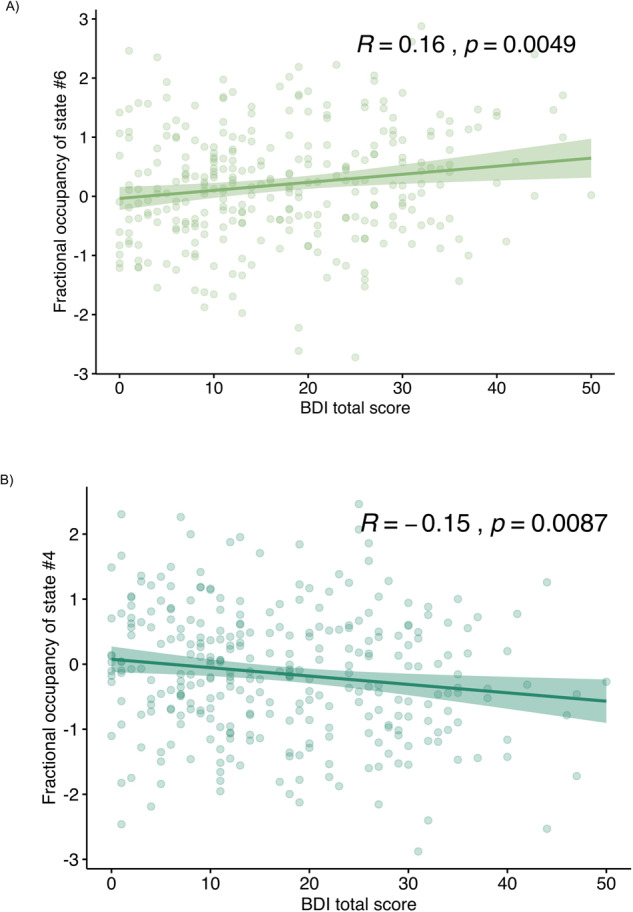
Temporal neural synchrony disruption can be linked to a variety of symptoms of major depressive disorder (MDD), including mood rigidity and the inability to break the cycle of negative emotion or attention biases. This might imply that altered dynamic neural synchrony may play a role in the persistence and exacerbation of MDD symptoms. Our study aimed to investigate the changes in whole-brain dynamic patterns of the brain functional connectivity and activity related to depression using the hidden Markov model (HMM) on resting-state functional magnetic resonance imaging (rs-fMRI) data. We compared the patterns of brain functional dynamics in a large sample of 314 patients with MDD (65.9% female; age (mean ± standard deviation): 35.9 ± 13.4) and 498 healthy controls (59.4% female; age: 34.0 ± 12.8). The HMM model was used to explain variations in rs-fMRI functional connectivity and averaged functional activity across the whole-brain by using a set of six unique recurring states. This study compared the proportion of time spent in each state and the average duration of visits to each state to assess stability between different groups. Compared to healthy controls, patients with MDD showed significantly higher proportional time spent and temporal stability in a state characterized by weak functional connectivity within and between all brain networks and relatively strong averaged functional activity of regions located in the somatosensory motor (SMN), salience (SN), and dorsal attention (DAN) networks. Both proportional time spent and temporal stability of this brain state was significantly associated with depression severity. Healthy controls, in contrast to the MDD group, showed proportional time spent and temporal stability in a state with relatively strong functional connectivity within and between all brain networks but weak averaged functional activity across the whole brain. These findings suggest that disrupted brain functional synchrony across time is present in MDD and associated with current depression severity.


Conflict of interest statement

MW is a member of the following advisory boards and gave presentations to the following companies: Bayer AG, Germany; Boehringer Ingelheim, Germany; and Biologische Heilmittel Heel GmbH, Germany. MW has further conducted studies with institutional research support from HEEL and Janssen Pharmaceutical Research for a clinical trial (IIT) on ketamine in patients with MDD, unrelated to this investigation. MW did not receive any financial compensation from the companies mentioned above. All other authors report no biomedical financial interests or other potential conflicts of interest.

Figures

Fig. 1
Fig. 1. Schematic overview of the study.
A Resting-state data from one participant representing 232 imaging volumes). B Schaefer et. al (2018) parcellation with 100 cortical regions and Tian et. al. (2020) parcellation with 16 subcortical regions. C Part of the time-series extracted from the parcellation schemes in Fig. 1B. D Hidden Markov Model (HMM) to calculate the probability of latent states being active at each timepoint of the observed time-series, concatenated from the whole study population. Depicted is the probability of occurrence of any state and each time-point of a part of time-series. The states do not occur sequentially and any of them might occur at any time-point. E Probability of transitioning from one state to any other state across groups.
Fig. 2
Fig. 2. Group comparisons of the temporal features.
Applying the hidden Markov model (HMM) resulted in six spatial states, with the brain map of averaged functional activity represented for each state (blue to red is indicating the negative to positive averaged functional activity, range −0.15 to 0.15). This figure contains the finding of fractional occupancy and averaged lifetime of state #1, #4 and #6 and the findings related to states #2, #3 and #5 can be found in Supplementary Fig. 4. The range of −0.15 and 0.15 for the averaged functional activity represents the level of functional activity observed during a particular state in the current dataset. In general, the magnitude and direction of the values can indicate the degree and type of neural activity occurring during a particular state. The positive values may indicate increased neural activity, while negative values may indicate decreased activity. Functional activity is averaged blood-oxygen-level-dependent (BOLD) time-series at that state for each region. The violin plots represent the group comparisons (HC vs. all MDD-diagnosed patients and HC vs. asymptomatic or symptomatic patients) of the temporal features (fractional occupancy and averaged lifetime). The value on the top of each comparison is an uncorrected p-value and the p-values that are significant also after the Bonferroni correction are indicated by red color and asterisks.
Fig. 3
Fig. 3. Correlation of fractional occupancy with BDI total score in MDD patients.
Each scatterplot shows each state’s fractional occupancy and the BDI total scores in MDD patients. As it is indicated by the R-value and p-values on the top of each plot, A FO of state #6 positively correlated and B FO of state #4 is negatively correlated with the BDI total score. The correlations of FO of other states (#1, #2, #3, and #5) are not significant.

References

    1. Grimm S, Boesiger P, Beck J, Schuepbach D, Bermpohl F, Walter M, et al. Altered negative BOLD responses in the default-mode network during emotion processing in depressed subjects. Neuropsychopharmacology. 2009;34:932–43. doi: 10.1038/npp.2008.81. - DOI - PubMed
    1. Wagner G, Schachtzabel C, Peikert G, Bär K-J. The neural basis of the abnormal self-referential processing and its impact on cognitive control in depressed patients. Hum Brain Mapp. 2015;36:2781–94. doi: 10.1002/hbm.22807. - DOI - PMC - PubMed
    1. Wagner G, de la Cruz F, Köhler S, Bär K-J. Treatment associated changes of functional connectivity of midbrain/brainstem nuclei in major depressive disorder. Sci Rep. 2017;7:1–12. doi: 10.1038/s41598-017-09077-5. - DOI - PMC - PubMed
    1. Bermpohl F, Walter M, Sajonz B, Lücke C, Hägele C, Sterzer P, et al. Attentional modulation of emotional stimulus processing in patients with major depression—Alterations in prefrontal cortical regions. Neurosci Lett. 2009;463:108–13. doi: 10.1016/j.neulet.2009.07.061. - DOI - PubMed
    1. Drysdale AT, Grosenick L, Downar J, Dunlop K, Mansouri F, Meng Y, et al. Resting-state connectivity biomarkers define neurophysiological subtypes of depression. Nat Med. 2017;23:28–38. doi: 10.1038/nm.4246. - DOI - PMC - PubMed

Publication types