. 2023 Jul 18;9(1):74.
doi: 10.1038/s41421-023-00570-y.

Lysine butyrylation of HSP90 regulated by KAT8 and HDAC11 confers chemoresistance

Affiliations

Lysine butyrylation of HSP90 regulated by KAT8 and HDAC11 confers chemoresistance

Yan He et al. Cell Discov. .

Abstract

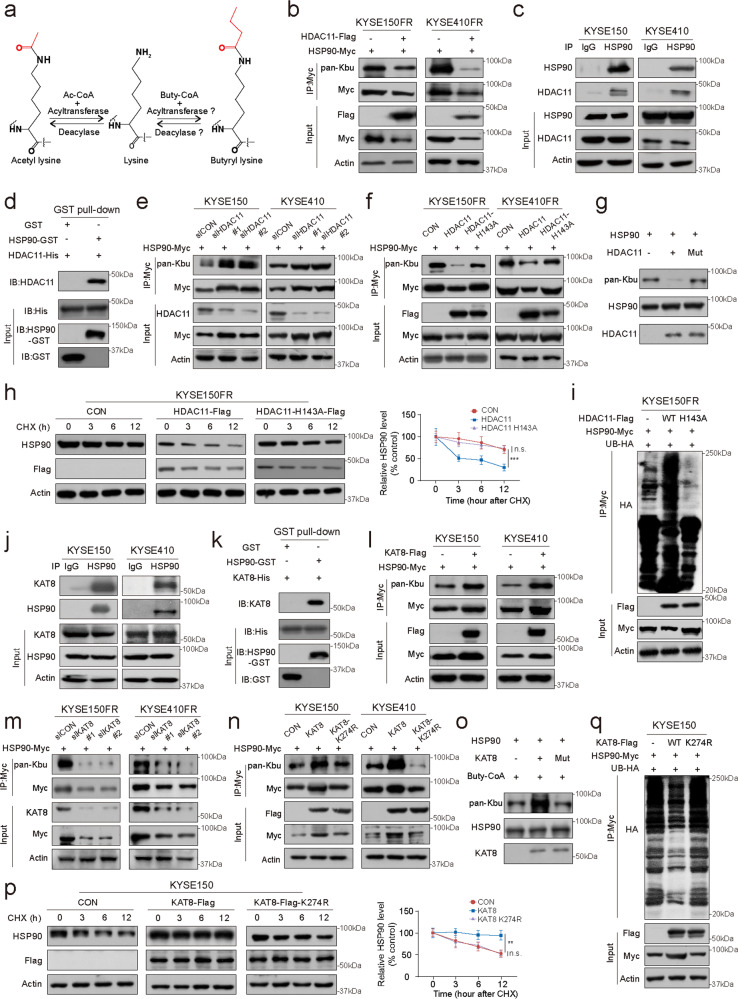
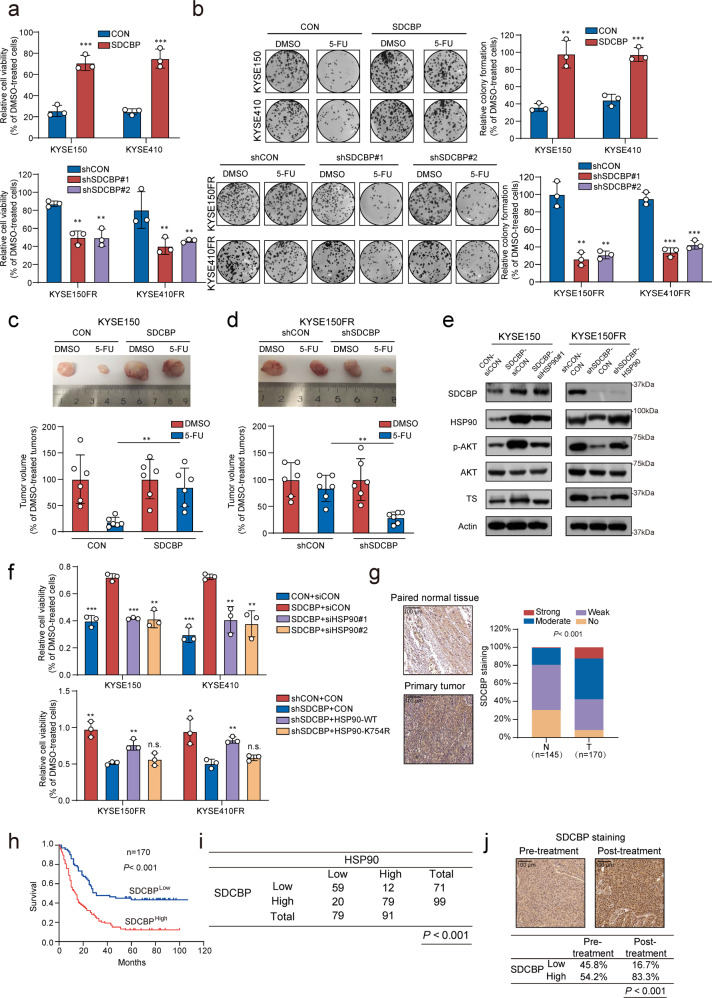
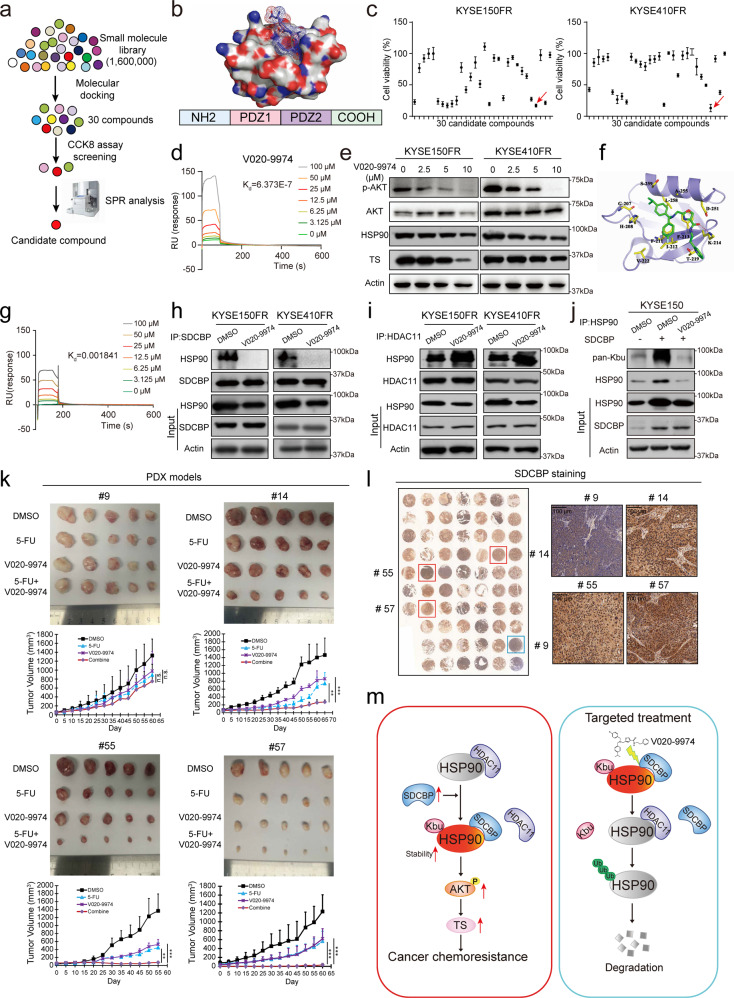
Posttranslational modification dramatically enhances protein complexity, but the function and precise mechanism of novel lysine acylation modifications remain unknown. Chemoresistance remains a daunting challenge to successful treatment. We found that lysine butyrylation (Kbu) is specifically upregulated in chemoresistant tumor cells and tissues. By integrating butyrylome profiling and gain/loss-of-function experiments, lysine 754 in HSP90 (HSP90 K754) was identified as a substrate for Kbu. Kbu modification leads to overexpression of HSP90 in esophageal squamous cell carcinoma (ESCC) and its further increase in relapse samples. Upregulation of HSP90 contributes to 5-FU resistance and can predict poor prognosis in cancer patients. Mechanistically, HSP90 K754 is regulated by the cooperation of KAT8 and HDAC11 as the writer and eraser, respectively; SDCBP increases the Kbu level and stability of HSP90 by binding competitively to HDAC11. Furthermore, SDCBP blockade with the lead compound V020-9974 can target HSP90 K754 to overcome 5-FU resistance, constituting a potential therapeutic strategy.


Conflict of interest statement

The authors declare no competing interests.

Figures

Fig. 1
Fig. 1. Lysine butyrylome profile in cancer chemoresistance and the important role of Kbu modification of HSP90.
a Scheme of the lysine butyrylome in 5-FU-resistant cell line KYSE150-FR and the parental cells KYSE150. b DEKPs and DEKSs identified by butyrylome analysis of resistant and parental cells. c Subcellular distribution of DEKPs in 5-FU-resistant and parental cells. d Heatmap indicating the enrichment (red) and depletion (green) of amino acids at each position flanking the Kbu sites. e The DEKSs were classified into four clusters by the Q classification method for further enrichment analysis. f GO enrichment analysis showing the enriched protein domains of DEKPs. g PPI network showing the relationships among the DEKPs. h Top 10 hub proteins in the PPI network. i Enrichment analysis of DEKPs identified by butyrylome analysis revealed the important role of the HSP90AA1-PI3K/AKT pathway in chemoresistance in cancer. j HSP90 expression levels in paired ESCC biopsy and post-5-FU-treatment relapse surgical specimens. k Kbu modification of HSP90 was increased in 5-FU-resistant cells.
Fig. 2
Fig. 2. Butyrylation of HSP90 at K754 is essential for cancer chemoresistance.
a The MS/MS spectrum of the modified HSP90 peptide. b KYSE150 and KYSE410 were transiently transfected with the pcDNA3.1-Flag plasmid expressing wild-type HSP-90 (HSP90-WT) or the HSP90-K754R mutant and were then subjected to immunoprecipitation/immunoblotting (IB) with the indicated antibodies. c The sequences surrounding K754 in HSP90 among seven species were aligned. Lysine 754 of HSP90 was colored in red. d KYSE150 and KYSE410 were transiently transfected with the pcDNA3.1-Flag plasmid expressing HSP90-WT or the HSP90-K754R mutant. Colony formation assay showing that the HSP90 K754R mutation abolished the promoting effect of HSP90-WT on 5-FU resistance in ESCC cells. e Representative images and quantitative analyses of tumor xenografts established with ESCC cells as indicated in the presence or absence of 5-FU. HSP90-WT or the HSP90-K754R mutant was re-overexpressed in HSP90-deficient ESCC cells. f, g The effect of HSP90 K754R mutation on its interaction with client proteins and cochaperones. h A CHX (100 μg/mL) chase assay was used to compare the stability of the wild-type HSP90 (HSP90-WT) and HSP90-K754R mutant proteins in ESCC cells. i Representative images and expression pattern of HSP90 in 170 ESCC and 145 paired adjacent normal tissues. j Kaplan–Meier analysis of overall survival for 170 ESCC patients stratified by the tumor HSP90 level. Bars, SDs; *P < 0.05; **P < 0.01; ***P < 0.001.
Fig. 3
Fig. 3. HDAC11 and KAT8 are the eraser and writer enzymes for Kbu modification of HSP90.
a Diagram of enzymatic reaction for acetyl-lysine and the hypothesized mechanism for butyryllysine. b HDAC11 decreased Kbu modification of HSP90. c The interaction between endogenous HDAC11 and HSP90 was investigated by immunoprecipitation. d Purified GST (lane 1) or HSP90-GST recombinant protein (lane 2) was immobilized on Glutathione-Sepharose beads and incubated with HDAC11-His recombinant protein, followed by immunoblotting. e Knockdown of HDAC11 increased Kbu modification of HSP90. f Effect of the HDAC11-H143A mutant on the HSP90 Kbu level. g In vitro deacylase assay was used to determine the Kbu levels of HSP90 in the presence of wild-type HDAC11 or the catalytically inactive mutant of HDAC11 (HDAC11-H143A). h Quantification of protein stability after CHX treatment in ESCC cells transfected with wild-type HDAC11 or the HDAC11-H143A mutant. i Effect of HDAC11 and HDAC11-H143A on the ubiquitination of HSP90. j An immunoprecipitation assay was performed to confirm the endogenous interaction between HSP90 and KAT8. k Purified GST (lane 1) or HSP90-GST recombinant protein (lane 2) was immobilized on Glutathione-Sepharose beads and incubated with KAT8-His recombinant protein, followed by immunoblotting. l KAT8 increased Kbu modification of HSP90. Effect of KAT8 knockdown (m) and KAT8-K274R mutant (n) on HSP90 Kbu level. o In vitro butyrylation of HSP90. HSP90 was incubated with the purified KAT8 or KAT8-K274R in the presence of buty-CoA as indicated. p Quantification of protein stability after CHX treatment in ESCC cells transfected with wild-type KAT8 or HAT-dead KAT8-K274R mutant. q Effect of KAT8 and KAT8-K274R on the ubiquitination of HSP90. Bars, SDs; *P < 0.05; **P < 0.01; ***P < 0.001.
Fig. 4
Fig. 4. SDCBP is a key regulator of HSP90 Kbu modification.
a Diagram showing the strategy used to screen for the candidate proteins that are not only upregulated in 5-FU-resistant cells but also interact with HSP90. IP-MS was performed in KYSE150 cells with HSP90 overexpression. Systematic proteomic analysis was conducted in the 5-FU-resistant cell line KYSE150-FR and the parental cells KYSE150. b The interaction between endogenous SDCBP and HSP90 was determined by immunoprecipitation. c HSP90 Kbu levels were determined in SDCBP-overexpressing ESCC cells. d SDCBP knockdown decreased the HSP90 Kbu level. Detection of HSP90 expression in SDCBP-overexpressing (e) and SDCBP-knockdown ESCC cells (f). g Analysis of HSP90 stability in SDCBP-overexpressing and SDCBP-knockdown ESCC cells by a CHX chase assay. h Upper panel, schematic diagram of different SDCBP truncation mutant constructs; lower panel, ESCC cells cotransfected with Flag-tagged SDCBP mutants as indicated and Myc-tagged HSP90 were collected for immunoprecipitation. i Upper panel, in silico docking simulation showing the interaction between SDCBP and HSP90; middle panel, schematic of the HSP90 mutant constructs; lower panel, cells cotransfected with Flag-tagged SDCBP and Myc-tagged HSP90 mutants were subjected to immunoprecipitation. j Co-IP results showing the binding of HDAC11 to wild-type or mutant HSP90. k The interactions among HSP90, SDCBP and HDAC11 were determined by co-IP. l Comparison of the HSP90 Kbu levels in ESCC cells overexpressing SDCBP-WT, SDCBP-PDZ2, SDCBP-△PDZ2 or vector control. m HSP90 Kbu levels were determined in ESCC cells transfected with indicated plasmids. Bars, SDs; *P < 0.05; **P < 0.01; ***P < 0.001.
Fig. 5
Fig. 5. HSP90 mediates the role of SDCBP in promoting cancer chemoresistance.
a, b Cell viability assay and colony formation assay showing the effect of SDCBP on the 5-FU sensitivity of ESCC cells. c, d Subcutaneous xenografts were established with SDCBP-overexpressing and SDCBP-knockdown cells, and the mice were treated with 5-FU or vehicle (n = 6). Representative images of tumors are shown, and tumor growth were quantified. Bars, SDs; *P < 0.05; **P < 0.01; ***P < 0.001. e Western blot analysis of SDCBP, HSP90, p-AKT, AKT and TS in the indicated ESCC cell lines. f Cell viability assay comparing 5-FU sensitivity in ESCC cells with manipulated SDCBP and/or HSP90 expression. g Expression pattern of SDCBP in a tumor tissue microarray consisting of 170 ESCC tissues and 145 normal tissues. h Kaplan–Meier analysis of overall survival for 170 ESCC patients stratified according to tumor SDCBP expression. i Correlation analysis between the expression of HSP90 and SDCBP. j Expression pattern of SDCBP in paired pre- and post-treatment samples from ESCC patients who received 5-FU-based neoadjuvant chemotherapy and subsequent surgery. Bars, SDs; *P < 0.05; **P < 0.01; ***P < 0.001.
Fig. 6
Fig. 6. Identification of a lead compound targeting HSP90 Kbu to suppress chemoresistance.
a Flow chart showing the strategy used to screen SDCBP inhibitors. b 3D structure of the SDCBP protein. c Comparison of the survival inhibitory activity of 30 candidate compounds. d Biacore analysis showing the binding between V020-9974 and the SDCBP protein. e Western blot analysis of p-AKT, AKT, HSP90 and TS in ESCC cells treated with different concentrations of V020-9974. f Predicted model of V020-9974 binding to the PDZ2 domain of SDCBP. g The mutant SDCBP protein was purified and subjected to Biacore analysis to evaluate its binding to V020-9974. h, i IP assay showing that V020-9974 disrupted the SDCBP-HSP90 interaction but enhanced the HDAC11-HSP90 interaction. j V020-9974 decreased Kbu modification of HSP90. k The establishment of the PDX models and the treatment strategy. Representative images are shown, and tumor growth was monitored. l Representative images showing the expression of SDCBP in PDX#9, #14, #55 and #57 (right panel). m Summary diagram. Bars, SDs; *P < 0.05; **P < 0.01; ***P < 0.001.

Similar articles

Cited by

References

    1. Torre LA, et al. Global cancer statistics, 2012. CA Cancer J. Clin. 2015;65:87–108. doi: 10.3322/caac.21262. - DOI - PubMed
    1. Enzinger PC, Mayer RJ. Esophageal cancer. N. Engl. J. Med. 2003;349:2241–2252. doi: 10.1056/NEJMra035010. - DOI - PubMed
    1. Zheng HC. The molecular mechanisms of chemoresistance in cancers. Oncotarget. 2017;8:59950–59964. doi: 10.18632/oncotarget.19048. - DOI - PMC - PubMed
    1. Guaragnella N, Giannattasio S, Moro L. Mitochondrial dysfunction in cancer chemoresistance. Biochem. Pharmacol. 2014;92:62–72. doi: 10.1016/j.bcp.2014.07.027. - DOI - PubMed
    1. Guerra F, Arbini AA, Moro L. Mitochondria and cancer chemoresistance. Biochim. Biophys. Acta Bioenerg. 2017;1858:686–699. doi: 10.1016/j.bbabio.2017.01.012. - DOI - PubMed