. 2023 Jul 17;14(1):4274.
doi: 10.1038/s41467-023-39981-6.

Proteogenomics of clear cell renal cell carcinoma response to tyrosine kinase inhibitor

Affiliations

Proteogenomics of clear cell renal cell carcinoma response to tyrosine kinase inhibitor

Hailiang Zhang et al. Nat Commun. .

Abstract

The tyrosine kinase inhibitor (TKI) Sunitinib is one the therapies approved for advanced renal cell carcinoma. Here, we undertake proteogenomic profiling of 115 tumors from patients with clear cell renal cell carcinoma (ccRCC) undergoing Sunitinib treatment and reveal the molecular basis of differential clinical outcomes with TKI therapy. We find that chromosome 7q gain-induced mTOR signaling activation is associated with poor therapeutic outcomes with Sunitinib treatment, whereas the aristolochic acid signature and VHL mutation synergistically caused enhanced glycolysis is correlated with better prognosis. The proteomic and phosphoproteomic analysis further highlights the responsibility of mTOR signaling for non-response to Sunitinib. Immune landscape characterization reveals diverse tumor microenvironment subsets in ccRCC. Finally, we construct a multi-omics classifier that can detect responder and non-responder patients (receiver operating characteristic-area under the curve, 0.98). Our study highlights associations between ccRCC molecular characteristics and the response to TKI, which can facilitate future improvement of therapeutic responses.


Conflict of interest statement

The authors declare no competing interests.

Figures

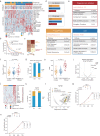
Fig. 1
Fig. 1. Proteogenomic analysis of ccRCC response to sunitinib.
a Schematic representation of the multi-omics analyses of ccRCC, including sample preparation, protein identification, WES, and function verification. b The cohort includes 27 responders and 88 non-responders undergoing sunitinib treatment. Their clinical parameters are shown in the heatmap. c Kaplan–Meier curves of progression-free survival (PFS) and overall (OS) for patients with distinct clinical responses (two-sided log-rank test). P values were described in the figure. d Comparison of frequently mutated genes among ccRCC cohorts. Source data are provided as a Source Data file.
Fig. 2
Fig. 2. Impacts of AA exposure on sunitinib therapeutic outcomes.
a Kaplan–Meier curves of progression-free survival (PFS) for patients with (n = 19) or without (n = 94) the AA signature (two-sided GB-Wilcoxon test). b Comparisons of tumor size between patients with (n = 19) or without (n = 94) the AA signature (two-sided t-test). Data were shown as mean ± SD. c Pathways enriched by differentially expressed proteins between patients with or without the AA signature. d Left panel: heatmap showed the expression of glycolysis-related and PPP-related proteins at the transcriptome and proteome levels, respectively. The values were transformed by z-score. Right panel: Glucose metabolism alteration caused by the AA signature. e, f Proliferation of 786 O and ACHN cells was detected by CCK-8 assay (AA-100 μM, Sunitinib-200 nM, n = 9 independent experiments, two-sided t-test). P values were described in the figure. ns not significant. Shown are the average values with SD. g, h AA treatment inhibited the expressions of G6PD, PGD, and TKT in 786 O and ACHN cells in time-and dose-dependent manners. Numerical values below the gels indicate the quantification of the bands relative to the control (hereinafter). i Ribose-5-phosphate concentrations in cells treated with AA or not (n = 3 independent experiments, two-sided t-test). Data were shown as mean ± SD. P values were described in the figure. J, k Left panel, SP1 knockdown downregulated PPP enzymes at the protein level. Right panel, SP1 overexpression upregulated PPP enzymes at the protein level, in 786 O and ACHN cells, respectively. Numerical values below the gels indicate the quantification of the bands relative to the control. l, m AA treatment did not affect the transcription of SP1 in the 786-O cell and ACHN cell, respectively (n = 3 independent experiments). Data were shown as mean ± SD. (AA-100 μM, 24 h). n MG132 abrogated the AA-mediated PPP enzymes downregulation by inhibiting the degradation of SP1. (AA-100 μM, 24 h). Numerical values below the gels indicate the quantification of the bands relative to the control. o Schematic diagram showing AA regulated the pentose phosphate pathway. Source data are provided as a Source Data file.
Fig. 3
Fig. 3. Impacts of copy number alterations on sunitinib therapeutic outcomes.
a Cox regression analysis of significant arm-level CNA events, based on the PFS. b Comparison of gene-level CNAs between Responders and Non-Responder in this cohort. The upper plot illustrates the frequency of CNA events and the lower plot illustrates the −log10 (p value) of each gene for the comparison of Responders and Non-Responder (two-sided Fisher’s exact test). c Heatmap depicting the protein expression levels positively correlated with the Chromosome 7q copy number. Two-sided Spearman’s correlations are shown in the right panel. The values were transformed by z-score. d Boxplots depicted the expression of LAMTOR4 (proteome level: 7q gain n = 30, non-7q gain n = 55; transcriptome level: 7q gain n = 31, non-7q gain n = 62), MDH2 (proteome level: 7q gain n = 31, non-7q gain n = 62; transcriptome level: 7q gain n = 31, non-7q gain n = 62), and CALU (proteome level: 7q gain n = 31, non-7q gain n = 62; transcriptome level: 7q gain n = 31, non-7q gain n = 62) between 7q gain and non-7q gain cohort at transcriptome and proteome level, separately (two-sided Wilcoxon rank-sum test). The line represents the mean with SEM and upper and lower quartiles, respectively. P values were described in the figure. e Overexpression of LAMTOR4, MDH2, and CALU increased the phosphorylation of S6K. Numerical values below the gels indicate quantification of the bands relative to control. f The immunohistochemical (IHC) for pS6K in the tumor and tumor-adjacent tissue of responders and non-responders (analyzed patients: n = 3). The scale bar indicates 80 μm. g CCK-8 detected the effect of LAMTOR4, MDH2, and CALU overexpression and Sunitinib treatment on cell proliferation. (Sunitinib-200 nM, n = 9 independent experiments, two-sided t-test). Data were presented as mean values ± SD. P values were described in the figure. ns not significant. h Proposed model explaining the 7q gain-induced Sunitinib treatment non-response. Source data are provided as a Source Data file.
Fig. 4
Fig. 4. Gene mutation in responders and non-responders associated with therapy outcomes.
a Significant differentially altered mutated genes in responder and non-responder groups (from left to right, the p values are: 0.0201, 0.0486, 0.0097, 0.0375, 0.0375, 0.0375, 0.0375, 0.0375, 0.0111, and 0.0111; two-sided Fisher’s exact test). P values were described in the figure. b Comparison of the effect of mutations on the OS among this study and TCGA cohorts (log-rank test). c Kaplan–Meier curves of overall survival (OS) for patients with or without VHL mutations (log-rank test). d, e Differentially expressed proteins in the VHL mutation and WT groups and their associated biological pathways. The values were transformed by z-score. f A brief model depicting the functional impact of VHL mutation. g The impact of VHL knockdown and AA treatment on intracellular lactate (n = 5 independent experiments, data were presented as mean values ± SD, two-sided t-test, AA-100μM). P values were described in the figure. h Cell proliferation assay detected the effect of VHL knockdown and Sunitinib treatment on cell proliferation in ACHN cells. (Sunitinib-200 nM, two-sided t-test). Shown are the average values with ±SD. P values were described in the figure. ns not significant. i, j Differentially expressed proteins in the KMT2C mutation and WT groups and their associated biological pathways. The values were transformed by z-score. k Kaplan–Meier curves of PFS for patients with different genotypes of VHL and KMT2C (log-Prank test). l Pie charts representing the distribution of different genotypes in the responder and non-responder groups. m Heatmap of protein expression abundances of PI3K-AKT-mTOR pathway and apoptosis pathway among the four genotypes. The values were transformed by z-score. n A brief model depicting the functional impact of VHL and KMT2C co-mutation. *p < 0.05, **p < 0.01. Source data are provided as a Source Data file.
Fig. 5
Fig. 5. Proteomic and clinical features associated with sunitinib therapeutic outcomes.
a Abundance of sunitinib targets in responders (n = 27) and non-responders (n = 88). P values are derived from the two-sided Wilcoxon rank-sum test. Boxplots show the median (central line), the 25–75% IQR (box limits), and the ±1.5×IQR (whiskers). b Boxplot showing the inferred Sunitinib-targeted RTK activities between responders (n = 17) and non-responders (n = 49). P values are derived from the two-sided Wilcoxon rank-sum test. Boxplots show the median (central line), the 25–75% IQR (box limits), and the ±1.5×IQR (whiskers). c Proteins involved in pathways correlated with sunitinib response. d Differential analysis of kinase activities by KSEA between responders and non-responders. e, Comparison of inferred kinase activities of MTOR and CDK2 between Responders (n = 17) and Non-Responders (n = 49) (two-sided Wilcoxon rank-sum test). Boxplots show the median (central line), the 25–75% IQR (box limits), and the ±1.5×IQR (whiskers). P values were described in the figure. f Kaplan–Meier curves of OS for patients with different inferred MAP2K1 activities (log-rank test). g Scatterplot showing inferred kinase activity (y-axis) versus the phospho-abundance of the targeted substrates (x-axis) (two-sided Spearman’s correlation test). P values were described in the figure. Source data are provided as a Source Data file.
Fig. 6
Fig. 6. Associations between immune infiltration of ccRCC and therapy outcomes.
a Heatmap of immune signatures in three ccRCC immune clusters. b Kaplan–Meier curves of PFS for the three immune clusters (log-rank test). P values were described in the figure. c Proportions of responders and non-responders among the three clusters. d Proportions of VHL mutation and chromosome 3p loss in immune groups. e Pathways enriched in the three immune subtypes. f Comparison of plasma PLT counts among three immune subtypes (n (T-cell infiltrated cluster) = 51, n (Cold cluster) = 37, n (Progenitor-cell infiltrated cluster) = 27 biologically independent samples examined). P values are derived from the two-sided Wilcoxon rank-sum test. Boxplots show the median (central line), the 25–75% IQR (box limits), and the ±1.5×IQR (whiskers). g Distribution of thrombocytosis in responders and non-responders (two side Fisher’s exact test). P values were described in the figure. h Comparison of CMP scores among three immune subtypes (n (T-cell infiltrated cluster) = 51, n (Cold cluster) = 37, n (Progenitor-cell infiltrated cluster) = 27 biologically independent samples examined). P values are derived from Kruskal–Wallis test. Boxplots show the median (central line), the 25–75% IQR (box limits), and the ±1.5×IQR (whiskers). i Correlations between platelet aggregate (plug formation) scores and xCell inferred cell components (two-sided Spearman’s correlation test). j Heatmap of proteins involved in platelet aggregate and coagulation in the three subtypes. k Responders and non-responders include different proportions of high (n = 57) or low (n = 58) expression of TGFB1 (two-sided Fisher’s exact test). P values were described in the figure. l Proteins involved in tumor immune escape and angiogenesis were co-expressed with TGFB1. m, n CCK-8 detected the effect of TGFB1 intervention and sunitinib treatment on cell proliferation in 786-O and ACHN cells, respectively. (sunitinib-200 nM, **p < 0.01, two-sided t-test). Shown are the average values with SD. P values were described in the figure. ns not significant. Source data are provided as a Source Data file.
Fig. 7
Fig. 7. Proteomic classifier to predict sunitinib response.
a Machine learning-based model construction pipeline for the TKI treatment response, including classification target, feature selection, model construction, model performance evaluation, and model performance validation. b, c The five repeatedly cross-validated ROC-AUC on the train cohort for proteome-based random forest (RF) and multi-omics-base RF, separately. d The confusion matrix of test cohort for multi-omics-base RF. e The comparison of ROC-AUC on the test cohort for proteome-based RF and multi-omics-base RF. f The feature importance of multi-omics-based RF model. The blue, orange, green, and red rectangles indicated proteome, transcriptome, clinical, and genomic features, respectively. g Summary of clinical and molecular characteristics in sunitinib responders and non-responders. Source data are provided as a Source Data file.

References

    1. Siegel RL, Miller KD, Fuchs HE, Jemal A. Cancer statistics, 2021. CA Cancer J. Clin. 2021;71:7–33. doi: 10.3322/caac.21654. - DOI - PubMed
    1. Gansler T, Fedewa S, Amin MB, Lin CC, Jemal A. Trends in reporting histological subtyping of renal cell carcinoma: association with cancer center type. Hum. Pathol. 2018;74:99–108. doi: 10.1016/j.humpath.2018.01.010. - DOI - PubMed
    1. Cancer Genome Atlas Research, N. Comprehensive molecular characterization of clear cell renal cell carcinoma. Nature499, 43–49, (2013). - PMC - PubMed
    1. Clark DJ, et al. Integrated proteogenomic characterization of clear cell renal cell carcinoma. Cell. 2019;179:964–983.e931. doi: 10.1016/j.cell.2019.10.007. - DOI - PMC - PubMed
    1. Brugarolas J. Molecular genetics of clear-cell renal cell carcinoma. J. Clin. Oncol. 2014;32:1968–1976. doi: 10.1200/JCO.2012.45.2003. - DOI - PMC - PubMed

Publication types

MeSH terms