. 2023 Jul 17;14(1):4251.
doi: 10.1038/s41467-023-39953-w.

IL1R1+ cancer-associated fibroblasts drive tumor development and immunosuppression in colorectal cancer

Affiliations

IL1R1+ cancer-associated fibroblasts drive tumor development and immunosuppression in colorectal cancer

E Koncina et al. Nat Commun. .

Abstract

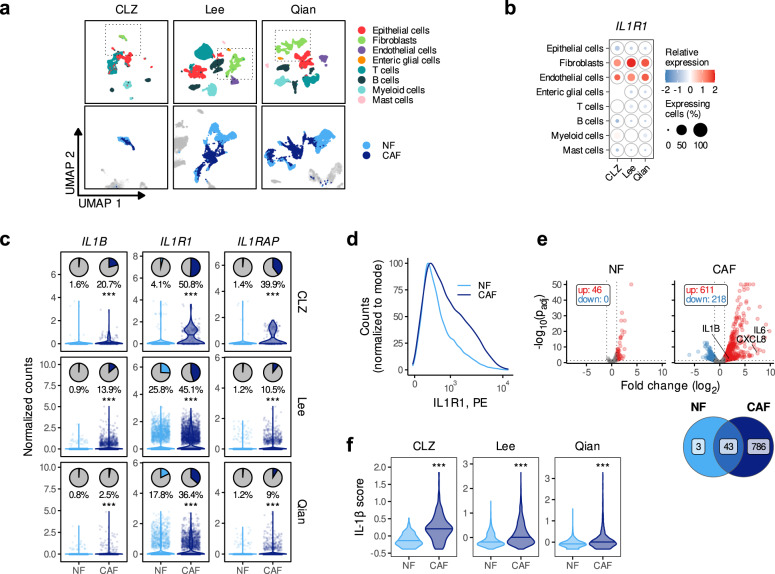
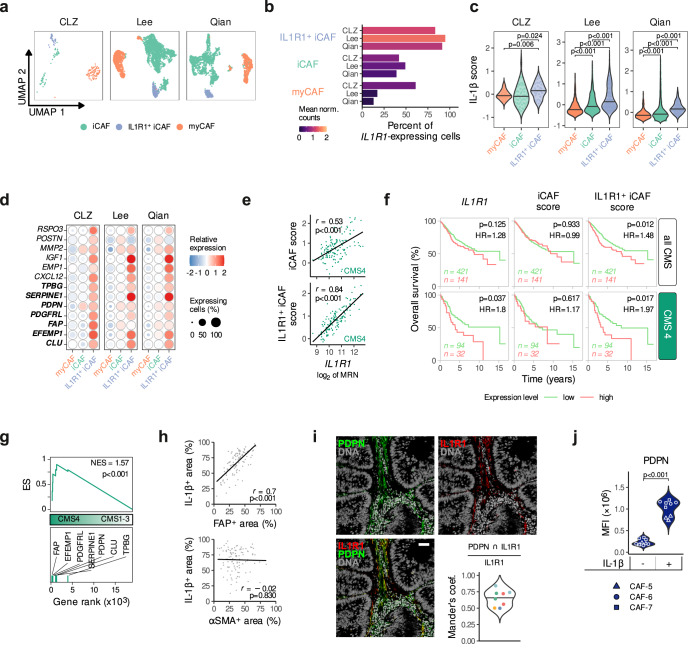
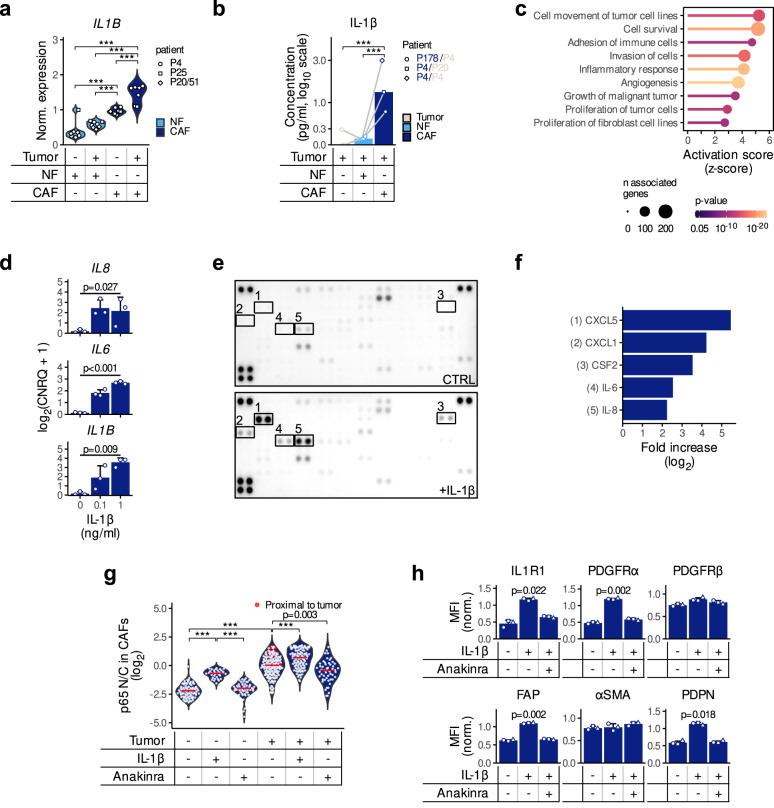
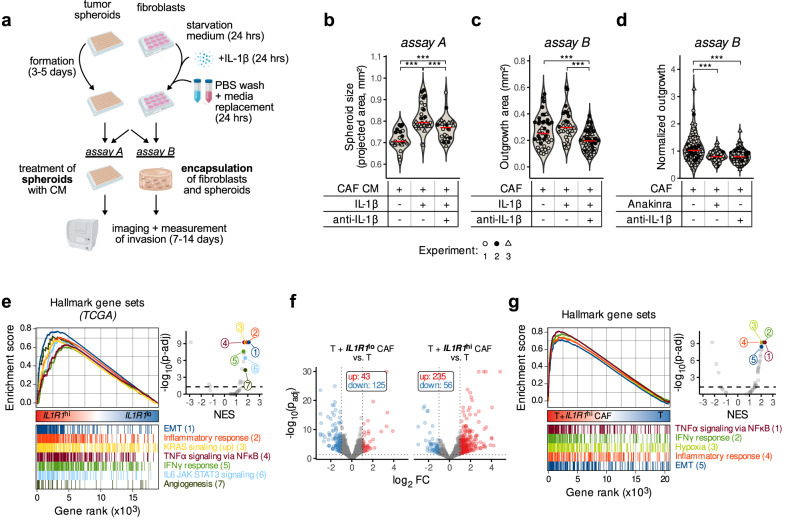
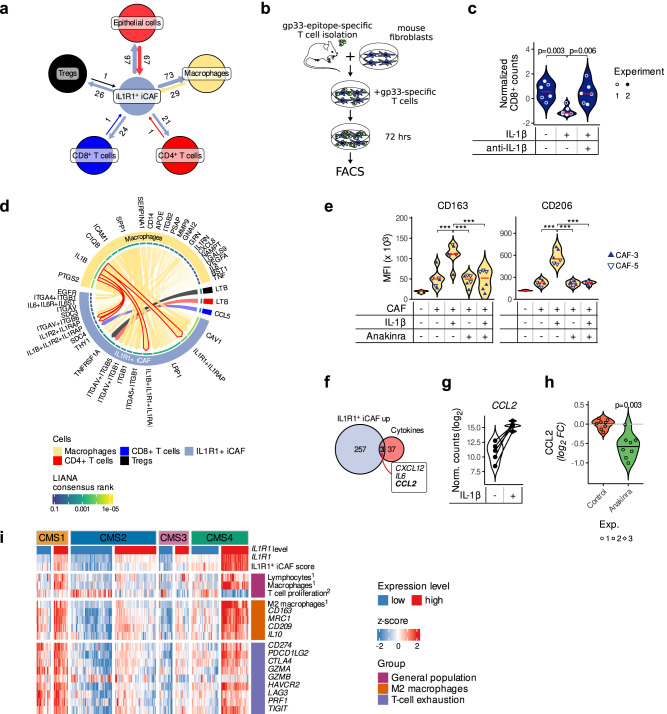
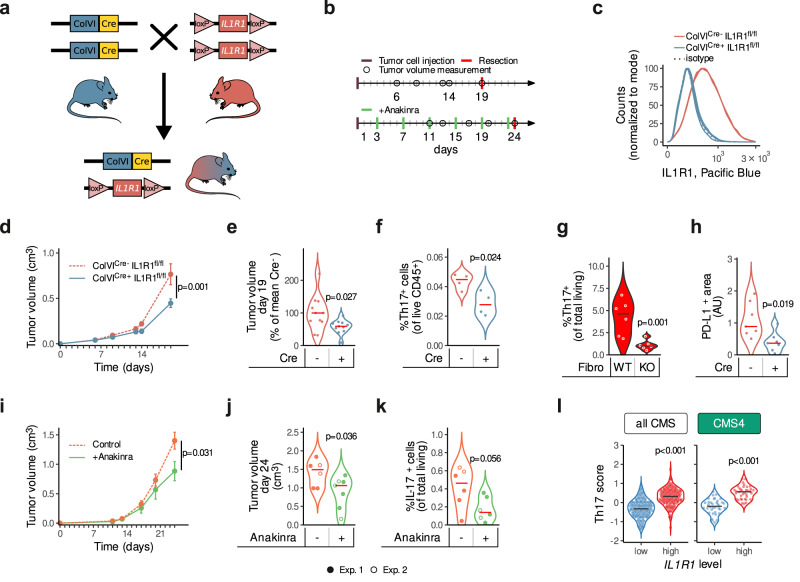
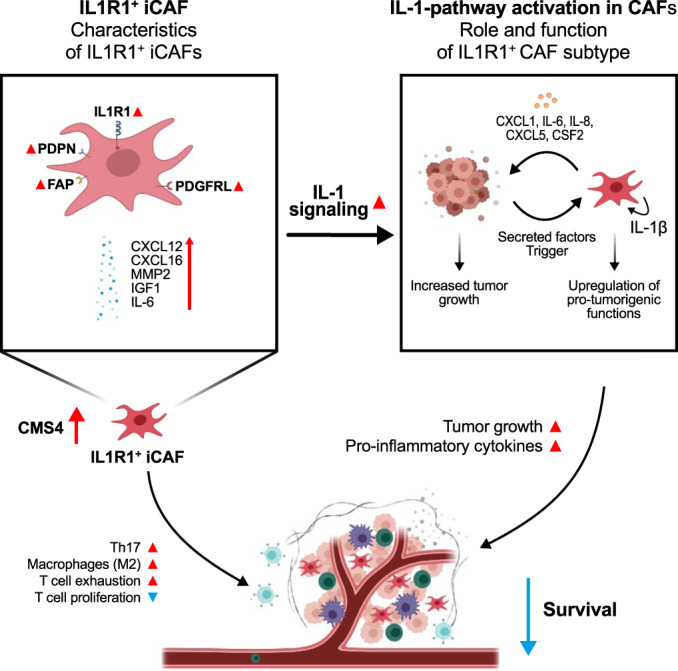
Fibroblasts have a considerable functional and molecular heterogeneity and can play various roles in the tumor microenvironment. Here we identify a pro-tumorigenic IL1R1+, IL-1-high-signaling subtype of fibroblasts, using multiple colorectal cancer (CRC) patient single cell sequencing datasets. This subtype of fibroblasts is linked to T cell and macrophage suppression and leads to increased cancer cell growth in 3D co-culture assays. Furthermore, both a fibroblast-specific IL1R1 knockout and IL-1 receptor antagonist Anakinra administration reduce tumor growth in vivo. This is accompanied by reduced intratumoral Th17 cell infiltration. Accordingly, CRC patients who present with IL1R1-expressing cancer-associated-fibroblasts (CAFs), also display elevated levels of immune exhaustion markers, as well as an increased Th17 score and an overall worse survival. Altogether, this study underlines the therapeutic value of targeting IL1R1-expressing CAFs in the context of CRC.


Conflict of interest statement

The authors declare no competing interests.

Figures

Fig. 1
Fig. 1. IL1R1 and IL1B expression in CRC patients.
a UMAP plot showing the main cell types identified in the CLZ, Lee, and Qian scRNA-seq datasets (upper row) and the distribution between normal and tumor fibroblasts (lower row). b Expression of IL1R1 across the different cell-types in the three scRNA-seq datasets. c Expression of IL1R1, IL1RAP, and IL1B in the three scRNA-seq datasets. The pie charts show the percentage of IL1R1-, IL1RAP- or IL1B-expressing cells (counts > 0) and the violin and scatter plots show the normalized counts in the NF and CAF populations. d Expression of IL1R1 in paired primary normal and tumor fibroblasts from a CRC patient (P42, patient characteristics in Supplementary Table 1) determined by flow cytometry. e Upper part—Volcano plot showing the genes differentially expressed upon IL-1β treatment in paired NFs and CAFs from n = 2 CRC patients (P20 and P42). Lower part—Venn diagram showing the overlap of the number of differentially expressed genes in NFs and CAFs upon IL-1β treatment (1 ng/ml). 46 and 829 genes were differentially expressed in NFs and CAFs respectively, among which 43 genes were upregulated in both cell types. f IL-1β scores in normal and tumor fibroblasts from the three datasets. Statistical differences were calculated using the two-sided Wilcoxon signed rank test in c and f (***p < 0.001). Horizontal lines in C and F show the median. Number of patients per dataset in panels a-c and f is reported in Supplementary Fig. 1a. Source data are provided as a Source Data file.
Fig. 2
Fig. 2. IL1R1 and IL1B expression in CAF subtypes and their association with survival in CRC patients.
a UMAP plot showing CAF subtypes identified in the CLZ, Lee and Qian scRNA-seq datasets. b IL1R1 expression in the three CRC CAF subtypes (iCAF, IL1R1+ iCAF and myCAF). The bar length shows the percentage of IL1R1-expressing cells and the color gradient shows the mean of normalized counts. c IL-1β scores in the CAF subpopulations from the CLZ, Lee, and Qian datasets. Horizontal lines show the median. Holm’s adjusted pairwise two-sided Wilcoxon signed rank test (***p < 0.001). d Heatmap showing the expression of IL1R1+ iCAF-related genes in the three CAF subtypes of the three datasets. The color gradient shows the relative expression (mean of scaled expression values) and the bubble size shows the percentage of expressing cells. Genes appearing in bold define the IL1R1+ iCAF signature. e Correlation between IL1R1 expression with iCAF and IL1R1+ iCAF scores in CMS4 patients (TCGA dataset, n = 143). f Kaplan-Meier curves showing the prognostic value of IL1R1, iCAF and IL1R1+ iCAF scores on the overall survival of CRC patients (GSE39582 dataset). The upper row shows all patients (n = 562) and the lower row shows the subset of CMS4 patients (n = 126). The third quartile expression value was used as a threshold to split patients into low and high expressors (75% low vs 25% high expressing patients). Non-adjusted p-values and hazard ratio (HR) of the Cox proportional hazard model are reported. g GSEA of the IL1R1+ iCAF gene set in CMS4 (n = 143) vs. CMS1-3 (n = 368) TCGA patients. The running enrichment score (ES), as well as the normalized enrichment score (NES) and p-value are reported. h Correlation between FAP+ and IL-1β+ staining (top panel) and αSMA+ and IL-1β+ staining (lower panel) identified after IHC staining on tissue microarray sections of our established in-house CRC cohort (n = 106 patients). i IL1R1 and PDPN co-localization in immunofluorescence stainings of human tumor samples (n = 5) and beeswarm plot showing the normalized Mander’s colocalization coefficient of IL1R1 and PDPN on sections measured from five different patients (shown by different colors on the lower right panel). Individual microphotographs of IL1R1 and PDPN IHC stainings as well as DAPI stained DNA content. Scale bar = 50 µm. j Expression of PDPN determined by flow cytometry (MFI) in IL-1β stimulated (1 ng/ml) CAFs (CAF-5, CAF-6 and CAF-7 cultures, patient characteristics in Supplementary Table 1) and unstimulated controls. Tukey post-hoc test following a nested ANOVA design (***p < 0.001). For e and h, the Pearson’s correlation coefficients r and two-sided p-values are reported. Number of patients per dataset in ad is reported in Supplementary Fig. 1a. Source data are provided as a Source Data file.
Fig. 3
Fig. 3. Activation of the IL1-pathway in CAFs by tumor cells leads to an elevated secretion of pro-inflammatory cytokines.
a IL1B expression in fibroblasts upon co-culture with tumor cells quantified by qPCR. NF/CAF and tumor spheroid cultures were either paired (P4 and P25) or unpaired (P51 tumor and P20 NF/CAF). CNRQ expression values have been normalized by log2 transformation followed by a non-centered scaling by patient pairs shapes (Tukey post-hoc test following a nested ANOVA design; ***p < 0.001). b IL-1β concentrations (pg/ml) in the media from tumor cells cultured alone or in the presence of NFs or CAFs. n = 3 independent experiments (connecting lines) from paired cultures (P4) or unpaired cultures (P178 tumor spheres and P4 NF/CAF) are shown (Tukey post-hoc test following a repeated measures ANOVA; ***p < 0.001). c Predicted activation of downstream cellular effects in CAFs upon IL1β stimulation. Differentially expressed genes were analyzed using the Ingenuity Pathway Analysis (IPA) software with the “Downstream Effects Analysis” function. d Expression of IL8, IL6, and IL1B after IL-1β stimulation (100 pg/ml or 1 ng/ml) of P4 CAFs. Log2 transformed CNRQ expression values from n = 3 independent experiments are shown as mean ± SD (Repeated measures ANOVA). e, f Cytokine secretion triggered by IL-1β stimulation (1 ng/ml) in tumor fibroblasts (CT5.3 cells). The Proteome Profiler Human XL Cytokine Array Kit (R&D Systems) was used to identify cytokines secreted into the conditioned media (n = 2 independent experiments). Images in e were analyzed using ImageJ and the integrated densities in f were normalized to the values measured in the control condition (CTRL). g p65 nuclear-to-cytoplasmic ratio (N/C) in CAFs. After treating tumor cell (LS174T)—CAF (CAF-8) co-cultures with either IL-1β or Anakinra, ICC staining of p65 was quantified using ImageJ and N/C was calculated. Red dots show CAFs in close proximity to tumor spheroids (<25 µm). Tukey post-hoc test following a one-way ANOVA (***p < 0.001) (n = 2 independent experiments). h MFI of IL1R1, PDGFRα, PDGFRβ, FAP, αSMA and PDPN on IL-1β treated CT5.3 cells as assessed by flow cytometry. Values measured in n = 3 independent experiments were normalized (non-centered scaling) and bar charts represent the mean ± SD (Holm’s adjusted two-sided pairwise paired t-test). Source data are provided as a Source Data file.
Fig. 4
Fig. 4. IL-1β-activated CAFs promote tumor growth.
a Experimental layout of the spheroid growth (assay A) and collagen gel 3D organotypic assay (assay B). b Tumor epithelial cells (P4) were grown as spheroids (assay A in a) and treated with conditioned media (CM) collected from CAF cultures (P42) pretreated with either IL-1β (1 ng/ml) alone or in combination with anti-IL-1β (100 ng/ml). Once pretreated, cells were washed with PBS to remove any residual IL-1β and the medium conditioned during 24 h. Measures from 3 independent experiments after 9 days of growth are shown as different data point shapes (Tukey post-hoc test following a nested ANOVA design; ***p < 0.001). c Organotypic 3D assay of tumor spheroids (P4) cocultured with CAFs in collagen I gels (P42; assay B in a) pre-treated with either IL-1β (1 ng/ml) alone or in combination with anti-IL-1β (100 ng/ml). Measures from three independent experiments are shown as different data point shapes (Tukey post-hoc test following a nested ANOVA design; ***p < 0.001). d Organotypic encapsulation assay (assay B in a) where tumor spheroids (P4) were encapsulated with CAFs (CT5.3) and treated with anti-IL-1β (100 ng/ml) or Anakinra (100 ng/ml). The outgrowth areas from n = 4 independent experiments were normalized (non-centered scaling by experiment). Statistically significant differences were determined using a nested ANOVA followed by Tukey’s post-hoc test (***p < 0.001). e GSEA in IL1R1hi (upper quartile, n = 128) vs IL1R1lo (lower quartile, n = 128) TCGA tumors using the Hallmark gene sets. The running enrichment scores (ES) of most significant pathways of interest are shown in the left panel, and the volcano plot (right panel) shows the normalized enrichments scores (NES) against the log10 of adjusted p-value. f Volcano plot showing the genes differentially expressed (RNA-Seq data) in HT-29 tumor spheroids when cocultured with either IL1R1lo (n = 3 independent biological replicates from three different patients P16, P19, P22) or IL1R1hi (n = 3 independent biological replicates from three different patients P32, P41, P42) CAFs. g MSigDB Hallmark GSEA in tumor spheroids (HT-29) upon co-culture with IL1R1hi CAFs. The running enrichment scores (ES) for selected gene sets are shown in addition to the volcano plot showing the normalized enrichment scores (NES) and adjusted p-values of all 50 MSigDB Hallmark gene sets. Source data are provided as a Source Data file.
Fig. 5
Fig. 5. IL1R1+ iCAFs regulate immune cells in the tumor microenvironment.
a Potential LR interactions between IL1R1+ iCAFs and epithelial cells, macrophages and T cells detected by LIANA in the Lee scRNA-seq dataset. b Experimental setup of a CD8+ T cell proliferation assay. Gp33-specific T cells were isolated from spleens and lymph nodes of P14 TCRVα2Vβ8 mice and co-cultured with L cells (mouse fibroblast cell line). c Proliferation of CD8+ T cells after 72 h of co-culture with fibroblasts pretreated with IL-1β (1 ng/ml) alone or in combination with anti-IL-1β (100 ng/ml) as analyzed by flow cytometry. Data from two independent experiments (shown as filled and empty circles) are represented. Statistically significant differences were determined using a nested ANOVA followed by Tukey’s post-hoc test. d Chord diagram showing LR interactions (LIANA aggregate score <0.05) between ligands borne by immune cells (macrophages, CD4+ T cells, CD8+ T cells and Tregs) and receptors borne by IL1R1+ iCAFs in the Lee scRNA-seq dataset. Arrow thickness and opacity shows higher ranked LIANA scores. Arrows outlined in red highlight the IL-1β-IL1R1 pair. e CD163 (left) and CD206 (right) expression on PBMC-derived macrophages upon 48-h-long co-culture with IL-1β (1 ng/ml)—and/or Anakinra (100 ng/ml) pre-treated CAFs (n = 2 independent experiments with 2 different CAF cultures, CAF-3 or CAF-5, in each experiment). f Venn diagram showing the overlap of genes upregulated in IL1R1+ iCAFs and the geneset of secreted cytokines known to exert macrophage/monocytes chemotaxis. g Violin plot showing the expression of CCL2 upon stimulation of fibroblasts with IL-1β (n = 5 independent samples each representing one patient-derived CAF culture). h Violin plot showing the secreted levels of CCL2 in CAFs upon Anakinra treatment. Data from three independent experiments are represented. i Expression of immune-cell-related markers and scores in TCGA CRC patients. Patients were divided into IL1R1hi (upper quartile, n = 128) vs IL1R1lo (lower quartile, n = 128) within each of the four CMS. The expression of IL1R1 and immune-related genes, as well as IL1R1+ iCAF, immune infiltration (Thorsson et al., highlighted as ref. ) and T cell proliferation (Szabo et al., highlighted as2) scores are shown (as z-scores). Source data are provided as a Source Data file.
Fig. 6
Fig. 6. IL1R1 ablation or inhibition in vivo reduces tumor growth and regulates immune cells in the TME.
a Generation of ColVIcre+IL1R1fl/fl mice. b Experimental design of both in vivo assays. Upper diagram: MC38 cells were injected into both flanks of ColVIcre+IL1R1fl/fl mice and ColVIcre-IL1R1fl/fl control littermates and tumor growth was measured over time. Lower diagram: CT26 cells were injected into both flanks of BALB/c mice. Mice were treated with Anakinra (10 mg/kg) on days 3, 7, 11, 15 and 23 after tumor cell implantation and tumor growth followed over time. c IL1R1 expression in colon fibroblasts from ColVIcre+IL1R1fl/fl and ColVIcre-IL1R1fl/fl mice as measured by FACS, n = 3 mice per condition. d–f. Tumor volumes (cm3) measured over time and shown as mean ± SEM from one representative experiment (n = 4 mice in the ColVIcre+IL1R1fl/fl and n = 5 mice in the ColVIcre-IL1R1fl/fl condition, respectively) out of three independent experiments in d, tumor volumes at experimental endpoint pooled from three independent experiments and normalized to the control, with n = 11 mice per condition in e, Th17 cells (CD4+ RORγT+ IL-17+ cells, shown as % of live cells) in tumors as assessed by FACS in one representative experiment of three, with n = 4 mice per condition in f in ColVIcre+IL1R1fl/fl and ColVIcre-IL1R1fl/fl mice subcutaneously implanted with MC38 cells. g Th17 cell differentiation (CD4+ RORγT+ IL17+ cells, shown as % of live cells) upon co-culture with fibroblasts from ColVIcre+IL1R1fl/fl (KO) or ColVIcre-IL1R1fl/fl (WT) mice (n = 6 per condition), as assessed by FACS. h PD-L1 expression in tumors assessed by IF in one representative experiment of three, with n = 7 tumors per condition in ColVIcre+IL1R1fl/fl and ColVIcre-IL1R1fl/fl mice subcutaneously implanted with MC38 cells. ik Tumor volumes (cm3) measured over time and shown as mean ± SEM with n = 8 mice treated with Anakinra or n = 7 mice treated with the vehicle control out of two independent experiments in i, tumor volumes at experimental endpoint pooled from two independent experiments in j, IL-17-producing cells (shown as % of live cells) isolated from tumors at experimental endpoint as assessed by flow cytometry in k in mice treated with Anakinra or the vehicle control. Two independent experiments are pooled in j-k to show a total of n = 7 mice treated with Anakinra or n = 6 mice treated with the vehicle control. Volumes of tumors from both flanks were averaged for each mouse in panels d, e, i and j. Th17 and IL-17+ cells from both flanks were averaged for each mouse in f and k. l Th17 scores in TCGA patients. Patients were split into IL1R1hi (upper quartile) and IL1R1lo (lower quartile), either in all CMS or in CMS4 only. Repeated measures ANOVA in d and h. Two-sided unpaired t-tests in eg, il; ***p < 0.001. Red or black horizontal lines in eh and jk represent the median.
Fig. 7
Fig. 7. A summary of the roles played by the IL1R1+ CAFs in the CRC TME. The IL1R1+ subtype of CAFs is linked to lower survival and to higher tumor growth and immune evasion (M2 polarization and T cell exhaustion markers).
IL1R1+ iCAFs show increased IL-1 signaling and NFκB pathway activation, leading to the secretion of pro-inflammatory cytokines participating in tumor growth. Finally, IL1R1+ CAFs favor infiltration of Th17 cells into the TME.

References

    1. Jin M-Z, Jin W-L. The updated landscape of tumor microenvironment and drug repurposing. Signal Transduct. Target. Ther. 2020;5:166. doi: 10.1038/s41392-020-00280-x. - DOI - PMC - PubMed
    1. Yoshida GJ, Azuma A, Miura Y, Orimo A. Activated fibroblast program orchestrates tumor initiation and progression; molecular mechanisms and the associated therapeutic strategies. Int. J. Mol. Sci. 2019;20:2256. doi: 10.3390/ijms20092256. - DOI - PMC - PubMed
    1. Berdiel-Acer M, et al. Differences between CAFs and their paired NCF from adjacent colonic mucosa reveal functional heterogeneity of CAFs, providing prognostic information. Mol. Oncol. 2014;8:1290–1305. doi: 10.1016/j.molonc.2014.04.006. - DOI - PMC - PubMed
    1. Nurmik M, Ullmann P, Rodriguez F, Haan S, Letellier E. In search of definitions: cancer‐associated fibroblasts and their markers. Int. J. Cancer. 2020;146:895–905. doi: 10.1002/ijc.32193. - DOI - PMC - PubMed
    1. Kalluri R. The biology and function of fibroblasts in cancer. Nat. Rev. Cancer. 2016;16:582–598. doi: 10.1038/nrc.2016.73. - DOI - PubMed

Publication types

MeSH terms

Substances