. 2023 Jul 17;14(7):442.
doi: 10.1038/s41419-023-05947-1.

Single-cell transcriptomic profiles in the pathophysiology within the microenvironment of early diabetic kidney disease

Affiliations

Single-cell transcriptomic profiles in the pathophysiology within the microenvironment of early diabetic kidney disease

Yi-Chun Tsai et al. Cell Death Dis. .

Abstract

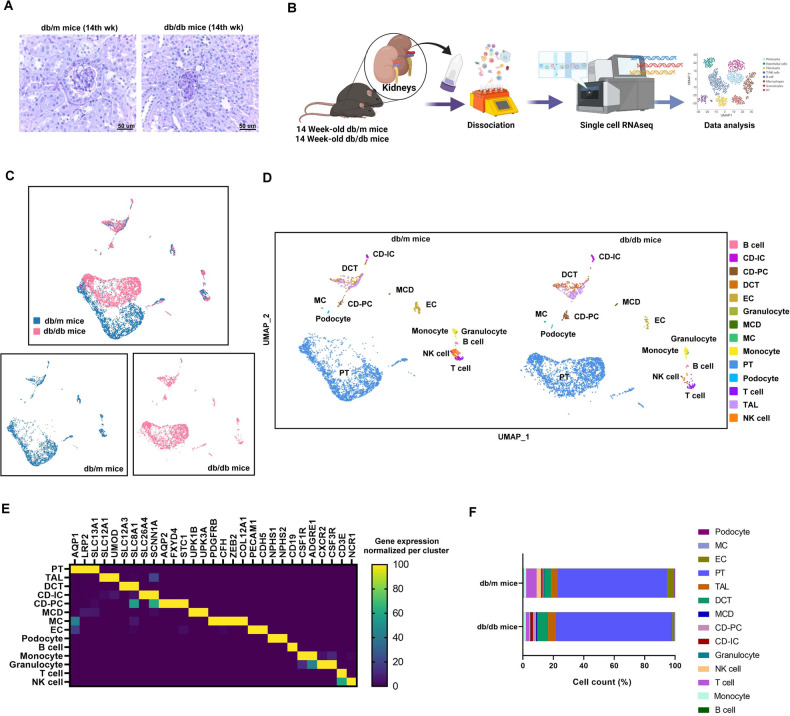
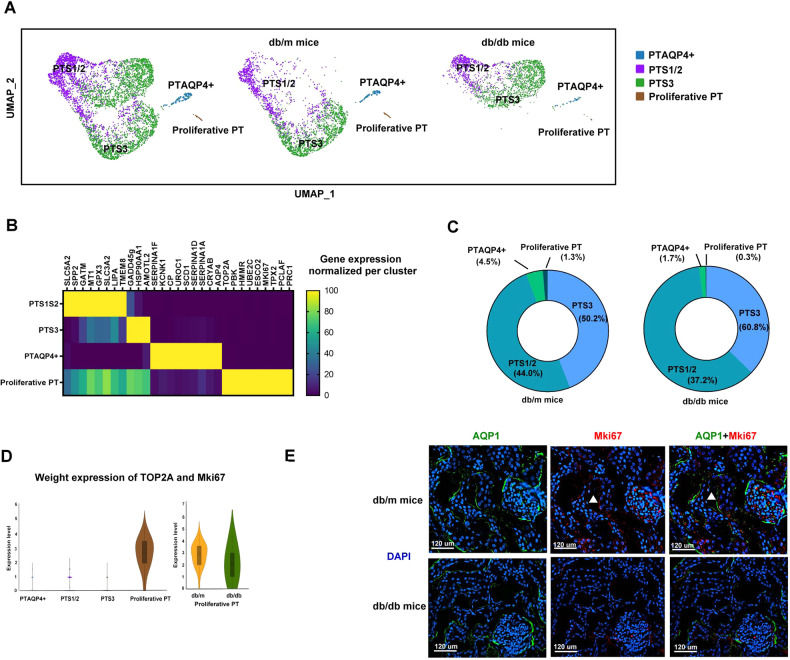
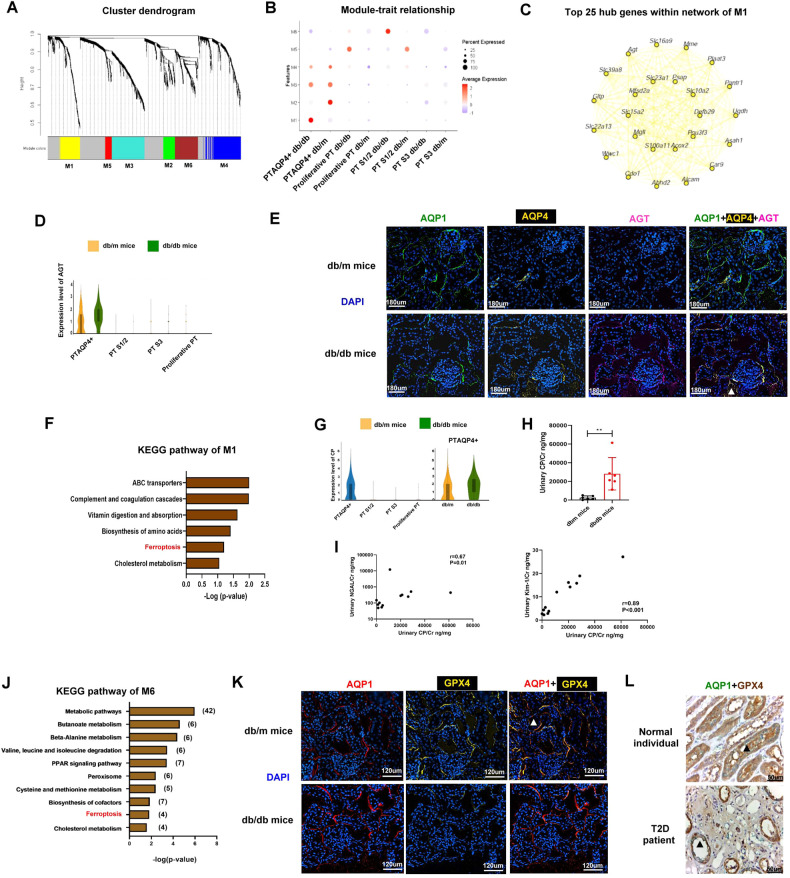
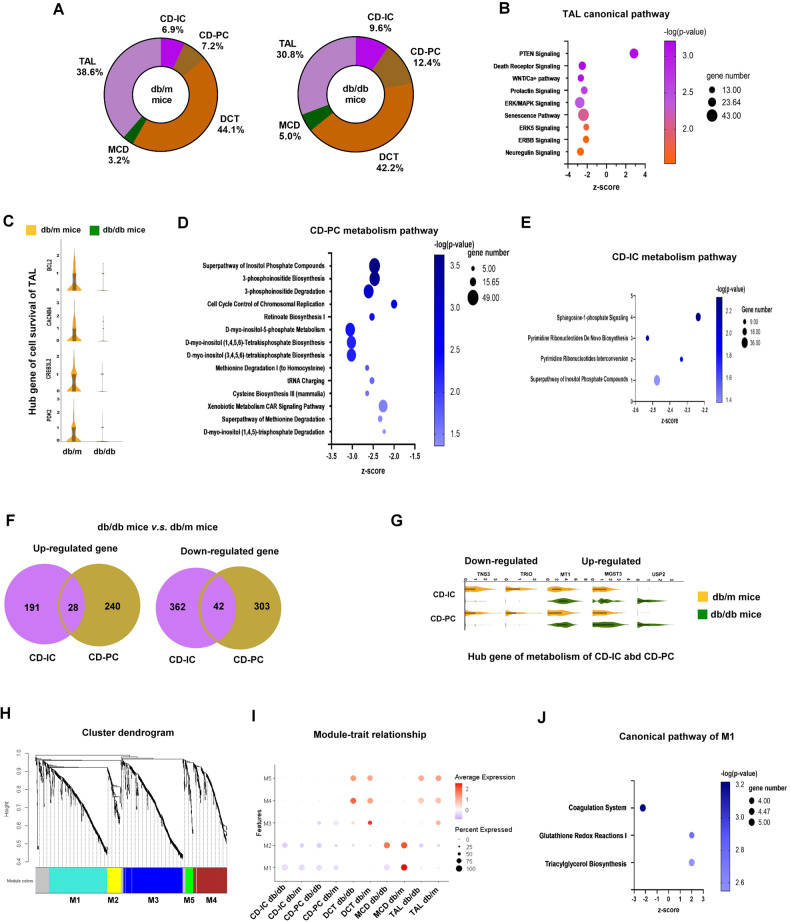
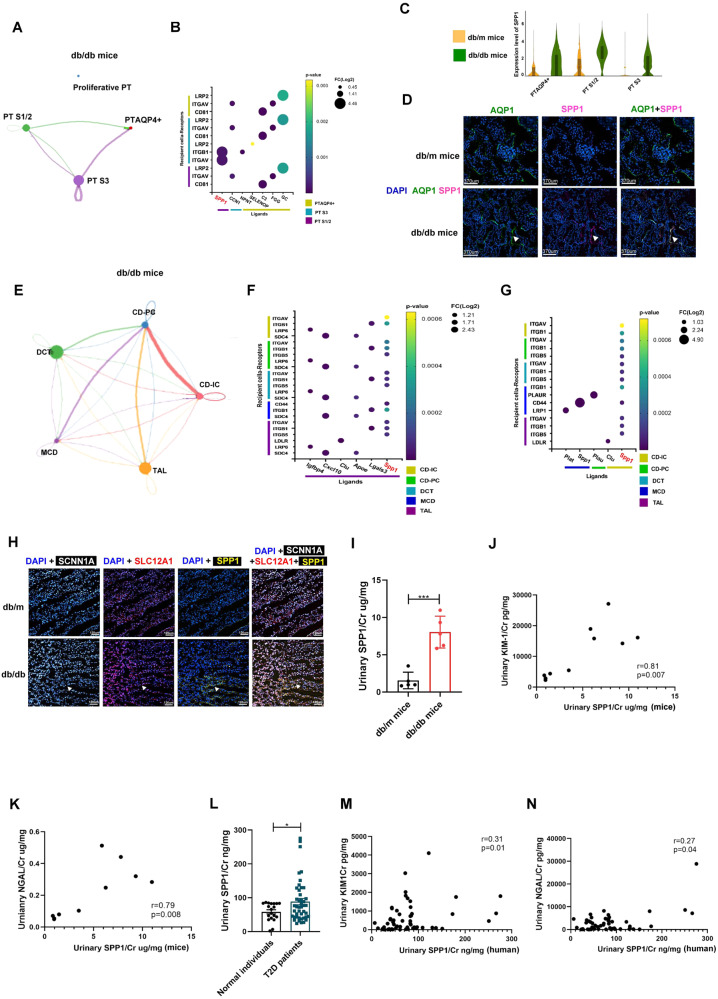
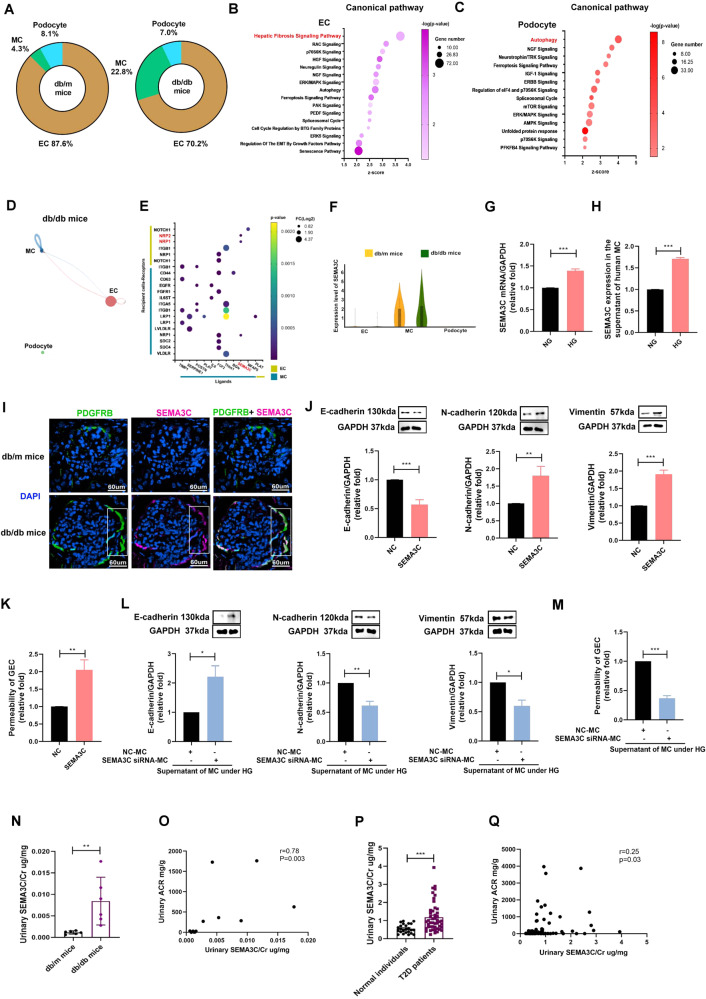
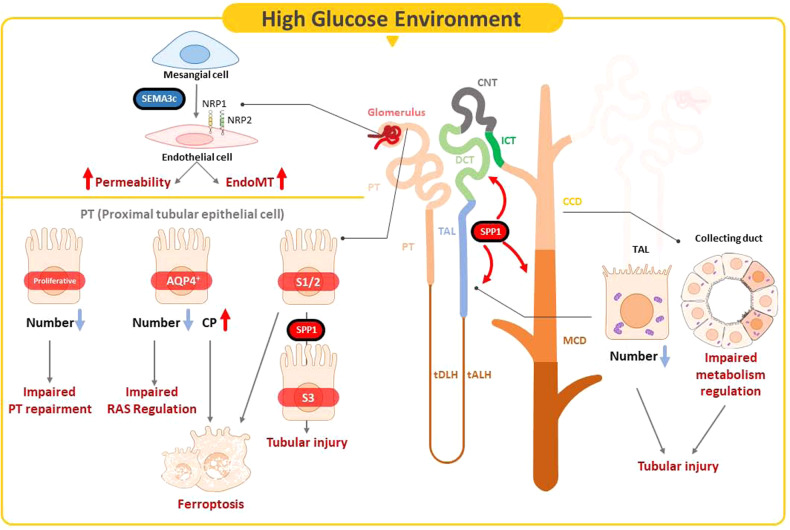
Diabetic kidney disease (DKD) is the leading cause of end-stage kidney disease, resulting in a huge socio-economic impact. Kidney is a highly complex organ and the pathogenesis underlying kidney organization involves complex cell-to-cell interaction within the heterogeneous kidney milieu. Advanced single-cell RNA sequencing (scRNA-seq) could reveal the complex architecture and interaction with the microenvironment in early DKD. We used scRNA-seq to investigate early changes in the kidney of db/m mice and db/db mice at the 14th week. Uniform Manifold Approximation and Projection were applied to classify cells into different clusters at a proper resolution. Weighted gene co-expression network analysis was used to identify the key molecules specifically expressed in kidney tubules. Information of cell-cell communication within the kidney was obtained using receptor-ligand pairing resources. In vitro model, human subjects, and co-detection by indexing staining were used to identify the pathophysiologic role of the hub genes in DKD. Among four distinct subsets of the proximal tubule (PT), lower percentages of proliferative PT and PT containing AQP4 expression (PTAQP4+) in db/db mice induced impaired cell repair activity and dysfunction of renin-angiotensin system modulation in early DKD. We found that ferroptosis was involved in DKD progression, and ceruloplasmin acted as a central regulator of the induction of ferroptosis in PTAQP4+. In addition, lower percentages of thick ascending limbs and collecting ducts with impaired metabolism function were also critical pathogenic features in the kidney of db/db mice. Secreted phosphoprotein 1 (SPP1) mediated pathogenic cross-talk in the tubular microenvironment, as validated by a correlation between urinary SPP1/Cr level and tubular injury. Finally, mesangial cell-derived semaphorin 3C (SEMA3C) further promoted endothelium-mesenchymal transition in glomerular endothelial cells through NRP1 and NRP2, and urinary SEMA3C/Cr level was positively correlated with glomerular injury. These data identified the hub genes involved in pathophysiologic changes within the microenvironment of early DKD.


Conflict of interest statement

The authors declare no competing interests.

Figures

Fig. 1
Fig. 1. Identification and characterization of cell clusters in the scRNA profile of kidney tissues from db/m mice and db/db mice.
A Periodic acid–Schiff (PAS) stain of the kidney of db/m mice and db/db mice at 14th week of age. B Flowchart of our experiment. C Blueprint of the scRNA-sequence of the kidney. D Cell clusters of the kidney of db/m mice and db/db mice. UMAP representation of the kidney of db/m mice and db/db mice. E Markers of cell cluster. F Cell number of each cell cluster.
Fig. 2
Fig. 2. Proliferative PT modulated renovation function in the kidney.
A Cell clusters of the PT of db/m mice and db/db mice. UMAP representation of the PT of db/m mice and db/db mice. B The specific markers of cell cluster of PT subtypes. C The percentage of each PT subtypes. D Weighted analysis of the expression of proliferative markers (TOP2A, MKi67) in four PT subtypes. E The kidneys of db/m mice and db/db mice were collected and staining by CODEX multiplexed tissue staining. PT (AQP1, green), proliferative PT (MKi67, red), DAPI (blue). Scale bars, 120 μm. ▲ (proliferative PT).
Fig. 3
Fig. 3. PTAQP4+ modulated RAS and ferroptosis play a pathophysiologic role in PT microenvironment of DKD.
A WGCNA analysis of transcriptome of PT subtypes of mice. Each leaf (vertical line) in the dendrogram corresponds to a gene. B Module-trait relationship based on WGCNA analysis of PT subtypes of mice. C The network of module 1 of the WGCNA analysis. D Violin plot of AGT in PT subtypes of db/m and db/db mice. E The kidneys of db/m mice and db/db mice were collected and staining by CODEX Multiplexed Tissue Staining. PT (AQP1, green), PTAQP4+ (AQP4, yellow), AGT (pink), DAPI (blue). Scale bars, 180 μm. ▲ (triple stain of AQP1, AQP4 and AGT). F KEGG pathway analysis of module 1 of the WGCNA analysis. G Violin plot of CP in PT subtypes of db/m and db/db mice. H Urinary CP/Cr levels in db/m (n = 6) and db/db mice (n = 6). I The relationship between urinary CP/Cr and albuminuria, NGAL/Cr and Kim-1/Cr in mice. The level of CP, NGAL and Kim-1 in the urine measured using ELISA. Levels of urinary albumin and Cr assessed using the immunoturbidimetric assay and the enzymatic method respectively. J KEGG pathway analysis of module 6 of the WGCNA analysis. K The kidneys of db/m mice and db/db mice were collected and staining by CODEX multiplexed tissue staining. PT (AQP1, red), GPX4 (yellow), and DAPI (blue). Scale bars, 120 μm. L The kidneys of a normal individual and a type 2 diabetes (T2D) patient were collected and staining by Immunohistochemistry (IHC) stain. PT (AQP1, green) and GPX4 (brown). Scale bars, 50 μm. ▲ (double stain of GPX4 and AQP1). The bar graph represents the mean ± S.E.M. *p < 0.05, **p < 0.01, ***p < 0.001 by Student’s t test, and p-value of correlation was analyzed by Spearman analysis.
Fig. 4
Fig. 4. The decreased number of TAL and dysregulated metabolism in CDs in early DKD.
A The percentage of the five tubular cells. B Canonical pathway of the gene of TAL of db/db mice compared to db/m mice. C Violin plot of the hub gene related to cell survival of TAL in db/m and db/db mice. D, E Canonical pathway related to metabolism regulation of CD-PC and CD-IC of db/db mice compared to db/m mice. F Venn diagram of the up-regulated and down-regulated hub genes between CD-IC and CD-PC of violin plot of db/db mice compared to db/m mice. G Up-regulated and down-regulated genes in CD-IC and CD-PC. H WGCNA analysis of five tubules. Each leaf (vertical line) in the dendrogram corresponds to a gene. I Module-trait relationship. J Canonical pathway of module 1 of the WGCNA analysis.
Fig. 5
Fig. 5. SPP1 modulates the communication within PT subtypes and distal tubules in early DKD.
A, B The interaction among four PT subtypes in db/db mice. C Violin plot of SPP1 among PT subtype between db/m and db/db mice. D The kidneys of db/m mice and db/db mice were collected and staining by CODEX Multiplexed Tissue Staining. PT (AQP1, green), SPP1 (pink), and DAPI (blue). Scale bars, 370 μm. ▲ (double stain of SPP1 and AQP1). E The interaction among TAL, DCT, CD-IC, CD-PC and MCD in db/db mice. F The communication between TAL and other five types of kidney tubules in db/db mice. G The communication of MCD, CD-IC and CD-PC with other five types of kidney tubules in db/db mice. H The kidneys of db/m mice and db/db mice were collected and staining by CODEX multiplexed tissue staining. TAL (SLC12A1, red), CD-IC (SCNN1A, white), SPP1 yellow), and DAPI (blue) were indicated by the white arrow. Scale bars, 120 μm. ▲ (Triple stain of SPP1, SCNN1A, and SLC12A1). I Urinary SPP1/Cr levels in db/m (n = 6) and db/db mice (n = 6). J, K The relationship between urinary SPP1 and Kim-1/Cr and NGAL/Cr in mice. L Urinary SPP1/Cr levels in 24 normal individuals and 48 T2D patients. M, N The relationship between urinary SPP1 and Kim-1/Cr and NGAL/Cr in human. The level of SPP1, NGAL and Kim-1 in the urine measured using ELISA. Levels Cr assessed using the enzymatic method. J The level of SPP1 in the urine measured using ELISA. The bar graph represents the mean ± S.E.M. *p < 0.05, **p < 0.01, ***p < 0.001 by Student’s t test, and p-value of correlation was analyzed by Spearman analysis.
Fig. 6
Fig. 6. MC-secreted SEMA3C regulated the cross-talk of glomerulus microenvironment of early DKD.
A The percentage of glomerular cells. B, C Canonical pathway of the gene of EC and podocyte of db/db mice compared to db/m mice. D, E The interaction within glomerulus in db/db mice. F Violin plot of SEMA3C in MC, EC and podocyte of db/m and db/db mice. G mRNA expression of SEMA3C in MC treated with NG and HG for 48 h measured by qRT-PCR (n = 3). H SEMA3C protein expression in the supernatant of MC treated with NG (5.5 mM) and HG (25 mM) for 48 h measured by ELISA. I The kidneys of db/m mice and db/db mice were collected and staining by CODEX Multiplexed Tissue Staining. MC (PDGFRB, green), SEMA3C (pink), and DAPI (blue). Scale bars, 60 μm. J E-cadherin, N-cadherin and vimentin expression in GECs treated with SEMA3C (10 ng/ml) for 48 h using western blotting (n = 3). K Permeability of GECs treated with SEMC3C (10 ng/ml) for 48 h using transendothelial permeability assay (n = 3). L MC was transfected with SEMA3C siRNA (20 nM) or NC (20 nM) for 24 h, and then treated under HG condition for 48 h. GEC was cultured with the supernatant of HG-treated MC for 48 h. E-cadherin, N-cadherin and vimentin expression in cultured GECs using western blotting (n = 3). M Permeability of cultured GECs using transendothelial permeability assay (n = 3). N Urinary SEMA3C/Cr levels in db/m (n = 6) and db/db mice (n = 6). O The relationship between urinary SEMA3C/Cr levels and urinary ACR in mice. P Urinary SEMA3C/Cr levels in 24 normal individuals and 48 T2D patients. Q The relationship between urinary SEMA3C/Cr levels and urinary ACR in human. The level of SEMA3C in the urine measured using ELISA. Urine albumin was measured using the immunoturbidimetric assay. Levels Cr assessed using the enzymatic method. The bar graph represents the mean ± S.E.M. *p < 0.05, **p < 0.01, ***p < 0.001 by Student’s t test or ANOVA followed by the post hoc test with Tukey’s correction, and p-value of correlation was analyzed by Spearman analysis.
Fig. 7
Fig. 7. Illustration of the mechanism of the hub gene contributing to the pathogenesis of early DKD.
In early DKD, lower percentages of proliferative PT and PTAQP4+ induced impaired cell repair activity and dysfunction of RAS modulation. CP acted as a central regulator of the induction of ferroptosis in PTAQP4+. Lower percentages of TAL and CD with impaired metabolism function were pathogenic features. SPP1 mediated pathogenic cross-talk in the tubular microenvironment. MC-derived SEMA3C further promoted endothelium-mesenchymal transition in GEC through NRP1 and NRP2 pathway.

References

    1. Cho NH, Shaw JE, Karuranga S, Huang Y, da Rocha Fernandes JD, Ohlrogge AW, et al. IDF Diabetes Atlas: Global estimates of diabetes prevalence for 2017 and projections for 2045. Diabetes Res Clin Pr. 2018;138:271–81. doi: 10.1016/j.diabres.2018.02.023. - DOI - PubMed
    1. Guariguata L, Whiting DR, Hambleton I, Beagley J, Linnenkamp U, Shaw JE. Global estimates of diabetes prevalence for 2013 and projections for 2035. Diabetes Res Clin Pr. 2014;103:137–49. doi: 10.1016/j.diabres.2013.11.002. - DOI - PubMed
    1. Du C, Ren Y, Li G, Yang Y, Yan Z, Yao F. Single cell transcriptome helps better understanding crosstalk in diabetic kidney disease. Front Med (Lausanne) 2021;8:657614. doi: 10.3389/fmed.2021.657614. - DOI - PMC - PubMed
    1. Shalek AK, Satija R, Shuga J, Trombetta JJ, Gennert D, Lu D, et al. Single-cell RNA-seq reveals dynamic paracrine control of cellular variation. Nature. 2014;510:363–9. doi: 10.1038/nature13437. - DOI - PMC - PubMed
    1. Gawad C, Koh W, Quake SR. Single-cell genome sequencing: current state of the science. Nat Rev Genet. 2016;17:175–88. doi: 10.1038/nrg.2015.16. - DOI - PubMed

Publication types