. 2023 Jul 17;14(1):4261.
doi: 10.1038/s41467-023-40036-z.

A renal YY1-KIM1-DR5 axis regulates the progression of acute kidney injury

Affiliations

A renal YY1-KIM1-DR5 axis regulates the progression of acute kidney injury

Chen Yang et al. Nat Commun. .

Abstract

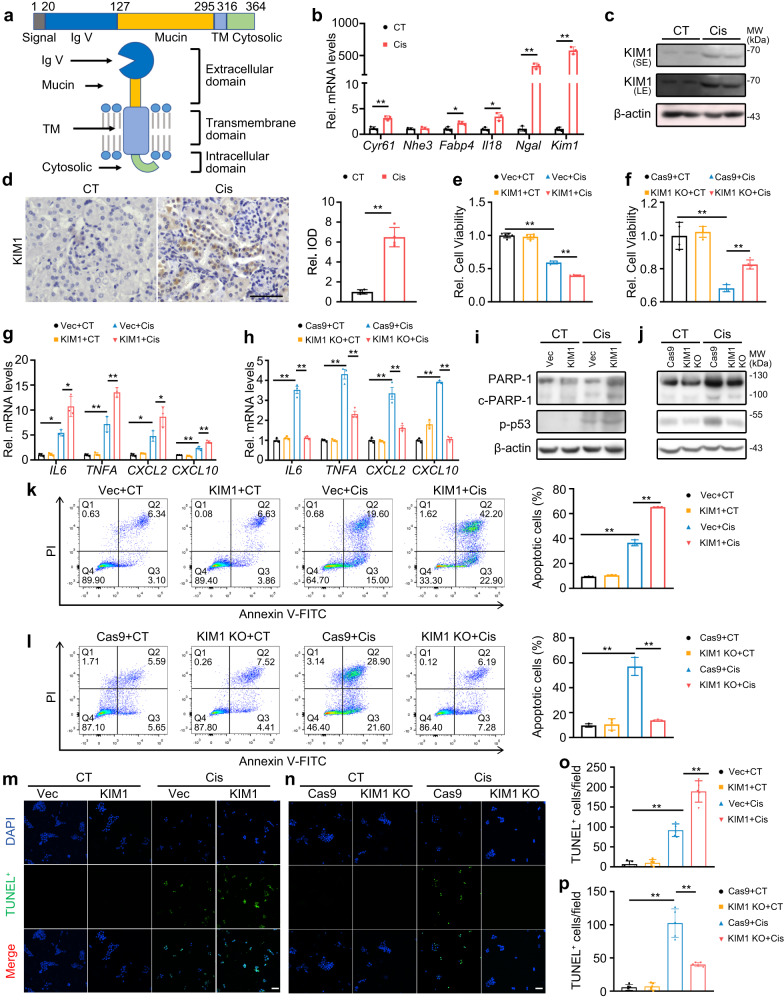
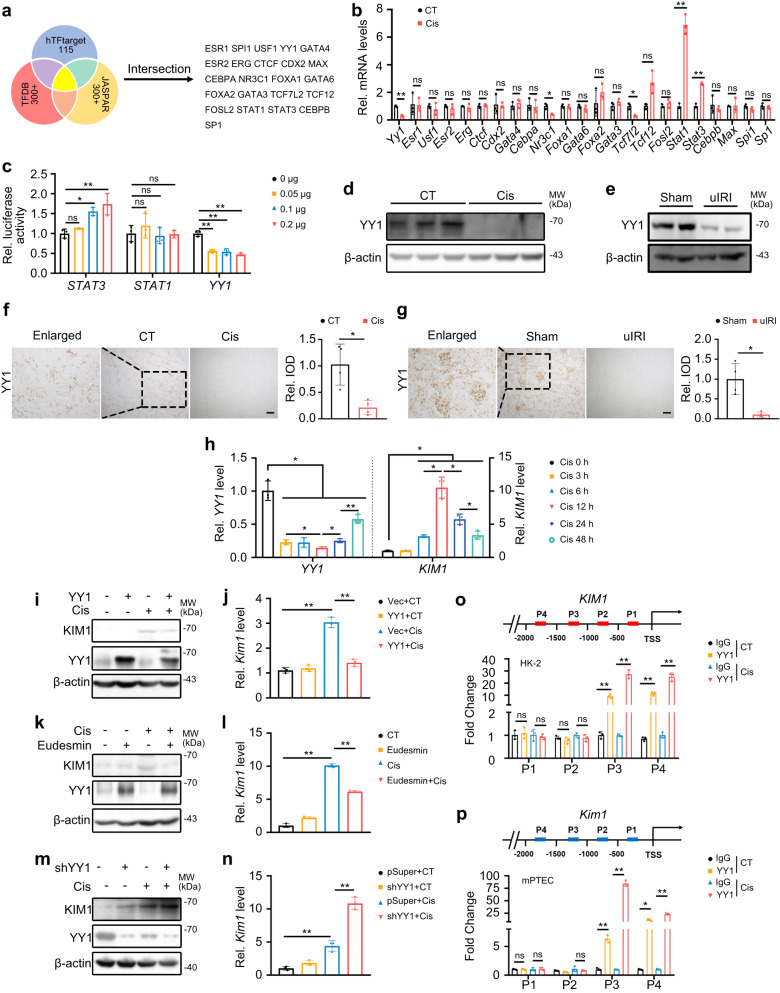
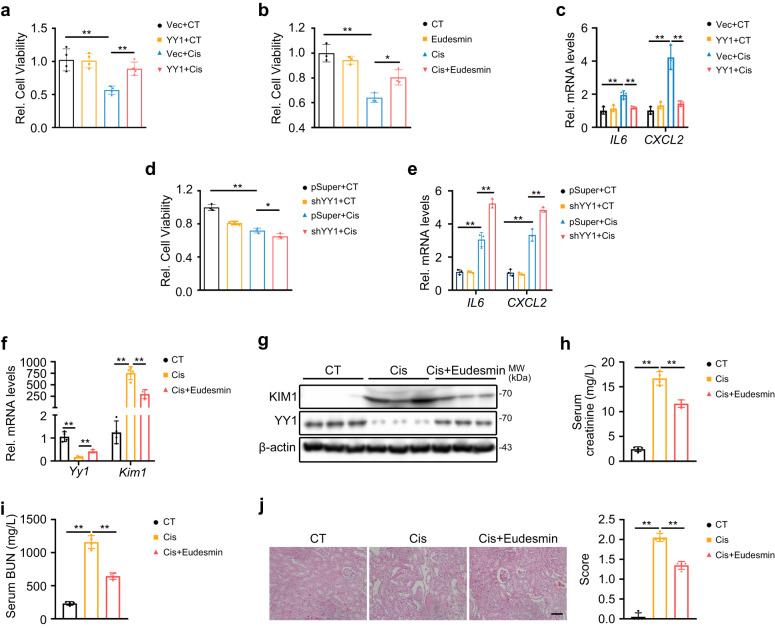
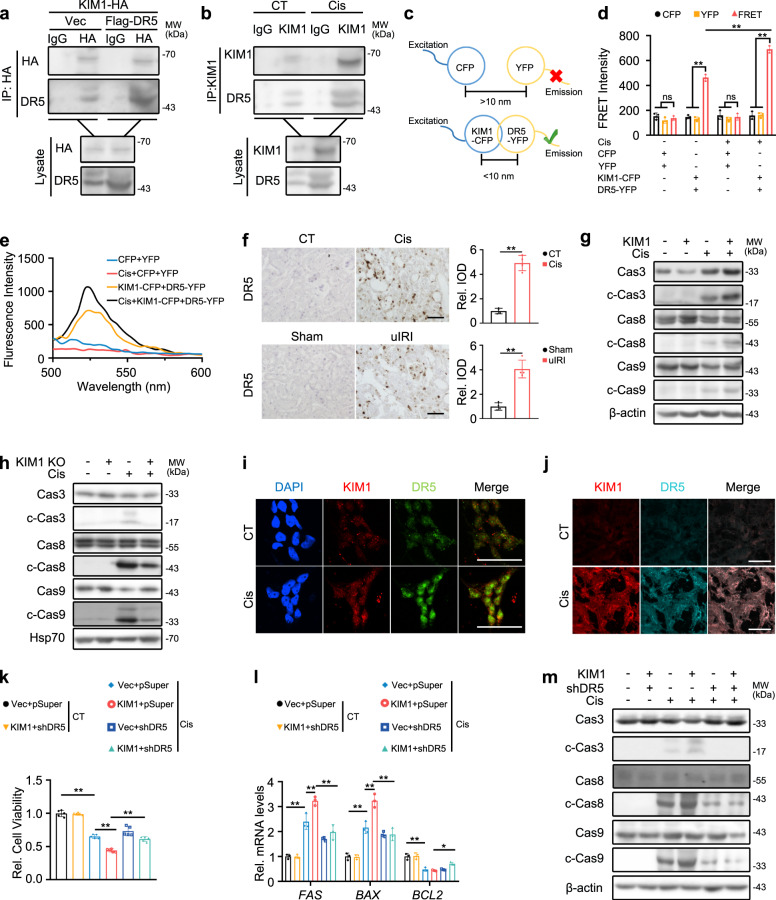
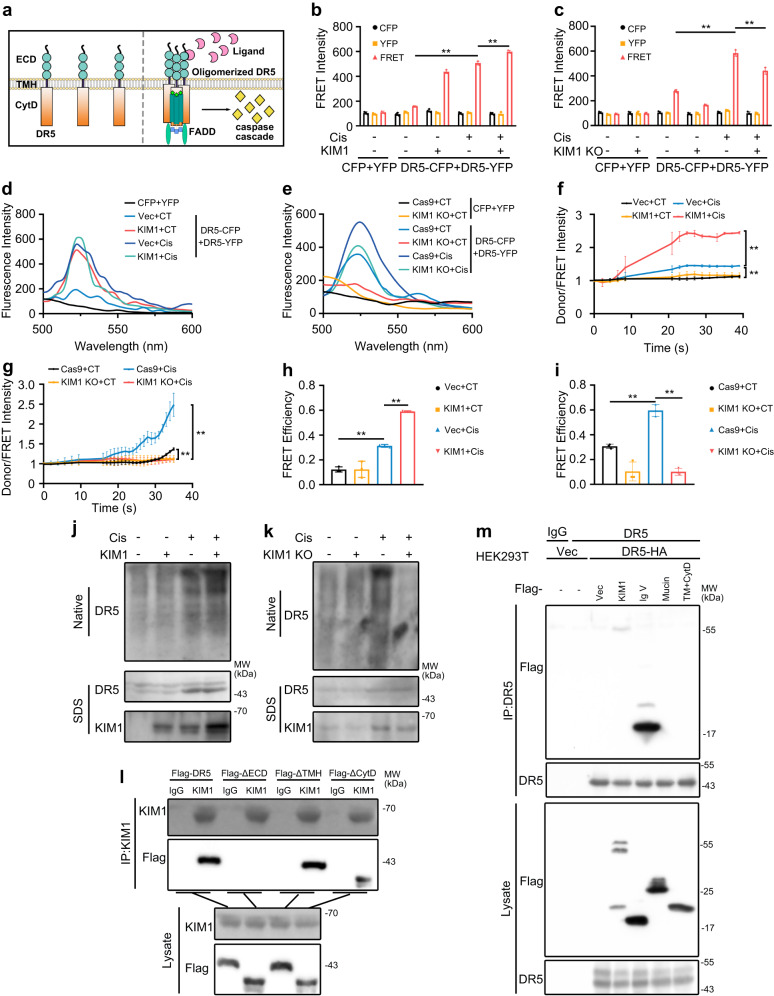
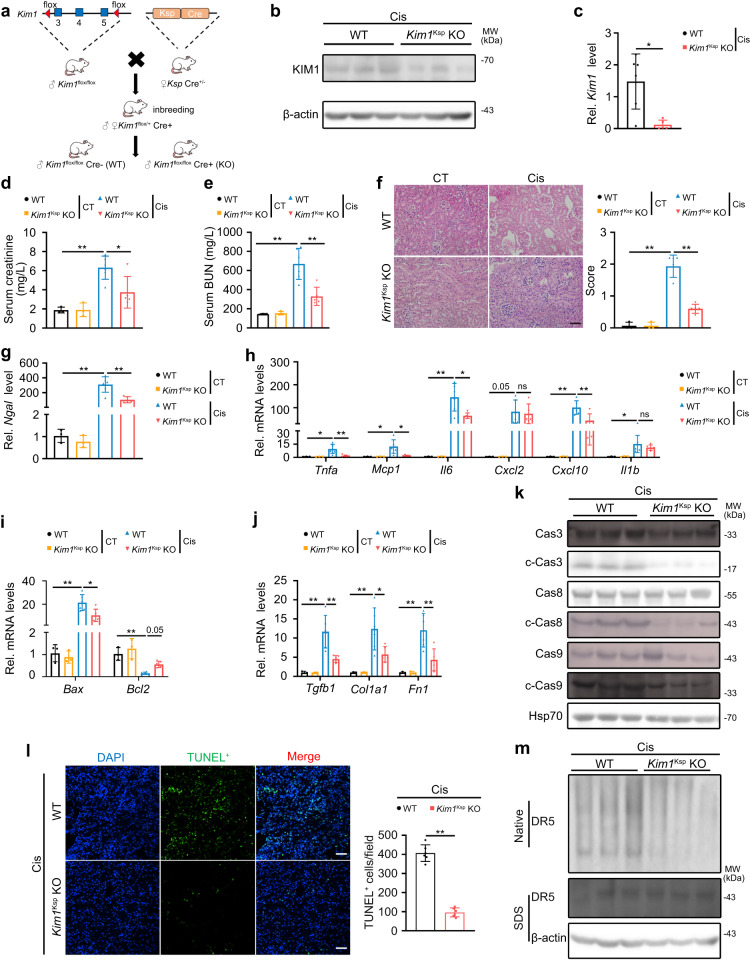
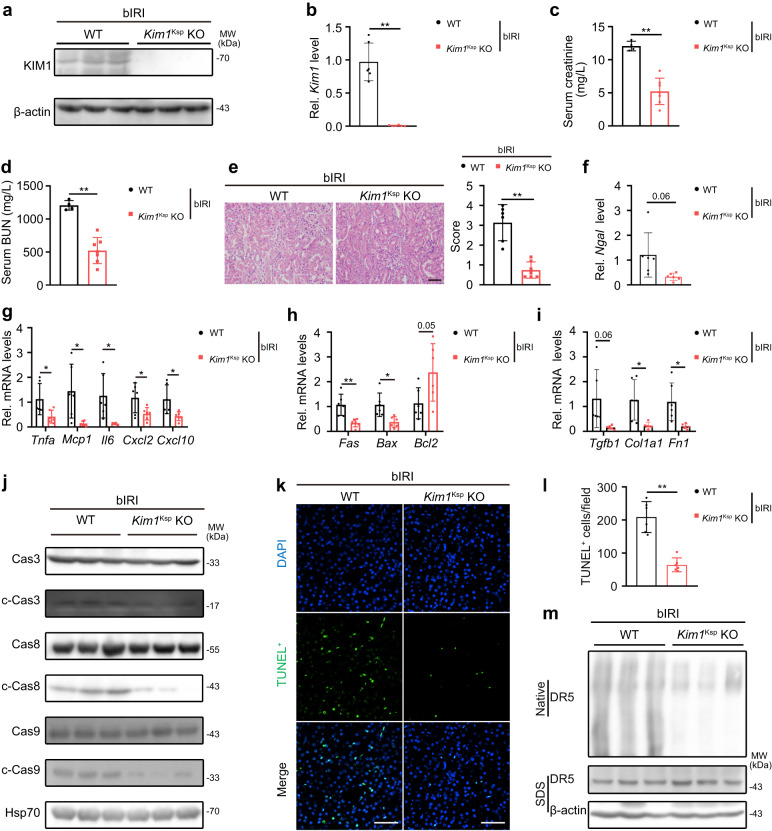
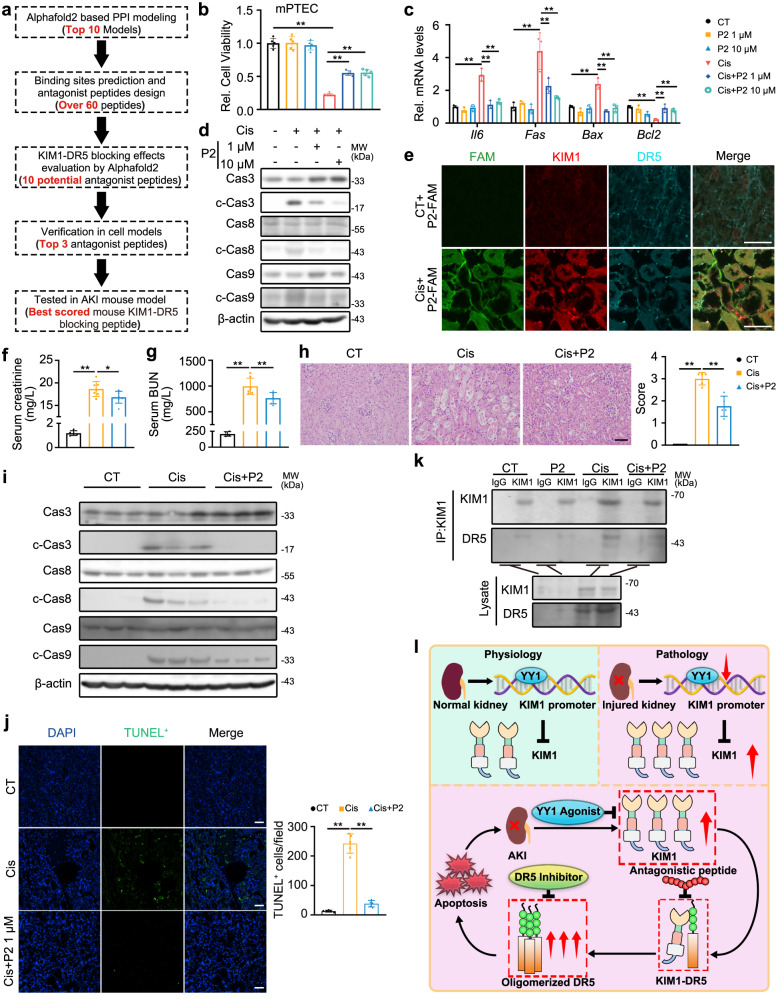
Acute kidney injury (AKI) exhibits high morbidity and mortality. Kidney injury molecule-1 (KIM1) is dramatically upregulated in renal tubules upon injury, and acts as a biomarker for various renal diseases. However, the exact role and underlying mechanism of KIM1 in the progression of AKI remain elusive. Herein, we report that renal tubular specific knockout of Kim1 attenuates cisplatin- or ischemia/reperfusion-induced AKI in male mice. Mechanistically, transcription factor Yin Yang 1 (YY1), which is downregulated upon AKI, binds to the promoter of KIM1 and represses its expression. Injury-induced KIM1 binds to the ECD domain of death receptor 5 (DR5), which activates DR5 and the following caspase cascade by promoting its multimerization, thus induces renal cell apoptosis and exacerbates AKI. Blocking the KIM1-DR5 interaction with rationally designed peptides exhibit reno-protective effects against AKI. Here, we reveal a YY1-KIM1-DR5 axis in the progression of AKI, which warrants future exploration as therapeutic targets.


Conflict of interest statement

The authors declare no competing interests.

Figures

Fig. 1
Fig. 1. KIM1 is dramatically upregulated in a cisplatin-induced AKI model, aggravating inflammation and apoptosis in renal tubular epithelial cells.
a Structural scheme of KIM1 domains. Signal signal peptide, Mucin mucin-containing domain, TM transmembrane domain, CytD cytosolic domain. b mRNA levels of several AKI biomarkers in mouse kidneys at Day 3 after cisplatin (Cis) injury. n = 3 mice per group. c KIM1 protein level in mouse kidneys at Day 3 after cisplatin injury. LE/SE, long/short exposure. n = 2 mice per group, each experiment was repeated at least three times independently with similar results obtained. d Representative images of immunohistochemistry staining and quantitation of KIM1 in renal sections at Day 3 after cisplatin injury. Scale bar, 50 μm. n = 4 mice per group. e, f MTT assays to assess the effects of KIM1 overexpression (e) or knockout (f) in HK-2 cells with or without 24 h cisplatin stress. Vec, pRK-5′Flag; KIM1, pRK-5′Flag-KIM1; Cas9, lenti-CRISPR/Cas9; KIM1 KO, lenti-CRISPR/Cas9-based KIM1 knockout. CT, without cisplatin treatment. n = 4-5 biological samples per group, each experiment was repeated at least three times independently with similar results obtained. g, h qPCR of inflammatory factors with KIM1 overexpression (g) or knockout (h) in HK-2 cells with or without 24 h cisplatin stress. n = 3 biological samples per group, each experiment was repeated at least three times independently with similar results obtained. i, j Western blots of apoptotic molecules in KIM1 overexpression (i) or knockout (j) HK-2 cells with or without 24 h cisplatin stress. Each experiment was repeated at least three times independently with similar results obtained. k, l Representative flow cytometry results and quantitative data of KIM1 overexpression (k) or knockout (l) HK-2 cells with or without 24 h cisplatin stress analyzed by Annexin V-FITC and propidium iodide (PI) labeling. Quantitative data provided the average and standard deviation from three independent experiments (percentage of apoptotic cells was calculated by Annexin-V positive cells (Q2 + Q3)). Each experiment was repeated at least three times with representative results shown. mp Representative images of TUNEL assay (m, n) and quantitative results (o, p) in KIM1 overexpression (m, o) or knockout (n, p) groups. n = 5 biological samples per group, each experiment was repeated at least three times independently with similar results obtained. Scale bar, 50 μm. Data shown as mean ± SD. Two-tailed unpaired Student’s t-test was used for two experimental groups and one-way ANOVA for multiple experimental groups without adjustment. *P < 0.05; **P < 0.01. Exact P values are provided in Source Data.
Fig. 2
Fig. 2. YY1 is downregulated in AKI models and negatively regulates KIM1 expression.
a Database screening for potential KIM1-regulating transcriptional factors (TFs). 23 TFs were found from intersections of JASPAR, Human TFDB and hTFtarget. b qPCR of 23 potential KIM1-regulating TFs in mouse kidneys at Day 3 after cisplatin (Cis) injury. n = 3 mice per group. c Luciferase reporter assays for the effects of STAT3, STAT1 and YY1 on KIM1 promoters. STAT3, pRK-5′Flag-STAT3; STAT1, pRK-5′Flag-STAT1; YY1, pRK-YY1-3′HA; n = 3 biological samples per group, each experiment was repeated at least three times independently with similar results obtained. d, e Protein levels of YY1 in mouse kidneys at Day 3 after cisplatin injury (d) or e unilateral renal ischemia-reperfusion injury (uIRI). d n = 3 mice per group, e Sham, non-injury control, uIRI, unilateral ischemia-reperfusion injury. n = 2 mice per group. Each experiment was repeated at least three times independently with similar results obtained. f, g Representative images of YY1 immunohistochemistry staining with quantitative analysis at Day 3 after cisplatin injury (f) or uIRI (g). Scale bar, 50 μm. Integrated option density, IOD. (f, g) n = 4 mice per group. h qPCR of YY1 and KIM1 in HK-2 cells treated with 5 μg/mL cisplatin for the indicated time. n = 3 biological samples per group, each experiment was repeated at least three times independently with similar results obtained. Two-tailed unpaired Student’s t-test was used. i, j Protein (i) and mRNA (j) levels of KIM1 in YY1 overexpression groups with/without 24 h cisplatin. Vec, pRK-3′HA; YY1, pRK -YY1-3′HA. i Each experiment was repeated at least three times independently with similar results obtained; j n = 3 biological samples per group, each experiment was repeated at least three times independently with similar results obtained. k, l Protein (k) and mRNA (l) levels of KIM1 in 1 μM eudesmin-treated groups with/without 24 h cisplatin. k Each experiment was repeated at least three times independently with similar results obtained; l n = 3 biological samples per group, each experiment was repeated at least three times independently with similar results obtained. m, n Protein (m) and mRNA (n) levels of KIM1 in YY1 knockdown groups with/without 24 h cisplatin. Vec, pRK-3′HA; YY1, pRK-YY1-3′HA; pSuper, pSuper backbone; shYY1, pSuper-shYY1. CT, without cisplatin treatment. m Each experiment was repeated at least three times independently with similar results obtained; n n = 3 biological samples per group, each experiment was repeated at least three times independently with similar results obtained. o, p ChIP assays in HK-2 cells (o) and mPTECs (p) with/without 24 h cisplatin. o, p n = 3 biological samples per group, each experiment was repeated at least three times independently with similar results obtained. p Two-tailed unpaired Student’s t-test was used. Data shown as mean ± SD. Two-tailed unpaired Student’s t-test was used for two experimental groups, and one-way ANOVA for multiple experimental groups without adjustment. *P < 0.05; **P < 0.01; ns no significance. Exact P values are provided in Source Data.
Fig. 3
Fig. 3. YY1 protects against AKI in vitro and in vivo.
a, b MTT assays to assess the effects of YY1 overexpression (a) and eudesmin treatment (b) in HK-2 cells with/without 24 h cisplatin (Cis). Vec, pRK-3′HA; YY1, pRK-YY1-3′HA; CT, without cisplatin treatment. a n = 4 biological samples per group; b n = 3 biological samples per group, each experiment was repeated at least three times independently with similar results obtained. c qPCR analysis of IL6 and CXCL2 expression in YY1 overexpressing groups with/without 24 h cisplatin. n = 3 biological samples per group, each experiment was repeated at least three times independently with similar results obtained. d, e MTT assays (d) and qPCR analysis of IL6 and CXCL2 expression (e) in YY1 knockdown HK-2 cells with/without cisplatin injury. Vec, pRK-3′HA; YY1, pRK-YY1-3′HA; pSuper, pSuper backbone; shYY1, pSuper-shYY1; CT, without cisplatin treatment. d, e n = 3 biological samples per group, each experiment was repeated at least three times independently with similar results obtained. d two-tailed unpaired Student’s t-test was used. f, g qPCR (f) and Western blots (g) of KIM1 and YY1 in mouse kidneys at Day 3 after cisplatin injury with/without eudesmin treatment. f n = 4 mice per group; two-tailed unpaired Student’s t-test was used. g n = 3 mice per group. hj Serum creatinine level (h), serum urea nitrogen level (i) and pathological score (j) in mice at Day 3 after cisplatin injury with/without eudesmin treatment. Scale bar, 50 μm. hj n = 4 mice per group; Data shown as mean ± SD. Two-tailed unpaired Student’s t-test was used for two experimental groups, and one-way ANOVA for multiple experimental groups without adjustment. *P < 0.05; **P < 0.01. Exact P values are provided in Source Data.
Fig. 4
Fig. 4. KIM1 binds DR5 and activates its downstream caspase cascade.
a Co-IP of KIM1 and DR5 in HK-2 cells transfected with the plasmids indicated. The Co-IP assay was performed using anti-HA or respective IgG, while IgG served as the negative control. For IP and lysate groups, HA-tagged KIM1 was detected with anti-HA antibody, and Flag-DR5 was detected using anti-DR5 antibody. b Co-IP of KIM1 and DR5 with/without 24 h cisplatin (Cis) in HK-2 cells. The Co-IP assay used anti-KIM1 or respective IgG. For IP and lysate groups, KIM1 was detected with anti-KIM1 antibody, and DR5 was detected using anti-DR5 antibody. a, b Each experiment was repeated at least three times independently with similar results obtained. c Schematic diagram for FRET assay design. The excitation/emission wavelength of CFP and YFP are 435/485 nm and 485/525 nm respectively. Emission of CFP excites YFP that causes FRET detected at 525 nm; FRET signal is detectable when KIM1-CFP binds DR5-YFP ( < 10 nm). d, e Quantitative FRET signal between KIM1-CFP and DR5-YFP with/without 24 h cisplatin using fluorescence scan (d), and wavelength scan (e). d CFP, pRK-5′Flag-CFP; YFP, pRK-5′Flag-YFP; KIM1-CFP, pRK-5′Flag-KIM1-CFP; DR5-YFP, pRK-5′Flag-KIM1-YFP; n = 3 biological samples per group, each experiment was repeated at least three times independently with similar results obtained. e Each experiment was repeated at least three times independently with similar results obtained. f Representative images of immunohistochemical staining and quantitative results of DR5 on mouse renal sections at Day 3 after cisplatin injury or unilateral renal ischemia-reperfusion injury (uIRI). Scale bar, 50 μm. n = 4 mice per group. g, h The effects of KIM1 overexpression (g) and knockout (h) on activation of DR5 downstream caspase cascade after 24 h cisplatin injury in HK-2 cells. KIM1 KO, lenti-CRISPR/Cas9-based KIM1 knockout. g, h Each experiment was repeated at least three times independently with similar results obtained. i, j Representative images of KIM1 and DR5 staining in HK-2 cells with/without 24 h cisplatin (i) and mouse renal sections at Day 3 after cisplatin injury (j). Scale bars, 50 μm. i n = 3 biological samples per group; j n = 4 mice per group. km MTT assay (k), mRNA levels of apoptotic molecules (l), and DR5 downstream caspase cascade (m) in HK-2 cells, with KIM1 overexpression and/or DR5 knockdown, with/without 24 h cisplatin. k n = 5 biological samples per group; l Vec, n = 3 biological samples per group. Each experiment was repeated at least three times independently with similar results obtained. m Each experiment was repeated at least three times independently with similar results obtained. pRK-5′Flag; KIM1, pRK-5′Flag-KIM1; pSuper, pSuper backbone; ShDR5, pSuper-ShDR5; CT, without cisplatin treatment; data shown as mean ± SD. Two-tailed unpaired Student’s t-test was used for two experimental groups, and one-way ANOVA for multiple experimental groups without adjustment. *P < 0.05; **P < 0.01; ns no significance. Exact P values are provided in Source Data.
Fig. 5
Fig. 5. KIM1 promotes the multimerization of DR5.
a Structural scheme of DR5 multimerization and downstream signaling pathways. Under physiological conditions, DR5 exists as a monomer, upon injury, ECD binds ligand and multimerizes, subsequently recruiting FADD with its CytD and activating the downstream caspase cascade. ECD ectodomain, CytD cytoplasmic domain. be Quantitative FRET indicating the effect of KIM overexpression (b) or knockdown (c) on DR5 multimerization following cisplatin injury, using fluorescence (d) or wavelength (e) scan. CFP, pRK-5′Flag-CFP; YFP, pRK-5′Flag-YFP; DR5-CFP, pRK-5′Flag-DR5-CFP; DR5-YFP, pRK-5′Flag-DR5-YFP; Vec, pRK-5′Flag; KIM1, pRK-5′Flag-KIM1; Cas9, lenti-CRISPR/Cas9; KIM1 KO, lenti-CRISPR/Cas9-based KIM1 knockout. b, c n = 3 biological samples per group, each experiment was repeated at least three times independently with similar results obtained; d, e Each experiment was repeated at least three times independently with similar results obtained. f, g Fluorescence redistribution after photobleaching (FRAP) assays showed the effect of KIM1 overexpression (f) or knockdown (g) on DR5 multimerization. f, g n = 3 biological samples per group, each experiment was repeated at least three times independently with similar results obtained. h, i FRET efficiency in KIM1 overexpression (h) or knockdown (i) groups. h, i n = 3 biological samples per group, each experiment was repeated at least three times independently with similar results obtained. j, k The effect of KIM1 overexpression (j) or knockdown (k) on the formation of higher-order DR5 oligomers detected using native PAGE electrophoresis. Each experiment was repeated at least three times independently with similar results obtained. l KIM1 bound to the ECD domain of DR5. A Co-IP assay was performed using anti-KIM1 or non-specific IgG as the negative control. For IP and lysate groups, KIM1 was detected with anti-KIM1 antibody; WT and mutants of DR5-Flag were detected using an anti-Flag antibody. m DR5 bound to the Ig V domain of KIM1. Co-IP assay was performed using anti-KIM1 or respective IgG, while IgG served as the negative control. For IP and lysate groups, Flag-tagged KIM1 truncations were detected with an anti-Flag antibody, and DR5-HA was detected using an anti-DR5 antibody. l, m Each experiment was repeated at least three times independently with similar results obtained. Data are shown as mean ± SD. Two-tailed unpaired Student’s t-test was used for two experimental groups, and one-way ANOVA for multiple experimental groups without adjustment. **P < 0.01. Exact P values are provided in Source Data.
Fig. 6
Fig. 6. Renal tubular specific knockout of Kim1 relieves cisplatin-induced AKI.
a Generation of renal tubular specific Kim1 knockout mouse. Wildtype, WT, Kim1flox/flox; renal tubular specific Kim1 knockout, Kim1Ksp KO. b, c KIM1 protein levels (b) and mRNA levels (c) in the kidneys of WT and Kim1Ksp KO mice at Day 3 after cisplatin injury (Cis). b n = 3 mice per group; c n = 6 for WT group and n = 5 for Kim1Ksp KO group, respectively. df Serum creatinine level (d), serum urea nitrogen level (e), and pathological score (f) of WT and Kim1Ksp KO mice at Day 3 after cisplatin injury. Scale bar, 50 μm. df n = 3 for WT and Kim1Ksp KO in CT groups; n = 6 for WT and n = 5 for Kim1Ksp KO in Cis-injured groups, respectively. gj qPCR analysis of Ngal (g), inflammatory factors (h), apoptotic molecules (i) and fibrotic factors (j) in the kidneys of WT and Kim1Ksp KO mice at Day 3 after cisplatin injury. gj n = 3 for WT and Kim1Ksp KO in CT groups; n = 6 for WT and n = 5 for Kim1Ksp KO in Cis-injured groups, respectively. k Western blots of caspase cascade proteins from cisplatin-injured kidneys of WT and Kim1Ksp KO mice. n = 3 mice per group. l Representative images for TUNEL assay with quantitative results of cisplatin-injured WT and Kim1Ksp KO mice. Scale bar, 50 μm. n = 6 mice per group. m Native PAGE electrophoresis of DR5 oligomers in cisplatin-injured WT and Kim1Ksp KO mice. n = 3 mice per group. Data shown as mean ± SD. Two-tailed unpaired Student’s t-test was used for two experimental groups, and one-way ANOVA for multiple experimental groups without adjustment. *P < 0.05; **P < 0.01; ns no significance. Exact P values are provided in Source Data.
Fig. 7
Fig. 7. Renal tubular specific knockout Kim1 relieves bilateral ischemia-reperfusion-induced AKI.
a, b Western blots (a) and qPCR (b) of KIM1 levels in the kidneys of WT and Kim1Ksp KO mice at Day 1 after bilateral renal ischemia-reperfusion injury (bIRI). a n = 3 mice per group; b n = 6 mice per group. c, e Serum creatinine level (c), serum urea nitrogen level (d), and pathological score (e) of WT and Kim1Ksp KO mice at Day 1 after bIRI. Scale bar, 50 μm. c, d n = 4 for WT group and n = 7 for Kim1Ksp KO group, respectively. e n = 6 for WT group and n = 7 for Kim1Ksp KO group, respectively. fi qPCR of Ngal (f), inflammatory factors (g), apoptotic molecules (h) and fibrotic factors (i) in the kidneys of WT and Kim1Ksp KO mice at Day 1 after bIRI. f, i n = 6 mice group. j Western blots of caspase cascade proteins from the kidneys of WT and Kim1Ksp KO mice at Day 1 after bIRI. n = 3 mice per group. k, l Representative images of TUNEL assay (k) with quantitative results (l) of WT and Kim1Ksp KO mice at Day 1 after bIRI. Scale bar, 50 μm. k, l n = 6 mice per group. m Native PAGE electrophoresis of DR5 oligomers in WT and Kim1Ksp KO mice at Day 1 after bIRI. n = 3 mice group. Data shown as mean ± SD. Two-tailed unpaired Student’s t-test was used for two experimental groups, and one-way ANOVA for multiple experimental groups without adjustment. *P < 0.05; **P < 0.01. Exact P values are provided in Source Data.
Fig. 8
Fig. 8. Rationally designed antagonistic peptides block KIM1-DR5 interaction and protect against AKI.
a Workflow for the screen and evaluation of antagonistic peptides blocking KIM1-DR5 interaction. b MTT assays showed the protective effects of peptide P2 in 24 h cisplatin-injured mPTECs (mouse Primary Renal Tubular Epithelial Cells). n = 5 biological samples per group, each experiment was repeated at least three times independently with similar results obtained. c, d qPCR analysis of apoptotic molecules (c) and caspase cascade activation (d) in 24 h cisplatin-injured TCMK-1 cells treated with/without peptide P2. c n = 3 biological samples per group, each experiment was repeated at least three times independently with similar results obtained; d Each experiment was repeated at least three times independently with similar results obtained. e Representative images of P2-5’(6)-FAM (green), KIM1(red) and DR5 (cyan) on mouse renal sections at Day 3 after cisplatin injury. Scale bar, 50 μm. n = 3 mice per group. f, g Serum creatinine (f) and urea nitrogen levels (g) of peptide P2 treated mice at Day 3 after cisplatin injury. f, g n = 5 for CT group and n = 7 for Cis-injured and Cis+P2 groups, respectively. h Representative H&E staining and pathological score of P2 treated mice at Day 3 after cisplatin injury. Scale bar, 50 μm. n = 5 mice per group. i Western blots of caspase cascade of peptide P2 treated mice at Day 3 after cisplatin injury. n = 3 mice per group. j Representative images of TUNEL assay with quantitative results on renal sections of peptide P2 treated mice at Day 3 after cisplatin injury. n = 5 mice per group. k Co-immunoprecipitation showed reduced endogenous KIM1-DR5 interaction in the kidneys of peptide P2 treated mice at Day 3 after cisplatin injury. Co-IP was performed using anti-KIM1 or respective IgG, while IgG served as the negative control. For IP and lysate groups, KIM1 was detected using an anti-KIM1 antibody, and DR5 was detected using an anti-DR5 antibody. Pooled samples from 4 mice were used for each lane. l Working model of YY1-KIM1-DR5 axis. Under physiological conditions, YY1 binds to the promoter of KIM1 and represses its expression. In injured kidney, downregulated YY1 up-regulates KIM1, which binds DR5 and promotes its multimerization, activates the downstream caspase cascade, leads to apoptosis and aggravates AKI. Data shown as mean ± SD. Two-tailed unpaired Student’s t-test was used for two experimental groups, and one-way ANOVA for multiple experimental groups without adjustment. *P < 0.05; **P < 0.01. Exact P values are provided in Source Data.

Similar articles

Cited by

References

    1. Zuk A, Bonventre JV. Acute kidney injury. Annu. Rev. Med. 2016;67:293–307. doi: 10.1146/annurev-med-050214-013407. - DOI - PMC - PubMed
    1. Ronco C, Bellomo R, Kellum JA. Acute kidney injury. Lancet. 2019;394:1949–1964. doi: 10.1016/S0140-6736(19)32563-2. - DOI - PubMed
    1. Han WK, et al. Kidney injury molecule-1 (KIM-1): a novel biomarker for human renal proximal tubule injury. Kidney Int. 2002;62:237–244. doi: 10.1046/j.1523-1755.2002.00433.x. - DOI - PubMed
    1. Ichimura T, et al. Kidney injury molecule-1 (KIM-1), a putative epithelial cell adhesion molecule containing a novel immunoglobulin domain, is up-regulated in renal cells after injury. J. Biol. Chem. 1998;273:4135–4142. doi: 10.1074/jbc.273.7.4135. - DOI - PubMed
    1. Bailly V, et al. Shedding of kidney injury molecule-1, a putative adhesion protein involved in renal regeneration. J. Biol. Chem. 2002;277:39739–39748. doi: 10.1074/jbc.M200562200. - DOI - PubMed

Publication types

Substances