. 2023 Sep;34(3):418-436.
doi: 10.1007/s00335-023-10008-1. Epub 2023 Jul 17.

AgAnimalGenomes: browsers for viewing and manually annotating farm animal genomes

Affiliations

AgAnimalGenomes: browsers for viewing and manually annotating farm animal genomes

Deborah A Triant et al. Mamm Genome. 2023 Sep.

Abstract

Current genome sequencing technologies have made it possible to generate highly contiguous genome assemblies for non-model animal species. Despite advances in genome assembly methods, there is still room for improvement in the delineation of specific gene features in the genomes. Here we present genome visualization and annotation tools to support seven livestock species (bovine, chicken, goat, horse, pig, sheep, and water buffalo), available in a new resource called AgAnimalGenomes. In addition to supporting the manual refinement of gene models, these browsers provide visualization tracks for hundreds of RNAseq experiments, as well as data generated by the Functional Annotation of Animal Genomes (FAANG) Consortium. For species with predicted gene sets from both Ensembl and RefSeq, the browsers provide special tracks showing the thousands of protein-coding genes that disagree across the two gene sources, serving as a valuable resource to alert researchers to gene model issues that may affect data interpretation. We describe the data and search methods available in the new genome browsers and how to use the provided tools to edit and create new gene models.


Conflict of interest statement

The authors have no relevant financial or non-financial interests to disclose.

Figures

Fig. 1
Fig. 1
Accessing JBrowse using the JBrowse/Apollo pulldown menu. When you select a genome in the pulldown menu, JBrowse opens, but may not display any tracks. The top number line shows the coordinates along the entire chromosome, with the range of the current view shown in the red rectangle. The lower number line displays the coordinates of the current view. Arrows for panning left and right and buttons for zooming in and out are above the browser, to the left of the pulldown menu that lists the chromosomes in descending order by length. The search box can take coordinates, gene symbols, and identifiers. Tracks for visualization are selected using the Select tracks button, circled in red on figure left. The login button circled on figure right provides access to the Apollo annotation tool
Fig. 2
Fig. 2
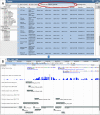
The Faceted Track Selector for the S. scrofa browser. The panel on the left provides the tracks organized by Data Type, Organ System, and Bioproject. Selecting one or more categories filters the table on the right. The table can be further filtered by entering text in the box shown circled in red on the figure. Tracks are selected by clicking the small boxes on the left of the table
Fig. 3
Fig. 3
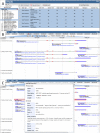
A The Faceted Track Selector after selecting the Gene Prediction category on the left to filter for gene prediction tracks. B Sus scrofa JBrowse view after selecting Ensembl and RefSeq gene tracks. Exons are color coded, with non-coding exons (UTR and noncoding transcripts) in dark blue and CDS in three possible colors, depending on the reading frame (only two colors are shown here). C Right clicking a transcript allows you view details
Fig. 4
Fig. 4
Sus scrofa JBrowse view showing a split/merge example in the Ensembl and RefSeq Protein-Coding Discordant tracks. This locus has one RefSeq gene but two different Ensembl genes. Below the gene prediction tracks is a RNAseq Combined Density track, with the cursor hovering over the label (circled in red on the figure) of an experiment that shows signals at the exons of interest, particularly those in the RefSeq gene that are not present in Ensembl. The experiment near the bottom of the combined track also provides information at the discordant exons
Fig. 5
Fig. 5
Sus scrofa JBrowse view showing different visualizations of the same RNAseq data
Fig. 6
Fig. 6
A Sus scrofa Faceted Track Selector showing the selection of all the tracks for an individual tissue sample by searching with the Specimen Tag (circled in red on the figure). B Sus scrofa JBrowse view showing FAANG data tracks for RNAseq, peaks for ATAC-seq, ChIP-seq peaks (histone marks and CTCF-binding sites), and predicted chromatin states
Fig. 7
Fig. 7
Apollo interface. On the right is the Information Panel with tabs for Annotations, Tracks, Ref Sequence (chromosome ids), and BLAT Search. The Information Panel can be hidden by clicking the red X in the upper left of the panel (circled in red on the figure). When the Information Panel is closed, the red X is replaced by a green-bordered square icon that can be used to re-open the Information Panel. The JBrowse Select tracks button that provides access to the Faceted Track Selector can be toggled on by clicking the list icon right below the red X (circled in red on the figure)
Fig. 8
Fig. 8
Apollo view showing annotations in the Editing Area. The top transcript has been right clicked to show a pop-up menu with editing options. Clicking the transcript also highlights the exon edges of the selected transcript and all matching exon edges of other transcripts in red. The Undo, Redo, and Show History options are available at the bottom of the menu and are not shown here
Fig. 9
Fig. 9
Validating a splice site. A A zoomed-in view with the cursor (circled in red) in the lower number line. The red line is lined up with the edge of the exon. The coordinate of the exon edge is shown in the rectangle next to the cursor (circled in red on the figure). B The information available when right-clicking the junction highlighted in red. Notice that the start coordinate of the junction is one higher than the coordinate of the exon edge shown in the upper panel, so this splice site is confirmed by 79 RNAseq reads (shown as the Score in the information panel)

References

    1. Altschul SF, Gish W, Miller W, Myers EW, Lipman DJ. Basic local alignment search tool. J Mol Biol. 1990;215:403–410. - PubMed
    1. Andersson L, Archibald AL, Bottema CD, Brauning R, Burgess SC, Burt DW, Casas E, Cheng HH, Clarke L, Couldrey C, Dalrymple BP, Elsik CG, Foissac S, Giuffra E, Groenen MA, Hayes BJ, Huang LS, Khatib H, Kijas JW, Kim H, Lunney JK, McCarthy FM, McEwan JC, Moore S, Nanduri B, Notredame C, Palti Y, Plastow GS, Reecy JM, Rohrer GA, Sarropoulou E, Schmidt CJ, Silverstein J, Tellam RL, Tixier-Boichard M, Tosser-Klopp G, Tuggle CK, Vilkki J, White SN, Zhao S, Zhou H, Consortium F. Coordinated international action to accelerate genome-to-phenome with FAANG, the Functional Annotation of Animal Genomes project. Genome Biol. 2015;16:57. - PMC - PubMed
    1. Bickhart DM, Rosen BD, Koren S, Sayre BL, Hastie AR, Chan S, Lee J, Lam ET, Liachko I, Sullivan ST, Burton JN, Huson HJ, Nystrom JC, Kelley CM, Hutchison JL, Zhou Y, Sun J, Crisà A, Ponce de León FA, Schwartz JC, Hammond JA, Waldbieser GC, Schroeder SG, Liu GE, Dunham MJ, Shendure J, Sonstegard TS, Phillippy AM, Van Tassell CP, Smith TP. Single-molecule sequencing and chromatin conformation capture enable de novo reference assembly of the domestic goat genome. Nat Genet. 2017;49:643–650. - PMC - PubMed
    1. Buels R, Yao E, Diesh CM, Hayes RD, Munoz-Torres M, Helt G, Goodstein DM, Elsik CG, Lewis SE, Stein L, Holmes IH. JBrowse: a dynamic web platform for genome visualization and analysis. Genome Biol. 2016;17:66. - PMC - PubMed
    1. Bush SJ, McCulloch MEB, Muriuki C, Salavati M, Davis GM, Farquhar IL, Lisowski ZM, Archibald AL, Hume DA, Clark EL. Comprehensive transcriptional profiling of the gastrointestinal tract of ruminants from birth to adulthood reveals strong developmental stage specific gene expression. G3 (bethesda) 2019;9:359–373. - PMC - PubMed

Publication types

LinkOut - more resources