. 2024 Feb;20(2):142-150.
doi: 10.1038/s41589-023-01385-4. Epub 2023 Jul 17.

Molecular mechanism of GPCR spatial organization at the plasma membrane

Affiliations

Molecular mechanism of GPCR spatial organization at the plasma membrane

Gabriele Kockelkoren et al. Nat Chem Biol. 2024 Feb.

Abstract

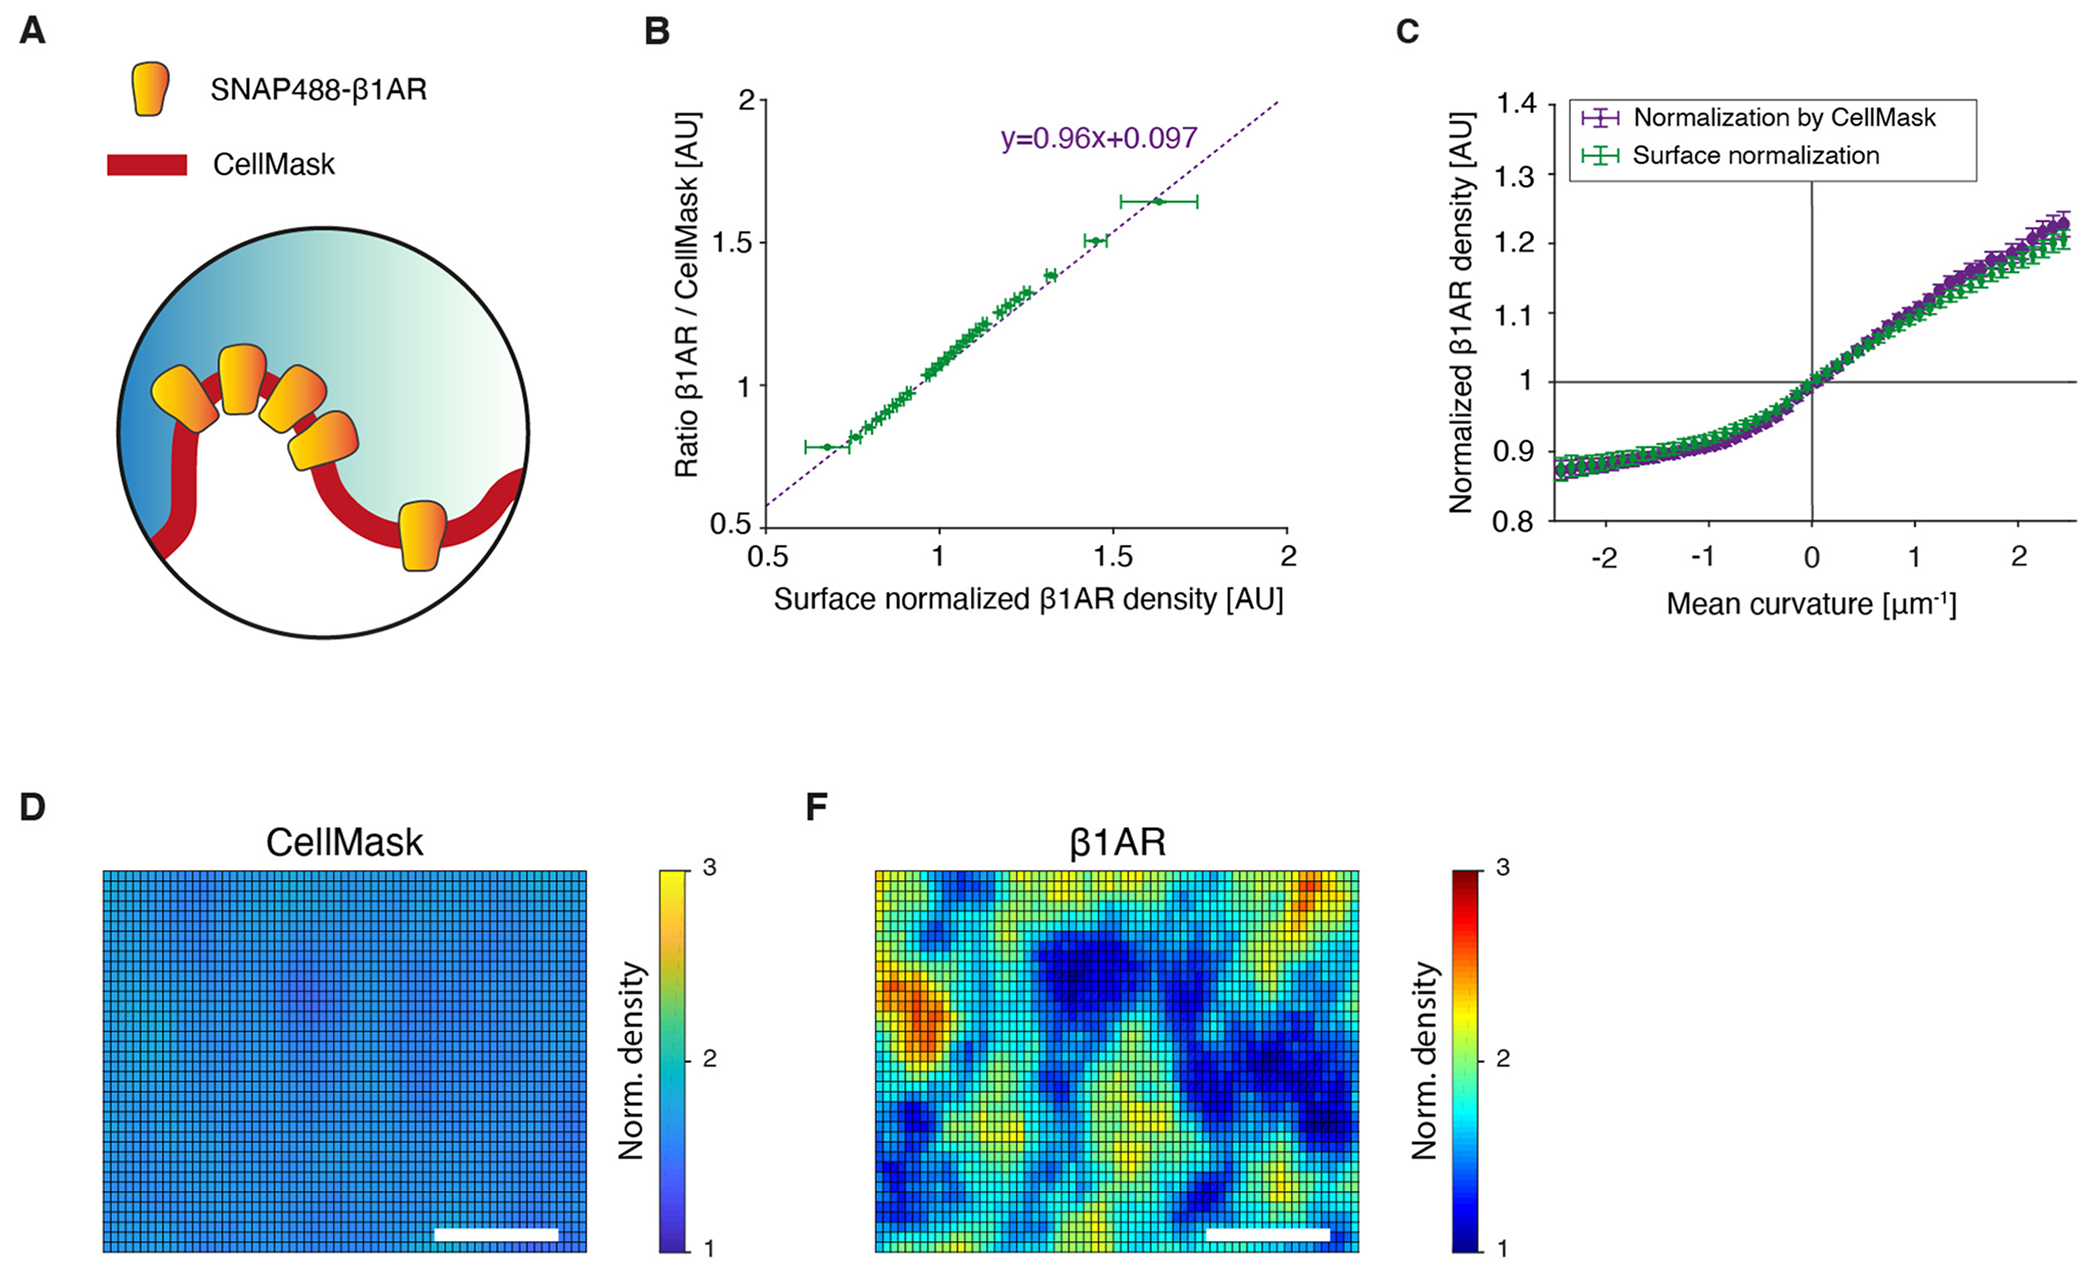
G-protein-coupled receptors (GPCRs) mediate many critical physiological processes. Their spatial organization in plasma membrane (PM) domains is believed to encode signaling specificity and efficiency. However, the existence of domains and, crucially, the mechanism of formation of such putative domains remain elusive. Here, live-cell imaging (corrected for topography-induced imaging artifacts) conclusively established the existence of PM domains for GPCRs. Paradoxically, energetic coupling to extremely shallow PM curvature (<1 µm-1) emerged as the dominant, necessary and sufficient molecular mechanism of GPCR spatiotemporal organization. Experiments with different GPCRs, H-Ras, Piezo1 and epidermal growth factor receptor, suggest that the mechanism is general, yet protein specific, and can be regulated by ligands. These findings delineate a new spatiomechanical molecular mechanism that can transduce to domain-based signaling any mechanical or chemical stimulus that affects the morphology of the PM and suggest innovative therapeutic strategies targeting cellular shape.


Conflict of interest statement

Competing interests

D.S. is the founder of Atomos Biotech. The other authors declare no competing interests.

Figures

Extended Data Fig. 1 |
Extended Data Fig. 1 |. 2D imaging reveals spatial variations in receptor intensity that cannot be interpreted without knowledge of membrane topography.
(a) Cartoons represent slices of membranes imaged by Confocal or total internal fluorescence microscopy (TIRF) microscopy at the cell equator and at the plasma membrane. (b-f) Confocal (b-d) or TIRF (e-f) images of the PM of HEK293 labeled with CellMask and/or the β1AR. All images are recorded at the basolateral membrane except for (B, left) which is at the cell equator. The heterogenous spatial distribution of intensity (domains of high/low intensity) cannot be interpreted as variations in density without prior knowledge of membrane topography. Color scales show relative intensity that is the smallest intensity present in an image is set to black. Data is from nR = 3. Scalebars: (a-b) 5 μm; (c-f) 500 nm.
Extended Data Fig. 2 |
Extended Data Fig. 2 |. Quantitative measurement of protein density and diffusion requires imaging of the plasma membrane in 3D to correct topography-induced artifacts that mimic the appearance of domains in 2D projections.
(a) Experimentally obtained 3D membrane topography map of the adherent plasma membrane of a HEK293 cell labelled using CellMask. (b) Illustration of the confocal excitation volume approximated by an ellipsoid (blue) and the tangent plane at a given point of the membrane (green). The membrane tilt angle θ (angle between the tangent plane and the imaging plane) varies between 0° – 90°. (c) The cross-sectional area between the plane and the ellipsoid (approximated by a cylinder for simplicity) scales with sec θ and serves as an approximation of the tilted membrane area. (d) An experimentally obtained 3D membrane topography map to which we computationally assigned a uniform receptor density. (e) Because of the variations in membrane topography, the 2D density projection of the uniform surface in (d) erroneously suggests the existence of GPCR domains. (f) For similar reasons, the spatially homogeneous diffusion in the 3D surface shown in (d) will erroneously appear to be heterogeneous if projected in 2D. (g) Schematic illustrations. The 2D projection of a uniformly labelled membrane of varying topography (left), can erroneously produce the appearance of 2D domains that cannot a priori be distinguished from bona fide variations in membrane label density (right).
Extended Data Fig. 3 |
Extended Data Fig. 3 |. Generation of high-accuracy topography maps of plasma membranes of living cells.
(a, b) Fluorescence confocal image of HEK293 cells over-expressing SNAP-β1AR (a) and CellMask (b). Data β1AR is representative for nR = 4 and CellMask nR = 3 replicates. (c, d) Illustration of an XZY-stack (dz/dx/dy = 30 nm) of the highlighted area in (a) and (b). (e, f) Extracted intensity Z-profiles of linescans highlighted in (c) and (d) and their corresponding Gaussian fits overlaid. The axial position of the Gaussian peak corresponds to the Z position of the membrane, whereas the amplitude of the Gaussian peak is proportional to protein or Cellmask density. (g) Topography map of the area shown in (b) reconstructed from the Z positions obtained from the Gaussian fitting. Color scale represents membrane height in nm. (h) Local error weighted quadric fit for a 3 × 3 pixel, 90 nm x 90 nm, area using Eq. 1 (see Methods). (i) Recovered denoised topography map after quadric fitting (same area as in (g)). Color scale is same as for (g). (j) Localization precision of the Z positions calculated as the error weighed standard error of the mean for a 3 × 3 pixel, 90 nm × 90 nm, area of the denoised topography maps. (k) Topography map from (i) overlaid with mean membrane curvature.
Extended Data Fig. 4 |
Extended Data Fig. 4 |. Validation of recovered membrane topography with RICM.
(a) Illustration of the overlay of the reconstructed 3D topography map with the corresponding reflection interference contrast microscopy (RICM) image. (b) Recovered membrane height plotted against RICM intensity for a representative cell. As predicted analytically by theoretical models, membrane height and RICM intensity follow a co-sinusoidal relationship (see Methods). The correlation is fitted with a cosine function that describes the data with an R2 = 0.999. Data is binned using an error weighted rolling average (10 ± 10 nm) with error bars showing the s.e.m. Data is from N = 59,280 data points, n = 20 cells from n = 4 experiments.
Extended Data Fig. 5 |
Extended Data Fig. 5 |. Assessment of the membrane stability over time imaged with confocal.
(a) Individual XZ images of a HEK293 acquired on the same location at t = 1 s, 20 s, 40 s, and 60 s. Initial visual assessment shows no major membrane displacements occur over t = 60 s. Data is from nR = 3. Scale bar, 1.5 μm. (b) Map of recovered Z position for the same XZ-slice imaged over t = 60 s. (c) To assess membrane movement, a rolling standard deviation is calculated for each X position over a 6 s time window showing the average movement of the membrane within the time frame needed for stable imaging. This allows us to image the spatial distribution of temporal nanoscopic displacements across the plasma membrane. (d) Histograms of rolling standard deviation (grey) as calculated in (c) and accuracy of retrieving Z position of the membrane after quadric fitting (pink) (Extended Data Fig. 7e). (e) Median membrane displacement, that is median of the rolling standard deviation, as a function of the applied time window. Pink dashed line represents the median accuracy in retrieving the Z position of the membrane after quadric fitting. Error bars show s.d.
Extended Data Fig. 6 |
Extended Data Fig. 6 |. Validation of β1AR density by ratio-metric imaging with a cell membrane probe.
(a) Schematic of experimental approach. HEK293 cells express SNAP-β1AR and are labelled with SS488, while the membrane is labelled with CellMask DeepRed. (b) β1AR density normalized by recovered membrane surface area versus β1AR density normalized by CellMask intensity. The dashed purple line is a linear fit to the data. Data is shown as error-weighted bins with equal number of data points per bin. Error bars, s.e.m for y-axis and s.d. for x-axis. (c) Normalized β1AR density versus mean curvature. Recovery of normalized β1AR density by surface normalization (green) or by CellMask intensity (purple) results in the same density-curvature correlation. Data is binned using an error-weighted rolling average (0.1 ± 0.1 μm−1) with error bars showing s.e.m. Data is from n = 7 cells from n = 1 experiment. (d-e) 2D projection of topography-corrected and normalized density of CellMask and β1AR for the same region at the PM. CellMask density is uniform at the PM (d), whereas β1AR forms domains (e). Scalebar, 500 nm.
Extended Data Fig. 7 |
Extended Data Fig. 7 |. Neither high-density nor low-density actin zones associate with domains of well-defined topography or mean curvature.
(a) Actin intensity at the plasma membrane overlaid with boundaries of high- and low-density zones of actin. Scale bar, 500 nm. (b) Density map of normalized β1AR overlaid with the actin boundaries from (a). Domain 1 in (a) and (b) indicates a low-actin-density region that contains both β1AR-enriched and -depleted domains. (c) Colocalization analysis of high- and low-density zones of actin with β1AR-enriched and -depleted domains. The colocalization percentages are compared to those of randomized actin zones. Quantitative correlations between high-/low-density actin regions and β1AR density patterns were either statistically nonsignificant or had low significance (P = 0.06 n.s., P = 0.03). P values are calculated by a two-sided paired t test. Data are the mean ± s.d. for nC = 23, nR = 2. (d) Membrane topography overlaid with the actin boundaries from (a). High- and low actin density zones are not preferentially colocalizing with membrane peaks or valleys. (e) Mean curvature overlaid with actin boundaries from (a). There is no preferential overlap of high- and low actin zones with positive or negative curvatures. Overlays are representative for n = 23 cells and n = 2 experiments.
Extended Data Fig. 8 |
Extended Data Fig. 8 |. Activation by agonist induces clathrin redistribution from receptor-depleted domains to both receptor-enriched and -depleted domains.
(a) Representative XY micrographs of SNAP-β1AR (magenta) and pmKate2-clathrin (green) and a merge in HEK293 cells. (b-c) XZ micrograph of β1AR, clathrin and a merge. Clathrin colocalizes with depleted domains of β1AR (b), but not with β1AR-enriched domains in the apo state (c). (d-f) XZ micrographs of events of β1AR internalization via clathrin-mediated endocytosis (indicated by arrows) after addition of ISO. These events are removed in our image analysis pipeline for recovering membrane topography and GPCR density. For (b-f) β1AR is imaged in 3D STED (magenta), clathrin in confocal (green) and a merge is shown. (g-h) 2D projection of normalized clathrin (g) and β1AR density (h) in the apo state. Arrows indicate regions of clathrin colocalizing with β1AR-depleted and not with β1AR-enriched domains. (i-j) 2D projection of normalized clathrin (i) and β1AR density (j) after activation by ISO. Arrows indicate regions of clathrin colocalizing both with β1AR-enriched and -depleted domains, however β1AR-enriched and -depleted domains do not always colocalize with clathrin (arrow with asterisk). (k) Colocalization analysis of high-density clathrin regions with β1AR-enriched and -depleted domains before and after activation by isoproterenol (ISO). The colocalization percentages are compared to randomized clathrin zones. Under basal conditions, β1AR and clathrin were anticorrelated (P = 0.01), while after activation with the agonist ISO, clathrin colocalization with GPCR-enriched domains was not statistically significant (P = 0.65). P values are calculated by a two-sided paired t test. Data are mean ± s.d. for nC = 18, nR = 3. Scalebar, (a) 1 μm, (b-f) 200 nm, (g-j) 500 nm.
Extended Data Fig. 9 |
Extended Data Fig. 9 |. Changes in membrane topography, curvature and β1AR density after cell flattening with an agarose pad.
Change in height (a), mean membrane curvature (b) and β1AR density (c) calculated by subtracting the values after flattening from the values before flattening (Fig. 3c,e,g and d,f,h). (d) Quantification of absolute change in height after flattening with an agarose pad from data in (a). The red line indicates the average change in membrane height of 14.5 nm. (e) Comparison of histograms of mean curvature of unperturbed (blue) and flattened (orange) for a single, representative HEK293 cell. After flattening the width of the histogram is smaller compared to the unperturbed cells. (f) Histograms of normalized β1AR density before (blue) and after (orange) flattening of the same cell as in (e). Normalized density of compressed cells shifts towards unity and the width of the histogram decreases. Data is representative for n = 10 cells in n = 5 replicates.
Extended Data Fig. 10 |
Extended Data Fig. 10 |. Domains of H-Ras, Piezo1 and EGFR at the PM of live cells.
2D projection of H-Ras density (a), overlay of H-Ras density on super-resolved topography map (b) and mean curvature map (c) of membrane topography shown in (b). H-Ras-enriched domains are formed at negative shallow curvature (see also Fig. 5d). (d-f) 2D projection of Piezo1 density (d), overlay of Piezo1 density on super-resolved topography map (e) and mean curvature map (f). Piezo1-enriched domains have high contrast and strongly couple to positive shallow curvature (see Fig. 5e). (g-i) 2D projection of EGFR density (g), overlay of EGFR density on super-resolved topography map (h) and mean curvature map (i). EGFR density variations couple to positive shallow curvature and are similar to those of β1AR and other studied GPCRs (see Supplementary Fig. 23). Black arrows indicate examples of H-Ras-, Piezo1- and EGFR-enriched domains. Scalebar (a,d,g), 500 nm.
Fig. 1 |
Fig. 1 |. Topography-corrected imaging of β1AR density reveals PM domains.
a, Two-dimensional projection of topography-corrected and normalized β1AR density in the adherent PM of HEK293 cells; scale bar, 500 nm; AU, arbitrary units. b, Superresolution topography map of the area in a shown with 3D isotropic magnification. The inset shows nanoscopic variations (yellow on isotropic scale, blue zoomed-in y axis) in membrane height along the yellow row of pixels. Error bars show the s.e.m. c, Overlay of β1AR density in a onto the magnified topography map of b. The color scale is the same as in a. d, Calculated mean curvature overlaid on the magnified topography map of b. The two arrows in ad indicate two domains of similar density. e, Schematic of the approach for the colocalization analysis of GPCR domains and curvature. f, Colocalization analysis of β1AR-enriched domains with positive curvatures and β1AR-depleted domains with negative curvatures. Colocalization percentages are compared to the colocalization of randomized domains. Data are shown as mean ± s.d. for number of cells (nC; nC = 16) and number of biological replicates (nR; nR = 4). Hereafter, P values are calculated by two-sided paired t-tests unless otherwise stated. A P value of >0.05 is not significant (NS), while a P value of <0.05 is significant. The combined P value was computed by two-tailed Fisher’s method (d.f. = 1).
Fig. 2 |
Fig. 2 |. MFT reveals energetic coupling to shallow mean membrane curvature as the molecular mechanism of domain formation.
a, Schematic illustration of MFT model. The inactive conformation of β1AR (PDB ID: 2YCW) is embedded in a curved model membrane whose interleaflet lipid asymmetry mimics that of the PM; PSM, sphingomyelin; DOPS, dioleoylphosphatidylserine; Chol, cholesterol; DOPE, dioleoylphosphatidylethanolamine. b, Theoretical MFT prediction of β1AR potential energy versus mean membrane curvature (green) and MFT prediction of β1AR density versus mean curvature (yellow). All energies and densities are normalized to 0 mean curvature. c, Schematic of the pixel-by-pixel correlation between β1AR density and mean curvature. d, Experimentally obtained normalized density versus mean curvature for β1AR (yellow) and CellMask (gray). Data are binned using an error-weighted rolling average (0.1 ± 0.1 μm−1) with error bars showing s.e.m. For β1AR, nC = 16 and nR = 4. For CellMask, nC = 20 and nR = 3. e, Theoretically calculated contributions of the three types of interactions to receptor density. The contributions have been normalized to 0 mean curvature. The excluded volume term dominates at high negative mean curvature (orange arrow). The energetic coupling of β1AR-enriched and β1AR-depleted domains with shallow mean curvature (purple arrows) is predominantly due to the hydrophobic term. f, Theoretically calculated β1AR density versus mean curvature for three different bilayers: the asymmetric bilayer with five different lipid species (yellow circles and used for calculations in b), the symmetric bilayer with five different lipid species (blue circles) and the symmetric POPC bilayer (gray circles). g, Structure of the β1AR (purple) overlaid with the outline of its surface representation (left). Color maps of the hydrophobic contribution to receptor sorting (normalized to 0 mean curvature) mapped onto the volume view of β1AR at single-residue resolution are shown in the middle and on the right. The receptor is embedded in a membrane with a mean curvature of −1.33 μm−1 (middle) and +1.33 μm−1 (right). With negative curvature (left), red residues in the inner leaflet indicate an increase in the hydrophobic contribution, whereas blue residues in the outer leaflet show a decrease of the hydrophobic contribution to the overall curvature coupling. Gray arrows in the bilayer represent the compression/expansion of the intra- and extracellular leaflet as a direct consequence of membrane bending.
Fig. 3 |
Fig. 3 |. Nanoscopic modulation of PM curvature quantitatively regulates β1AR density.
a,b, Schematic illustration of flattening the adherent PM of all cells in a two-dimensional (2D) culture using an agarose pad. Imaging before (a) and after (b) flattening provides a quantitative, in situ high-throughput correlation of the distribution of nanoscopic changes in PM topography, PM mean curvature and β1AR density. c,d, PM height of the same area before (c) and after (d) flattening, respectively. e,f, Mean curvature of the same area before (e) and after (f) flattening. g,h, Normalized density of β1AR of the same area before (g) and after (h) flattening. Arrows indicate two GPCR-enriched domains before and after flattening; scale bar in ch, 500 nm. i,j, Histograms of the change in mean curvature (i) and the change in β1AR density (j) as a consequence of compression by the agarose pad. k, Change in β1AR density versus change in PM curvature induced by differential flattening of the cell area displayed in ch. The changes in PM curvature are randomly distributed in real space but collapse to a linear master curve, suggesting that shallow curvature is necessary for domain formation. The yellow line is a linear fit to the data. Error bars represent s.e.m. Data are representative of nC = 10 and nR = 5.
Fig. 4 |
Fig. 4 |. Curvature-coupled GPCR domains were identified with high statistical significance for different GPCRs and cell types.
a, We investigated β1AR, β2AR, GLP1R and Y2R in HEK293 cells. b, We investigated β1AR in HEK293, COS-7 and cardiomyocyte-like HL-1 cells. c, Normalized density versus mean curvature for four different GPCRs. Data are binned using an error-weighted rolling average (0.1 ± 0.1 μm−1), with error bars showing s.e.m. d, Normalized β1AR density versus mean curvature in three different cell lines. Data are binned using an error-weighted rolling average (0.1 ± 0.1 μm−1), with error bars showing s.e.m. Replicates (nC, nR) in HEK293 cells included β1AR (16, 4), β2AR (28, 4), GLP1R (20, 3) and Y2R (30, 3). Replicates (nC, nR) for β1AR in COS-7 (22, 4) and HL-1 (12, 2) were also performed.
Fig. 5 |
Fig. 5 |. A general mechanism of spatial organization that is protein specific and can be regulated by ligands.
a, Normalized density of GLP1R versus mean curvature before and after activation by 10 nM GLP1(7–36) (hereafter abbreviated GLP1). b, Two-dimensional projection of calculated density patterns for GLP1R before and after activation show the drastic ligand-induced change in GLP1R domains in real (that is, xy) space. c, Normalized density of H-Ras G12V versus mean curvature master curve. d, Two-dimensional projection of the calculated density patterns of H-Ras G12V. e, Normalized density of Piezo1 versus mean curvature master curve. f, Two-dimensional projection of the calculated density patterns of Piezo1. The fold change in density contrast compared to GLP1R (before activation) is indicated above every 2D projection. Each cartoon represents the respective protein structure embedded in the membrane. H-Ras G12V data were acquired in 3D STED mode. Data are binned using an error-weighted rolling average (0.1 ± 0.1 μm−1) with error bars showing s.e.m. Replicates (nC, nR) for GLP1R (16, 2), H-Ras (9, 2) and Piezo1 (9, 2) were performed.

Similar articles

Cited by

References

    1. Pierce KL, Premont RT & Lefkowitz RJ Seven-transmembrane receptors. Nat. Rev. Mol. Cell Biol 3, 639–650 (2002). - PubMed
    1. Weis WI & Kobilka BK The molecular bases of G protein-coupled receptor activation. Annu. Rev. Biochem 87, 879–919 (2018). - PMC - PubMed
    1. Wootten D, Christopoulos A, Marti-Solano M, Babu MM & Sexton PM Mechanisms of signalling and biased agonism in G protein-coupled receptors. Nat. Rev. Mol. Cell Biol 19, 638–653 (2018). - PubMed
    1. Nikolaev VO et al. β2-Adrenergic receptor redistribution in heart failure changes cAMP compartmentation. Science 327, 1653–1657 (2010). - PubMed
    1. Irannejad R. et al. Functional selectivity of GPCR-directed drug action through location bias. Nat. Chem. Biol 13, 799–806 (2017). - PMC - PubMed

MeSH terms

Substances