. 2023 Aug;25(8):1135-1145.
doi: 10.1038/s41556-023-01187-9. Epub 2023 Jul 17.

Haematopoietic stem and progenitor cell heterogeneity is inherited from the embryonic endothelium

Affiliations

Haematopoietic stem and progenitor cell heterogeneity is inherited from the embryonic endothelium

Joey J Ghersi et al. Nat Cell Biol. 2023 Aug.

Abstract

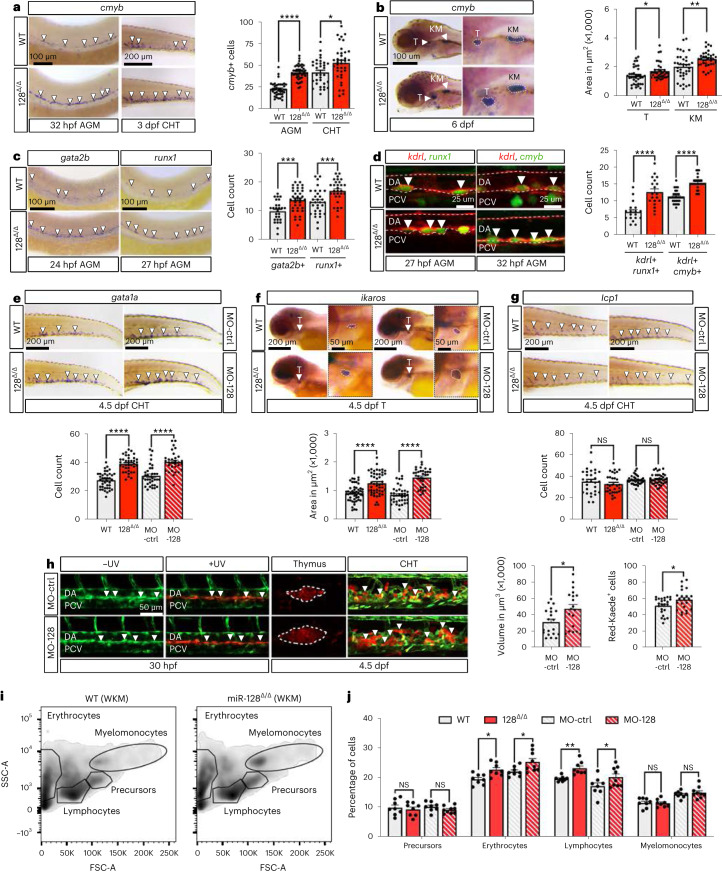
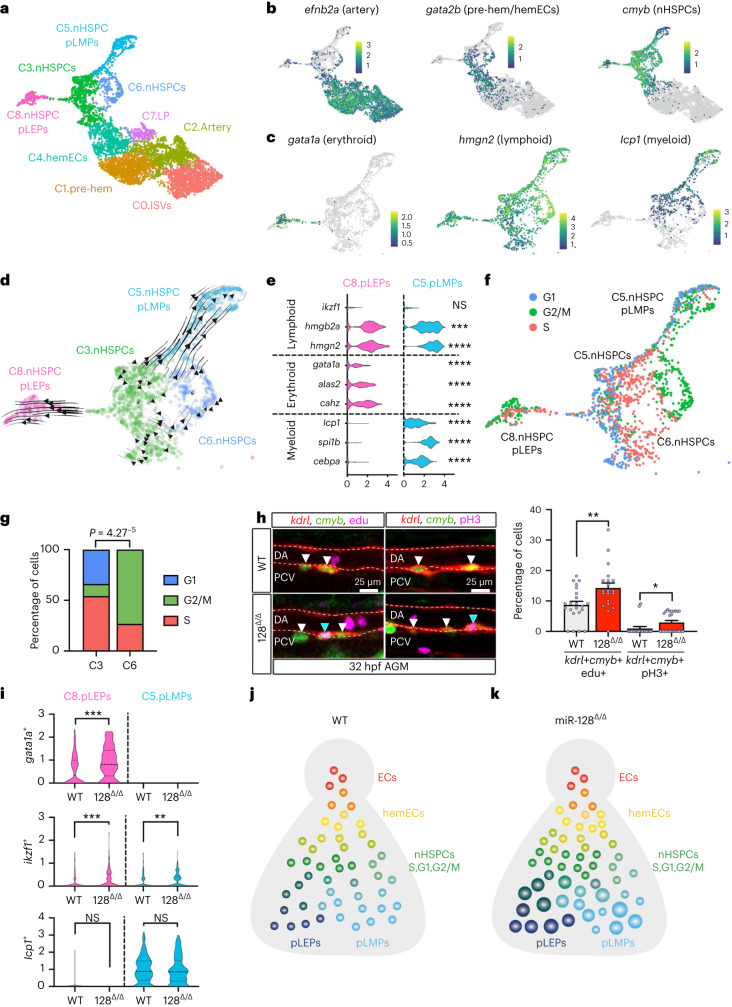
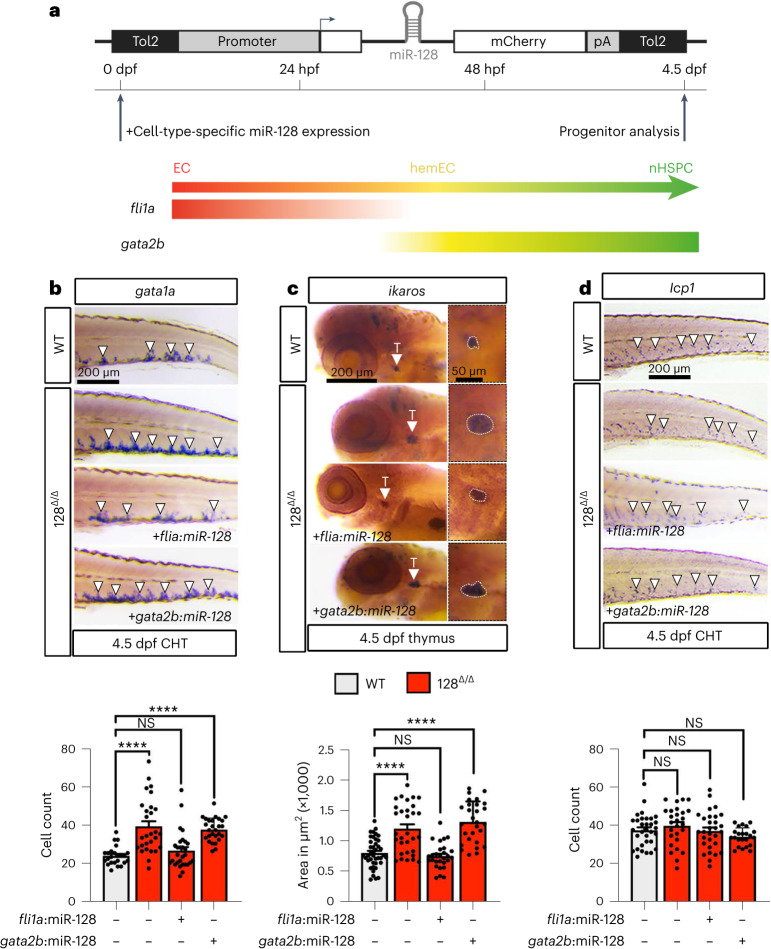
Definitive haematopoietic stem and progenitor cells (HSPCs) generate erythroid, lymphoid and myeloid lineages. HSPCs are produced in the embryo via transdifferentiation of haemogenic endothelial cells in the aorta-gonad-mesonephros (AGM). HSPCs in the AGM are heterogeneous in differentiation and proliferative output, but how these intrinsic differences are acquired remains unanswered. Here we discovered that loss of microRNA (miR)-128 in zebrafish leads to an expansion of HSPCs in the AGM with different cell cycle states and a skew towards erythroid and lymphoid progenitors. Manipulating miR-128 in differentiating haemogenic endothelial cells, before their transition to HSPCs, recapitulated the lineage skewing in both zebrafish and human pluripotent stem cells. miR-128 promotes Wnt and Notch signalling in the AGM via post-transcriptional repression of the Wnt inhibitor csnk1a1 and the Notch ligand jag1b. De-repression of cskn1a1 resulted in replicative and erythroid-biased HSPCs, whereas de-repression of jag1b resulted in G2/M and lymphoid-biased HSPCs with long-term consequence on the respective blood lineages. We propose that HSPC heterogeneity arises in the AGM endothelium and is programmed in part by Wnt and Notch signalling.


Conflict of interest statement

The authors declare no competing interests.

Figures

Fig. 1
Fig. 1. nHSPC development and blood lineages are altered in miR-128Δ/Δ.
a, WISH against cmyb at 32 hpf and 3 dpf in WT or miR-128Δ/Δ (128Δ/Δ) AGM (n = 39 (WT) and 42 (128Δ/Δ) embryos; P < 0.0001) and CHT (n = 33 (WT) and 48 (128Δ/Δ) embryos; P = 0.0151) (3 independent experiments, two-tailed Mann–Whitney test). b, WISH against cmyb at 6 dpf in WT (thymus n = 36 and KM n = 36 embryos; P = 0.0133) and 128Δ/Δ (thymus n = 35 and KM n = 36 embryos; P = 0.0033; 3 independent experiments; two-tailed Mann–Whitney test). c, WISH against gata2b (n = 27 (WT) and 35 (128Δ/Δ) embryos; P = 0.0005) and runx1 (n = 32 (WT) and 30 (128Δ/Δ) embryos; P = 0.0009; 3 independent experiments; two-tailed Mann–Whitney test). d, Confocal images of Tg(kdrl:mCherrys896,cmyb:GFPzf169) (n = 18 (WT) and 19 (128Δ/Δ) embryos; P < 0.0001) and Tg(kdrl:mCherrys896,runx1:GFPy509) (n = 29 (WT) and 31 (128Δ/Δ) embryos; P < 0.0001) AGM at 27 and 32 hpf, respectively. Quantification represents runx1+, kdrl+ (hemECs) and cmyb+, kdrl+ (nHSPCs) cells (3 independent experiments; two-tailed Mann–Whitney test). eg, WISH of gata1a (n = 40 (WT), 37 (128Δ/Δ), 34 (MO-ctrl) and 31 (Mo-128) embryos; P < 0.0001) (e), ikaros (n = 48 (WT); 48 (128Δ/Δ), 37 (MO-ctrl) and 34 (Mo-128) embryos; P < 0.0001) (f) and lcp1 (n = 29 (WT), 32 (128Δ/Δ), 36 (MO-ctrl), 38 (Mo-128) embryos; P = 0.0511 and 0.4257) (g) at 4.5 dpf with their quantification (3 independent experiments; two-tailed Mann–Whitney test). h, Confocal live imaging of Tg(fli1a:Gal4ubs4,UAS:Kaederk8), ± UV (photoconversion) in the AGM. Quantification represents the red thymus area (MO-ctrl, 20; Mo-128, 19 embryos; P = 0.0151) and the number of red cells in the CHT (MO-ctrl, 19; Mo-128, 22 embryos; P = 0.0462; 3 independent experiments; two-tailed Mann–Whitney test). i, Flow cytometry analysis of 1-month-old dissected whole (W)KM WT, 128Δ/Δ. j, Quantification of cell population identified by flow cytometry (n = 8 (WT), 8 (128Δ/Δ), 8 (MO-ctrl) and 9 (MO-128) zebrafish; two-way ANOVA with multiple comparisons). All quantifications are represented with mean ± s.e.m. NS, not significant: P > 0.05, *P ≤ 0.05, **P ≤ 0.01, ***P ≤ 0.001, ****P ≤ 0.0001. Arrowheads indicate cells stained by WISH and IF and cells photoconverted in h. T, thymus; DA, dorsal aorta; PCV, posterior cardinal vein; SSC-A, side scatter A; FSC-A, forward scatter A. Source data
Fig. 2
Fig. 2. nHSPC heterogeneity is defined by cell cycle and lineage bias phenotypes and regulated by miR-128.
a, UMAP of defined EHT cluster cells from kdr+ ECs in the tail of WT and 128Δ/Δ at 26 hpf. b, UMAP representing efnb2a, gata2b and cmyb expression normalized with Z-score. c, UMAP of gata1a, hmgn2 and lcp1 expression normalized with Z-score, in nHSPC cmyb+ clusters (C3, C6, C8 and C5). d, RNA velocity trajectories in nHSPC clusters showing that C8.nHSPC pLEPs and C5.nHSPC pLMPs are terminal states of C3.nHSPCs and C6.nHSPCs. e, Violin plot of lymphoid (ikzf1, P > 0.9999; hmgb2a, P = 0.0001; hmgn2, P < 0.0001), erythroid (gata1a, P < 0.0001; alas2, P < 0.0001; cahz, P < 0.0001) and myeloid (lcp1, P < 0.0001; spi1b, P < 0.0001; cebpa, P < 0.0001) markers in WT cells of C8.nHPSC pLEPs and C5.nHSPC pLMPs. Statistics represent the comparison between C8.nHSPC pLEPs and C5.nHSPC pLMPs for each gene (ordinary one-way ANOVA). f, UMAP cell cycle analysis on nHSPC clusters. g, Quantification of S, G2/M and G1 phase in C3. and C6.nHSPCs. C3.nHSPCs cells are mainly in S phase and G1, while C6. nHSPCs in G2/M (two-tailed Student’s t-test with Bonferroni post-hoc correction). h, Confocal images of IF using anti-RFP, anti-GFP and EdU staining (n = 22 (WT) and 20 (128Δ/Δ) embryos; P = 0.0032) or anti-pH3 (n = 18 (WT) and 24 (128Δ/Δ) embryos; P = 0.0208) in Tg(kdrl:mCherrys896,cmyb:GFPzf169) AGM at 32 hpf. S phase and G2/M nHSPCs are increased (kdrl+, cmyb+, EdU+ or pH3+ blue arrowheads and kdrl+, cmyb+, EdU− or pH3− white arrowheads) in miR-128Δ/Δ (three independent experiments; two-tailed Mann–Whitney test). i, Violin plot of gata1a (P = 0.0004), ikzf1 (P = 0.0006 and 0.0015) and lcp1 (P = 0.4505 and 0.5383) expression in clusters C8.nHPSC pLEPs and C5.nHSPC pLMPs per genotype (Mann–Whitney test). j,k, Model of nHSPC heterogeneity acquired during EHT in the AGM at 26 hpf WT (j) and 128Δ/Δ (k). 128Δ/Δ nHSPC heterogeneity is biased towards S and G2/M nHSPCs (green circles), and erythroid and lymphoid primed nHSPCs (blue circles, bigger size represents increase gene expression but not number). Not signifcant (NS): P > 0.05. **P ≤ 0.01, ***P ≤ 0.001. LP, lymphatic progenitor; ISVs, intersegmental vessels; DA, dorsal aorta; PCV, posterior cardinal vein.
Fig. 3
Fig. 3. miR-128 function in ECs to regulate HSPC heterogeneity before EHT.
a, Schematic representation of the transgene used to express WT miR-128 gene in zebrafish ECs (via flia1) or hemECs (via gata2b). For gata2b expression, we used the Tg(gata2b:Gal4sd32) line and created the UAS:miR-128 plasmid, while for fli1a expression we created fli1a:miR-128 plasmid. One-cell-state embryo was injected with tol2 mRNA and the indicated plasmids, and WISH was performed against gata1a, ikzf1 and lcp1 at 4.5 dpf, respectively. bd, WISH of gata1a (n = 27 (WT), 28 (128Δ/Δ), 27 (128Δ/Δ + fli1a), 29 (128Δ/Δ + gata2b) embryos) (b) and ikaros (n = 41 (WT); 31 (128Δ/Δ), 28 (128Δ/Δ + fli1a), 28 (128Δ/Δ + gata2b) embryos) (c) and lcp1 (n = 32 (WT), 27 (128Δ/Δ), 30 (128Δ/Δ + fli1a), 23 (128Δ/Δ + gata2b) embryos) (d) at 4.5 dpf and relative cells quantification as indicated. fli1a endothelial expression of miR-128 WT gene rescues to WT level the increase of erythroid and lymphoid progenitors of miR-128Δ/Δ, while gata2b hemEC expression of miR-128 does not rescue the increase of erythroid and lymphoid progenitors (3 independent experiments, ordinary one-way ANOVA with Tukey’s multiple comparison). All quantifications are represented with mean ± s.e.m. NS, not significant; P > 0.05, ****P ≤ 0.0001.
Fig. 4
Fig. 4. miR-128 function before EHT is conserved in hPSCs.
a, Schematic of HSPC development in vitro using hPSCs and treated as indicated with antagomiR-128 or scramble miR as control at different cell stages. b,c, Colony-forming cell assay quantification of erythroid (BFU-E, CFU-E) and myeloid (CFU-M, CFU-G, CFU-GM) of HOXA+ programme (definitive haematopoiesis) during stage 1 (b) or stage 2 (c). d, Colony-forming cell quantification of erythroid (Ery-P, BFU-E) and myeloid (CFU-M, CFU-G, CFU-GM) of HOXA/low− programme (primitive haematopoiesis) (three independent experiments). All Quantification are represented with mean ± s.e.m. NS, not significant; P > 0.05, **P ≤ 0.01, ****P ≤ 0.0001. HE, haemogenic endothelium; CFC, colony-forming cell; BFU-E, burst-forming units erythroid; CFU-E, colony-forming units of erythroid; CFU-G, colony-forming units of granulocyte; CFU-M, colony-forming units of myeloid; CFU-GM, colony-forming units of mixed granulocyte/myeloid.
Fig. 5
Fig. 5. miR-128 regulation of Notch (via jag1b) and Wnt (via csnk1a1) signalling in the EHT control nHSPC heterogeneity.
a,b, Confocal lateral view of IF zebrafish tail at 27 hpf of Tg(TCF:NLS-mCherryia5,kdrl:eGFPzn1) (n = 20 (WT), 18 (128Δ/Δ) and 19 (csnk1a1 g3′UTR) embryos) (a) and Tg(TP1:eGFPum14,kdrl:mCherrys896) (n = 18 (WT), 20 (128Δ/Δ) and 21 (jag1b g3′UTR) embryos) (b), Wnt and Notch reported lines, respectively. Quantification of Wnt and Notch kdrl+ cells based on reporter intensity. Arrowheads represent kdrl+, TCF+ or TP1+ high (white) or low/negative (blue) cells. Cell quantification is reported in the ventral floor of the dorsal aorta (VDA) (three independent experiments; ordinary one-way ANOVA with Tukey’s multiple comparison). c, Confocal images of Tg(kdrl:mCherrys896,cmyb:GFPzf169) WT and g3′UTR mutants AGM at 32 hpf. Replicative nHSPCs are increased (kdrl+, cmyb+, EdU+, blue arrowhead) (n = 19 (WT), 17 (csnk1a1 g3′UTR) and 15 (jag1b g3′UTR) embryos) in the csnk1a1 g3′UTR while unchanged in jag1b g3′UTR. G2/M nHSPCs (kdrl+, cmyb+, pH3+, blue arrowhead) (n = 17 (WT), 19 (csnk1a1 g3′UTR), 16 (jag1b g3′UTR) embryos) are increased in the jag1b g3′UTR while unchanged in csnk1a1 g3′UTR (3 independent experiments; ordinary one-way ANOVA with Tukey’s multiple comparison). d, scRNA-seq analysis of kdrl+ cells experimental perturbation among genotype using MELD (Methods) assessed by the comparison between csnk1a1 g3′UTR versus WT, showing C8 as the most perturbed cluster. e, Violin plot of erythroid markers (gata1a and alas2, P < 0.0001) within C8.nHSPC pLEPs (Mann–Whitney test). f, MELD assessed by the comparison between jag1b g3′UTR versus WT, showing C8 and C5 as the most perturbed clusters (Methods). g, Violin plot of lymphoid markers (ikzf1, P = 0.0315 (C8) and 0.0099 (C5) and hmgb2a, P < 0.0001) within C8.nHSPC pLEPs and C5.nHSPC pLMPs (two-tailed Mann–Whitney test). All quantifications are represented with mean ± s.e.m. NS, not significant; P > 0.05, *P ≤ 0.05, **P ≤ 0.01, ****P ≤ 0.0001. DA, dorsal aorta; PCV, posterior cardinal vein.
Fig. 6
Fig. 6. miR-128 regulation of jag1b and csnk1a1 in the embryonic EHT control long-term blood lineages.
a,b, Quantification of erythroid (a) and lymphoid (b) progenitors by WISH against gata1a (n = 37 (WT), 37 (csnk1a1 g3′UTR), 37 (jag1b g3′UTR), 31 (WT), 30 (hsp:csnk1a1) and 28 (hsp:jag1b) embryos) and ikaros (n = 32 (WT), 34 (csnk1a1 g3′UTR), 32 (jag1b g3′UTR), 31 (WT), 31 (hsp:csnk1a1) and 30 (hsp:jag1b) embryos), respectively, at 4.5 dpf CHT or thymus. WT and hsp:csnk1a1 and hsp:jag1b were heat shocked at 24 hpf. csnk1a1 de-repression or transient gain-of-function regulate erythroid progenitor formation, while jag1b manipulations regulate lymphoid progenitors (three independent experiments; ordinary one-way ANOVA with Tukey’s multiple comparison). c, Quantification of blood cell population identified by flow cytometry of ~2-month-old WKM dissected from samples treated as in h and i. Erythrocyte fraction is increased in csnk1a1 g3′UTR and hsp:csnk1a1, while lymphoid cells fraction is increased in jag1b g3′UTR and hsp:jag1b after heat shock at 24 hpf (n = 9 (WT), 11 (csnk1a1 g3′UTR), 9 (jag1b g3′UTR), 7 (WT), 9 (hsp:csnk1a1) and 7 (hsp:jag1b) zebrafish; two-way ANOVA with multiple comparisons). d, Proposed model of nHSPC heterogeneity regulated by miR-128 regulation on Wnt and Notch signalling in vascular endothelia cells before EHT. Vascular signalling, like Wnt (purple) and Notch (yellow), limits the production of a heterogeneous pool of nHSPCs in the AGM. e, Diminishment of Wnt (light grey), like after de-repression or gain of function of csnk1a1 in the EHT, results in an increase of replicative (S), and erythroid-biased nHSPCs in the AGM and relative erythroid progenitors and mature lineages. Diminishment of Notch (light grey), like after de-repression or gain of function of jag1b in the EHT, increases G2/M nHSPCs and lymphoid-biased nHSPCs in the AGM and relative lymphoid progenitors and mature cells. All quantifications are represented with mean ± s.e.m. NS, not significant; P > 0.05, *P ≤ 0.05, **P ≤ 0.01, ****P ≤ 0.0001. T, thymus.
Extended Data Fig. 1
Extended Data Fig. 1. miR-128Δ/Δphenotype in vascular and hematopoietic development.
(a) Genomic location of miR-128-1 and miR-128-2 and qRT-PCR analysis of r3hdm1 and arpp21 (3 independent pools of ~10 embryos; Two-tailed Mann-Whitney test). (b) Representative images showing cmyb and lcp1 cells. (c) Time-lapse with dragon-tail analysis of WT and 128Δ/Δ Tg(kdrl:mCherrys896,cmyb:GFPzf169) from ~24 to 50 hpf. The color scale represents the time a cell to delaminate. (d) Confocal imaging of WT and 128Δ/Δ embryos at 27 hpf. (e) Percentage of ECs over total number of cells in WT (n = 11 embryos) and 128Δ/Δ (n = 10 embryos) at 26 hpf by flow cytometry (3 individual experiments, Two-tailed Mann-Whitney test). (f) WISH of WT and 128Δ/Δ with notch3 and flt4. (g) Images of WT and 128Δ/Δ embryos. (h) WISH of etv2 and scl at 12 hpf. (i) qRT-PCR analysis of etv2 and scl (8 to 9 independent pools of ~10 embryos) at 12 hpf (Two-tailed Mann-Whitney test). (j) WISH of rag1+ cells at 4.5 dpf (n = WT, 36, 128Δ/Δ, 39 embryos; p-value = 0.001; 3 independent experiments, Mann-Whitney test). (k) O-dianisidine staining at 6 dpf (n = WT, 38, 128Δ/Δ, 44 embryos; p-value < 0.0001; 3 independent experiments, Mann-Whitney test). (l) Sudan black staining at 6 dpf (n = WT, 32, 128Δ/Δ, 27 embryos; 3 independent experiments, Two-tailed Mann-Whitney test). (m) O-dianisidine staining of WT and 128Δ/Δ at ~2.5 dpf. (n) Sudan black staining of WT and 128Δ/Δ at ~2 dpf. (o) qRT-PCR analysis of miR-128 normalized with U6 (n = MO-ctrl, 3, MO-128; p-value = 0.0224; 3 independent pools of ~10 embryos, Two-tailed one sample t and Wilcoxon test). (p) Flow cytometry population analysis of ~1-month-old dissected whole KM zebrafish injected with MO-control or MO-128. All quantifications are represented with mean ± SEM. ns: p > 0.05, *p ≤ 0.05. Abbreviations: aorta gonad mesonephros (AGM), dorsal aorta (DA), posterior cardinal vein (PCV), caudal hematopoietic tissue (CHT), thymus (T), intersegmental vessel (ISV) and (kidney marrow (KM).
Extended Data Fig. 2
Extended Data Fig. 2. Single cell RNA sequencing analysis of miR-128Δ/ΔEHT.
(a) Schematic representation of single cell RNA-sequencing (scRNAseq) strategy of kdrl+ tail endothelial cells (ECs) of WT and miR-128Δ/Δ (128Δ/Δ) at 26 hpf isolated by FACS from Tg(kdrl:GFPzn1). (b) Heatmap showing the average gene expression of canonical vascular, hemogenic, blood stem cells and lineage gene markers in scRNAseq of 22,230 kdrl+ cells (WT + 128Δ/Δ). Clusters selected in red correspond to the ones used for the re-analysis of specific EHT cells. (c) Gene Ontology (GO) analysis of reanalyzed 6096 kdrl + EHT cells. (d) Violin plots of kdrl, lyve1b and mrc1a expression in each cluster of WT cells (ordinary one-way ANOVA with Tukey’s multiple comparison). (e) Percentage of cells expressing gata2b, runx1 and cmyb in each cluster of WT cells. (f) UMAP of nHSPC clusters showing expression of defining HSPC markers, ptprc and lmo2. (g,h) Pseudotime analysis (g) and CellRank analysis (h) showing C8.nHSPC pLEPs and C5.nHSPC pLMPs are both terminal states of EHT cell clusters (Methods). (i) UMAP of WT and 128Δ/Δ of EHT cluster kdrl+ cells with assigned identification. (j) Percentage of cells expressing gata2b in pre-EHT (C2 and C1) and hemEC (C4) clusters in WT and 128Δ/Δ kdrl+ cells. (k) Percentage of cells in nHSPC clusters per genotype, showing the tendency of C3.nHSPCs to increase in 128Δ/Δ compared to WT. (l) Quantification of ECs (kdrl+, cmyb) edu+ (n = WT, 22; 128Δ/Δ, 20 embryos) or pH3+ (n = WT, 18; 128Δ/Δ, 24 embryos) counted in the same images as Fig. 2h (3 independent experiments, Two-tailed Mann-Whitney test). All Quantification are represented with mean ± SEM. ns: p > 0.05, *p ≤ 0.05, **p ≤ 0.01, *** p ≤ 0.001, **** p ≤ 0.0001. Abbreviations: primed lympho-erythroid progenitors (pLEPs), primed lympho-myeloid progenitors (pLMPs), lymphatic progenitor (LP) and intersegmental vessels (ISV).
Extended Data Fig. 3
Extended Data Fig. 3. miR-128 regulates nHSPC heterogeneity prior EHT in zebrafish.
(a) Schematic representation of FACS isolation of zebrafish cells from 26 hpf Tg(kdrl:mCherrys896;cmyb:GFPzf169) nHSPCs (cmyb+, kdrl+), endothelia cells (ECs) (cmyb-,kdrl+) and non-ECs (cmyb-,kdrl-). RT-qPCR analysis of miR-128 (non-ECs, 5; ECs, 4; HSPCs, 5 independent pools of ~10 embryos) showing mature miR-128 expression enriched in ECs vs HSPCs or non-ECs (ordinary one-way ANOVA with Tukey’s multiple comparison). (b) Percentage of cells in scRNA-seq clusters expressing r3hdm1 and arpp21 in which the intronic miR-128 genes 1 and 2 are hosted, respectively. (c) Confocal images of zebrafish tail at 32 hpf in WT Tg(kdrl:GFPzn1) injected at one cell stage with Tol2 fli1a:miR-128-mCherry and gata2b:gal4 with Tol2 UAS:miR-128-mCherry (labeled as gata2b:miiR-128) (3 independent experiments). mCherry indicates successful miR-128 expression in the respective cells (arrowheads). (d) WISH analysis of runx1 (n = WT, 32; WT + fli1a, 27; 128Δ/Δ, 30; 128Δ/Δ + fli1a, 35; embryos) at 27 hpf with and without Tol2 fli1a:miR-128-mCherry injection at one cell stage (3 independent experiments; ordinary one-way ANOVA with Tukey’s multiple comparison). All quantification are represented with mean ± SEM. ns: p > 0.05, *p ≤ 0.05, **p ≤ 0.01,**** p ≤ 0.0001. Abbreviations: aorta gonad mesonephros (AGM).
Extended Data Fig. 4
Extended Data Fig. 4. miR-128 regulates nHSPC heterogeneity prior EHT in human pluripotent stem cells.
a) qRT-PCR analysis of mature miR-128 in hemogenic endothelial cells from human pluripotent stem cell (hPSC) treated with scramble or antagomiR-128 at stage 1 (n = Control, 5; scramble, 5; antagomir-128, 5 independent experiments; ordinary one-way ANOVA with Tukey’s multiple comparison). (b) Representative flow cytometry analysis of CD34 and CD43 expression during differentiation of cells treated with vehicle control or scramble or antagomir-128 (Stage 1). (c) Representative flow cytometry analysis of cells expressing CD34 and CD45 during differentiation of hPSCs treated with vehicle control or scramble or antagomir-128 (Stage 1). (d) Quantification of cells CD34+CD45+ (HSPCs) (n = Control, 3; scramble, 3; antagomir-128, 3 independent experiments) and CD34CD45+ (progenitors) (n = Control, 3; scramble, 3; antagomir-128, 3 independent experiments) (Ordinary one-way ANOVA with Tukey’s multiple comparison). (e) Representative flow cytometry analysis of cells expressing CD34 and CD45 during differentiation of hPSCs treated with vehicle control or scramble or antagomir-128 (Stage 2). (f) Quantification of cells CD34+CD45+ (HSPCs) (n = Control, 3; scramble, 3; antagomir-128, 3 independent experiments) and CD34CD45+ (blood progenitors) (n = Control, 3; scramble, 3; antagomir-128, 3 independent experiments, ordinary one-way ANOVA with Tukey’s multiple comparison). (g) Representative flow cytometry analysis of cells expressing KDR and CD235a during hPSC differentiation. (h) Representative flow cytometry analysis of cells expressing CD34 and CD43 during hPSC differentiation treated with vehicle control or scramble or antagomiR-128. (i) Quantification of CD43+ cells (n = Control, 4; scramble, 4; antagomir-128, 4 independent experiments; ordinary one-way ANOVA with Tukey’s multiple comparison). All quantification are represented with mean ± SEM. ns: p > 0.05, **p ≤ 0.01, *** p ≤ 0.001,**** p ≤ 0.0001. Abbreviations: fold change (FC) and hemogenic endothelium (HE).
Extended Data Fig. 5
Extended Data Fig. 5. miR-128 targets csnk1a and jag1b prior EHT to regulate Wnt and Notch signaling respectively.
(a) Bulk RNA sequencing strategy. (b) KEGG analysis on miR-128 target genes. (c) Heatmap of bulk RNA sequencing in WT and 128Δ/Δ. (d) UMAP of Wnt- and Notch-signaling signature in WT cells. (e) Percentage of cells expressing csnk1a1, nlk1, rac3b, dla, dlc and jag1b in scRNA-seq WT EHT clusters. (f) qRT-PCR at 26 hpf (n = 3 independent experiments for all genes and conditions, two-way ANOVA). (g) qRT-PCR of csnk1a1 and jag1b at 26 hpf (3 independent pools of ~10 embryos, Ordinary one-way ANOVA with Tukey’s multiple comparison). (h) CRISPR/Cas9 design in miR-128 binding site (orange). Agarose gel of csnk1a1 and jag1b 3′UTR region. qRT-PCR of csnk1a1 and jag1b at 24 hpf (jag1b expression, n = WT, 3; jag1b g3′UTR, 3; csnk1a1 expression; WT, 4; csnk1a1 g3′UTR, 4 independent pools of ~5 embryos; Two-tailed Mann-Whitney test). (i,j) (i) Tg(TCF:NLS-mCherryia5,kdrl:eGFPzn1) (n = WT, 20; 128Δ/Δ, 18; csnk1a1 g3′UTR, 19 embryos) and (j) Tg(TP1:eGFPum14,kdrl:mCherrys896) (n = WT, 18; 128Δ/Δ, 20; jag1b g3′UTR, 21 embryos; 3 independent experiments; ordinary one-way ANOVA with Tukey’s multiple comparison). (k) qRT-PCR analysis of Wnt (ccnd1 and tcf7) or Notch (her1 and hes6) responsive genes in 24hpf WT and 128Δ/Δ (For all conditions, n = 3 independent pools of ~10 embryos for all genes; ordinary one-way ANOVA). (l) qRT-PCR analysis of Wnt (ccnd1 and tcf7) or Notch (her1 and hes6) responsive genes in 24 hpf WT, csnk1a1 g3′UTR and jag1b g3′UTR (For all conditions, n = 3 independent pools of ~10 embryos for all genes; ordinary one-way ANOVA). (m) Bar graph representing WNT- and NOTCH-regulated genes by bulk RNA-sequencing of HOXA + CD34 + CD43- cells following scramble or antagomiR-128 treatment during stage 1. All quantification are represented with mean ± SEM. ns: p > 0.05, *p ≤ 0.05, **p ≤ 0.01, *** p ≤ 0.001, **** p ≤ 0.0001. Abbreviations: T7 endonuclease (T7EI), KEGG (Kyoto Encyclopedia of Genes and Genomes).
Extended Data Fig. 6
Extended Data Fig. 6. miR-128 regulation of csnk1a1 and jag1b differentially guide nHSPC heterogeneity.
(a) scRNA seq strategy of WT, csnk1a1 and jag1b g3′UTR Tg(kdrl:GFPzn1). (b) Heatmap of defining markers (20,600 kdrl+ cells). (c) UMAP of 5597 kdrl+ cells part of the clusters reanalyzed from EHT clusters in b. (d) Percentage of gata2b+ cells in pre-EHT clusters (C2, C1 and C4). (e) Percentage of cells in nHSPC clusters in all genotypes. (f) Quantification of nHSPCs (cmyb+, kdrl+) (n = WT, 19, csnk1a1 g3′UTR, 17; jag1b g3′UTR, 16 embryos) at 32 hpf WT, csnk1a1 and jag1b g3′UTR mutants shown as Fig. 5c (3 independent experiments; ordinary one-way ANOVA). Percentage of ECs (kdrl+,cmyb-) in S phase (edu+) (n = WT, 19, csnk1a1 g3′UTR, 17; jag1b g3′UTR, 15 embryos) and G2/M (pH3+) (n = WT, 17, csnk1a1 g3′UTR, 19; jag1b g3′UTR, 16 embryos) at 32hpf as shown in Fig. 4c (3 independent experiments; ordinary one-way ANOVA with Tukey’s multiple comparison). (g) Heatmap of erythroid (gata1a, hbaa1, hbaa2, hbba1 and hbba2), lymphoid (ikzf1, hmgb2a and cd81a) and myeloid (lcp1, rac2, coro1a and spi1b) defining markers in C8 and C5 WT, csnk1a1 and jag1b g3′UTR mutants. (h-j) UMAP showing expression of erythroid markers (gata1a and alas2) (h) within C8.nHSPC pLEPs and lymphoid markers (hmgb2a (i) and ikzf1 (j)) within C8.nHSPC pLEPs and C5.nHSPC pLMPs. (k,l) UMAP and violin plot showing expression of myeloid marker lcp1 (k) and spi1b (l) in C8.nHSPC pLEPs and C5.nHSPC pLMPs (Mann-Whitney test). Erythroid markers are enriched in C8 of csnk1a1 g3′UTR, lymphoid markers are enriched in both C8 and C5 of jag1b g3′UTR, while myeloid markers are unchanged in both g3′UTR mutants. All quantification are represented with mean ± SEM. ns: p > 0.05, **p ≤ 0.01, **** p ≤ 0.0001. Abbreviations: primed lympho-erythroid progenitors (pLEPs) and primed lympho-myeloid progenitors (pLMPs).
Extended Data Fig. 7
Extended Data Fig. 7. miR-128 regulation of csnk1a1 and jag1b differentially drive erythroid and lymphoid blood lineages.
(a) Schematic representation of heat-shock strategy to temporally and transiently express csnk1a1 or jag1b in EHT (24-30hpf). WT Tg(kdrl:GFPzn1) embryos were injected at one cell state with transposase and Tol2 hsp:jag1b-T2A-RFP or Tol2 hsp:csnk1a-T2A-RFP. Heat-shock (Methods) were performed at 24 hpf and blood progenitors analyzed on RFP+ embryos at 4.5 dpf. (b) Fluorescence stereoscope and confocal representative images of embryos treated as in a, at 30hpf (3 independent experiments). (c) Quantification of the myeloid progenitors by lcp1 WISH (n = WT, 30; csnk1a1 g3′UTR, 30; jag1b g3′UTR, 30; WT, 31; hsp:csnk1a1, 30; hsp:jag1b, 32 embryos) at 4.5dpf of WT (3 independent experiments; ordinary one-way ANOVA). (d) Flow cytometry population analysis defined by SSC-A and FSC-A of ~2-month-old dissected whole KM WT, csnk1a1, jag1b g3′UTR mutants and WT, hsp:csnk1a1 and hsp:jag1b after heat-shock at 24-30 hpf. (e) Quantification of adult blood cell population in (d) and Fig. 4j. Immature precursors and myelomonocytes are unchanged in any condition compared to their respective controls (n = WT, 9; csnk1a1 g3′UTR, 11; jag1b g3′UTR, 9; WT, 7; hsp:csnk1a1, 9; hsp:jag1b, 7 embryos; two-way ANOVA with Tukey’s multiple comparisons). All quantification are represented with mean ± SEM. ns: p > 0.05. Abbreviations: CHT: Caudal hematopoietic tissue, FSC: Forward scatter and SSC: side scatter.

References

    1. Zhang Y, Gao S, Xia J, Liu F. Hematopoietic hierarchy—an updated roadmap. Trends Cell Biol. 2018;28:976–986. doi: 10.1016/j.tcb.2018.06.001. - DOI - PubMed
    1. Tian Y, et al. The first wave of T lymphopoiesis in zebrafish arises from aorta endothelium independent of hematopoietic stem cells. J. Exp. Med. 2017;214:3347–3360. doi: 10.1084/jem.20170488. - DOI - PMC - PubMed
    1. Rodriguez-Fraticelli AE, et al. Single-cell lineage tracing unveils a role for TCF15 in haematopoiesis. Nature. 2020;583:585–589. doi: 10.1038/s41586-020-2503-6. - DOI - PMC - PubMed
    1. Rodriguez-Fraticelli AE, et al. Clonal analysis of lineage fate in native haematopoiesis. Nature. 2018;553:212–216. doi: 10.1038/nature25168. - DOI - PMC - PubMed
    1. Patel SH, et al. Lifelong multilineage contribution by embryonic-born blood progenitors. Nature. 2022;606:747–753. doi: 10.1038/s41586-022-04804-z. - DOI - PubMed

Publication types