. 2023 Sep;33(9):661-678.
doi: 10.1038/s41422-023-00846-8. Epub 2023 Jul 17.

Dissecting peri-implantation development using cultured human embryos and embryo-like assembloids

Affiliations

Dissecting peri-implantation development using cultured human embryos and embryo-like assembloids

Zongyong Ai et al. Cell Res. 2023 Sep.

Abstract

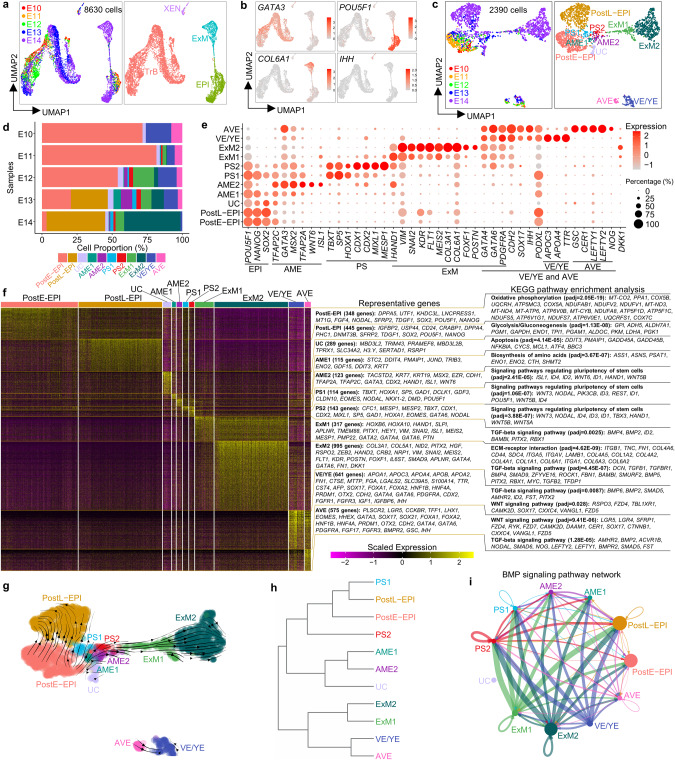
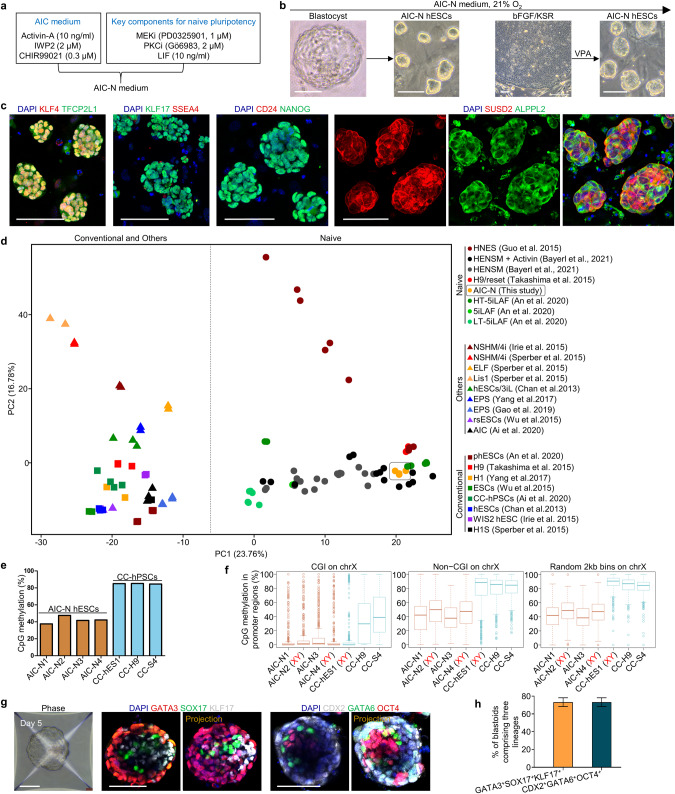
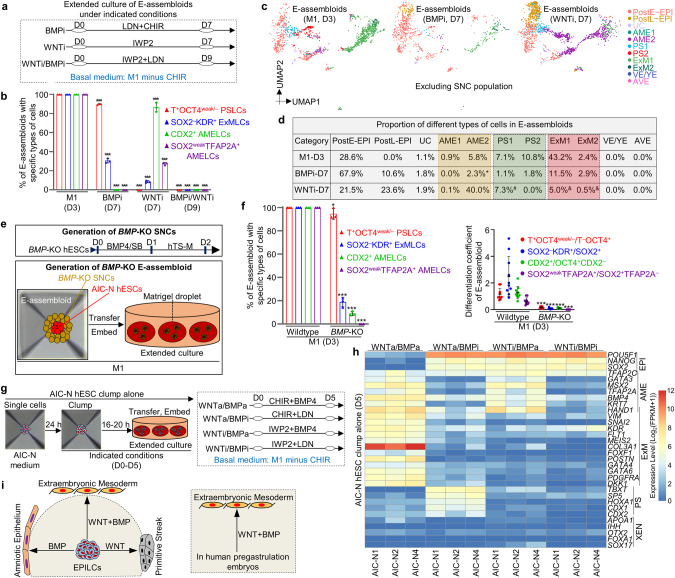
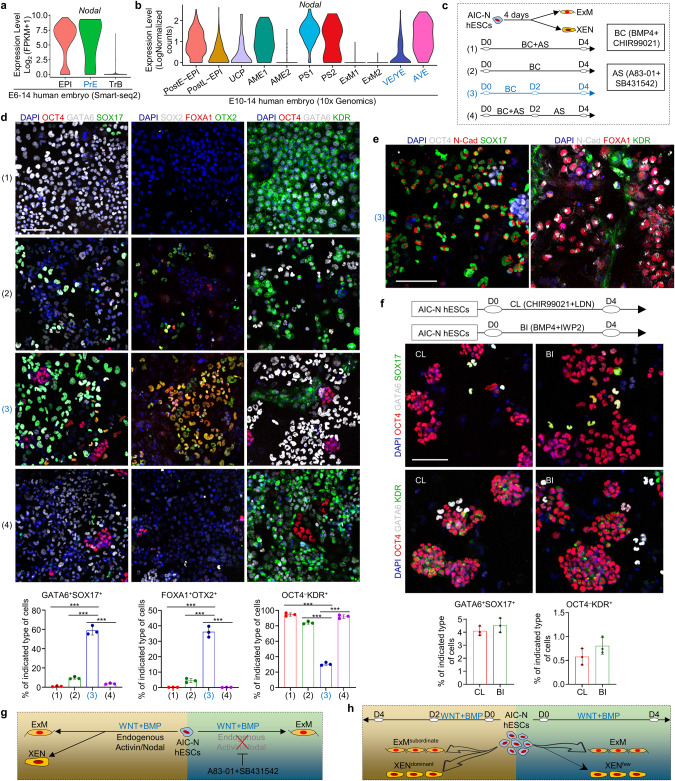
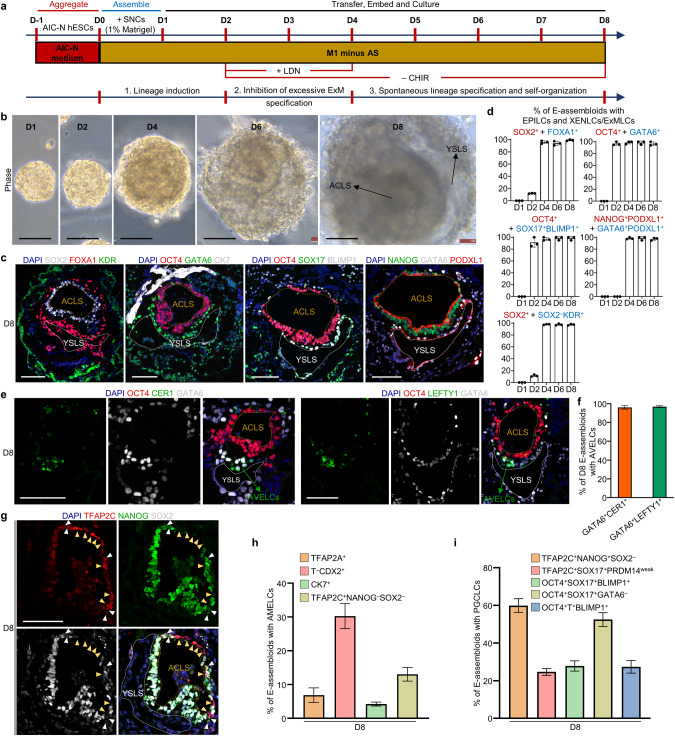
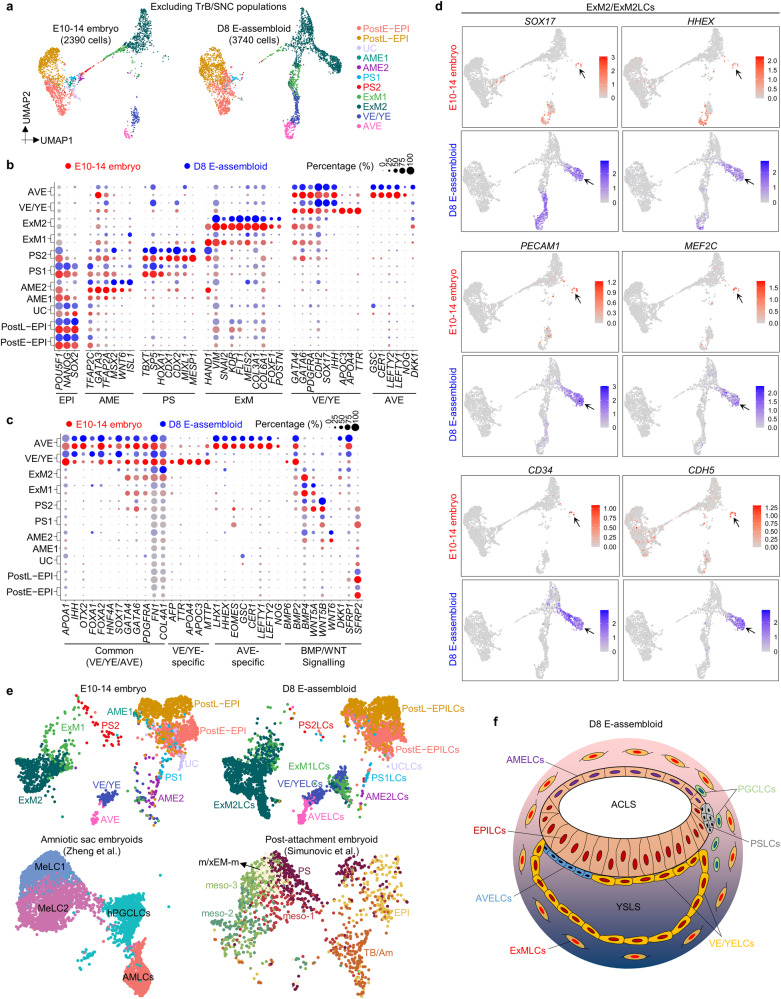
Studies of cultured embryos have provided insights into human peri-implantation development. However, detailed knowledge of peri-implantation lineage development as well as underlying mechanisms remains obscure. Using 3D-cultured human embryos, herein we report a complete cell atlas of the early post-implantation lineages and decipher cellular composition and gene signatures of the epiblast and hypoblast derivatives. In addition, we develop an embryo-like assembloid (E-assembloid) by assembling naive hESCs and extraembryonic cells. Using human embryos and E-assembloids, we reveal that WNT, BMP and Nodal signaling pathways synergistically, but functionally differently, orchestrate human peri-implantation lineage development. Specially, we dissect mechanisms underlying extraembryonic mesoderm and extraembryonic endoderm specifications. Finally, an improved E-assembloid is developed to recapitulate the epiblast and hypoblast development and tissue architectures in the pre-gastrulation human embryo. Our findings provide insights into human peri-implantation development, and the E-assembloid offers a useful model to disentangle cellular behaviors and signaling interactions that drive human embryogenesis.


Conflict of interest statement

The authors declare no competing interests.

Figures

Fig. 1
Fig. 1. Single-cell transcriptome analysis of 3D-cultured human post-implantation embryos.
scRNA-seq data are from 10× Genomics platform. a Uniform Manifold Approximation and Projection (UMAP) visualization of single-cell transcriptome datasets from 3D-cultured human post-implantation embryos at different embryonic days. b UMAP plots of genes that were differentially expressed in four different populations. c UMAP visualization of all cell types after excluding trophoblast subpopulation. d Proportions of the indicated subtypes of cells in extended cultured human embryos at different developmental time points according to the results of scRNA-seq data. e Dot plots of candidate genes specific for cell subtypes. f Heatmap of differentially expressed genes (DEGs) among different cell subtypes displayed in c. Representative genes (left) and KEGG pathway enrichment analysis (right) are shown. Padj of Wilcoxon’s rank-sum test < 0.05, log2 (FC) > 0.25 and expressed in > 25% of cells of the given cluster. g RNA velocity vectors projected onto the UMAP-based embeddings of the single-cell transcriptome dataset from human embryos shown in c. h The hierarchical clustering tree of different cell subpopulations. i The inferred BMP signaling pathway network. Circle sizes are proportional to the number of cells in each subpopulation and line weight represents the communication probability. See also Supplementary information, Fig. S1.
Fig. 2
Fig. 2. Derivation of naive hESCs under normoxia (21% O2).
a Schematic diagram of the AIC-N medium by incorporating the key components for the maintenance of naive pluripotency into the AIC medium. b Representative phase contrast images showing the generation of naive hESCs (AIC-N hESCs) from blastocysts and by conversion of primed hPSCs under normoxia. Four AIC-N hESC lines were established from seven blastocysts. The conversion of primed hPSCs required addition of valproic acid (VPA) for 4–6 d. c Immunostaining of naive, primed and general pluripotency markers for AIC-N hESCs. d Principle componet analysis (PCA) of the gene expression profiles of hPSCs grown in various conditions. e Whole-genome CpG methylation levels of four AIC-N hESC lines and three primed hPSC (CC-hPSC) lines based on bisulfite sequencing (BS-seq) analysis. f CpG methylation levels at X-linked promoter CpG islands (CGIs) (left), non-CGI promoter regions (middle) and random 2 kb bins (right) in AIC-N hESCs and CC-hPSCs. The random 2 kb bins do not overlap any CGIs or non-CG promoters. Promoters are defined as +/−1 kb regions around transcription start sites. g Representative phase contrast and immunostaining images showing the generation of blastoids from AIC-N hESCs. h Quantification of the percentage of blastoids comprising three lineages (TE-, HB- and EPI-like cells), three independent experiments; more than 100 blastoids were quantified for each experiment. Data are presented as mean ± SD. Scale bars, 100 µm. See also Supplementary information, Fig. S2.
Fig. 3
Fig. 3. Generation and extended culture of E-assembloids.
a Diagram for generating human embryoids by assembly of AIC-N hESCs and different types of xEMs. b Representative staining images (left) and schematics (right) depicting three types of D1 embryoids according to the state of AIC-hESCs wrapped by extraembryonic cells (xEMs). CK7 for xEMs, and OCT4 for AIC-N hESCs. c Quantification of three types of D1 embryoids derived from AIC-N hESCs and different types of xEMs. Three independent experiments; more than 100 embryoids were quantified for each experimental group. Data are presented as mean ± SD. A large number of dead cells surround the embryoid assembled from D1 BICs (Supplementary information, Fig. S3l), and therefore, these embryoids were not used for further study. d Diagram of extended culture of human E-assembloids assembled from AIC-N hESCs and D2 BICs (SNCs). e Representative phase contrast images of E-assembloids during extended culture in the M1 condition. f Dynamic diameters of E-assembloids during extended culture in the M1 condition. n = 3 independent experiments; at least 100 E-assembloids were quantified in each experiment; data are presented as mean ± SD. g Immunostaining of D3 E-assembloids with specific lineage markers. Yellow arrowheads indicate AMELCs. h Quantification of different types of E-assembloids indicated in g. Three independent experiments; at least 100 E-assembloids were quantified in each experiment; data are presented as mean ± SD. i UMAP visualization of integration analysis of the remaining cell types after excluding TrB and SNC populations from human embryos and D3 E-assembloids, respectively. j Proportion of different subtypes of cells indicated in i based on analysis of scRNA-seq data. k Schematic diagram showing the specifications of indicated cell lineages in D3 E-assembloids. l The inferred WNT and BMP signaling outputs from SNCs; line weight represents the communication probability. m Heatmap shows the relative importance of each cell group based on the computed four network centrality measures of WNT and BMP signaling network. Scale bars, 100 µm. See also Supplementary information, Figs. S3 and S4.
Fig. 4
Fig. 4. WNT and BMP signaling pathways orchestrate lineage development.
a Schematic diagram of different culture conditions for E-assembloids. BMPi and WNTi represent BMP inhibition and WNT inhibition, respectively. Compared to the M1 condition, BMP or/and WNT inhibition delayed/blocked EPILC development in E-assembloids toward embryonic and extraembryonic lineages, and we therefore prolonged culture of E-assembloids to observe the potential effects of WNT or/and BMP inhibition (7 days for individual inhibition and 9 days for dual inhibition). b Quantification of different types of E-assembloids cultured in the indicated conditions at the indicated time points. n = 3 independent experiments; at least 100 E-assembloids were quantified in each experiment; data are presented as mean ± SD. ***P ≤ 0.001 with Student’s t-test. c UMAP visualization of integration analysis of the remaining cell types after excluding TrB and SNC populations from human embryos and E-assembloids grown in the indicated conditions, respectively. d Proportion of different cell subtypes in E-assembloids cultured in the indicated conditions at different time points (see also Supplementary information, Fig. S5d). *These cells were clustered into AME2, but weakly co-expressed AME, PS and ExM marker genes, indicating an uncertain identity; #these cells were clustered into PS1 and co-expressed pluripotency and AME but not PS marker genes, implying a nascent amnion identity; &these cells were clustered into ExM1/2 and highly expressed AME but not ExM marker genes, implying a amnion identity. e Diagram of generation of BMP-KO H9 SNCs (top) and BMP-KO E-assembloids (bottom, see also Supplementary information, Fig. S5e). f Proportion (left) and differentiation coefficient (right) of different types of E-assembloids (wild type and BMP-KO) grown in the M1 condition on D3. The differentiation coefficient represents the ratio of differentiated cells to pluripotent cells. For the proportion, n = 3 independent experiments; at least 100 E-assembloids were quantified in each experiment; for the differentiation coefficient, 10 E-assembloids were randomly selected for statistics in each group. Data are presented as mean ± SD. *P ≤ 0.05 and ***P ≤ 0.001 with Student’s t-test. g Schematic diagram of AIC-N hESC clumps cultured alone in different culture conditions for 5 days. WNTa and BMPa represent WNT activation and BMP activation, respectively. h Heatmap of representative marker genes of different lineages from three AIC-N hESC lines cultured in the indicated conditions. i Functional diagram of WNT and BMP signaling pathways on embryonic lineage development. CHIR CHIR99021, LDN LDN193189-2HCl, SB SB431542. See also Supplementary information, Fig. S5.
Fig. 5
Fig. 5. Extraembryonic endoderm specification.
a, b Violin plots of Nodal gene expressed in different types of cells by scRNA-seq data. a published smart-seq2 data. b 10× Genomics data. c Functional experiment of WNT, BMP and Nodal signals on XENLC and ExMLC specifications. d Representative staining images showing the specifications of XENLCs and ExMLCs and proportion of the indicated cell types under different culture conditions. n = 3 independent experiments; data are presented as mean ± SD. ***P ≤ 0.001 with Student’s t-test. e Representative staining images showing the specifications of XENLCs and ExMLCs under Condition (3). f Schematic diagram of culture conditions (top), representative staining images (middle) and proportion of different cell types (bottom) under the indicated culture conditions. n = 3 independent experiments; data are presented as mean ± SD. g, h Functional schematic diagram of WNT, BMP and Nodal signals on the specifications of XENLCs and ExMLCs. LCs, -like cells; scale bars, 100 µm.
Fig. 6
Fig. 6. E-assembloids recapitulate early post-implantation embryogenesis.
a Schematic representation of improved protocol for assembly and extended culture of E-assembloids. AS, A83-01 + SB431542; CHIR, CHIR99021; LDN, LDN193189-2HCl; ‘+’ and ‘−’ represent ‘add’ and ‘withdraw’, respectively. b Representative phase constrast images of E-assembloids during extended culture. c Representative immunostaining images showing the formation of ACLS and YSLS in D8 E-assembloids. d Quantification of the E-assembloids with EPILCs (red) and XENLCs/ExMLCs (blue) at different time points. n = 3 independent experiments; more than 100 structures were quantified in each experiment; data are presented as mean ± SD. e Representative immunostaining images showing the generation of AVELCs in D8 E-assembloids. f Quantification of the E-assembloids with AVELCs indicated in e. n = 3 independent experiments; more than 100 structures were quantified in each experiment; data are presented as mean ± SD. g Representative immunostaining images showing the specifications of AMELCs (yellow arrowheads) and PGCLCs (white arrowheads) in D8 E-assembloids. h, i Quantification of D8 E-assembloids containing AMELCs and PGCLCs. n = 3 independent experiments; more than 100 structures were quantified in each experiment; data are presented as mean ± SD. AC amniotic cavity, YS yolk sac, LS -like structure. Scale bars, 100 µm. See also Supplementary information, Fig. S6.
Fig. 7
Fig. 7. Comparative single-cell transcriptomics of E-assembloids and 3D-cultured embryos.
a UMAP visualization of integration analysis of the remaining cell types after excluding TrB and SNC populations in human embryos and D8 E-assembloids, respectively. b, c Dot plots of candidate genes specific for the indicated cell subtypes in human embryos and D8 E-assembloids. d UMAP plots of the indicated genes expressed in D8 E-assembloids and 3D-cultured embryos. Some cells in ExM2 population exhibit haemato-endothelial characteristics (arrow). e Comparative integration analysis of scRNA-seq datasets from 3D-cultured human embryos, E-assembloids and two other embryo models., f Schematic diagram showing 3D morphological feature of D8 E-assembloid. MeLC mesoderm-like cell, m/xEM-m mesoderm/extraembryonic mesoderm, meso mesoderm, TB/Am trophoblast/amnion. See also Supplementary information, Fig. S7.

Comment in

Similar articles

Cited by

References

    1. Shahbazi MN, et al. Self-organization of the human embryo in the absence of maternal tissues. Nat. Cell Biol. 2016;18:700–708. doi: 10.1038/ncb3347. - DOI - PMC - PubMed
    1. Deglincerti A, et al. Self-organization of the in vitro attached human embryo. Nature. 2016;533:251–254. doi: 10.1038/nature17948. - DOI - PubMed
    1. Zhou F, et al. Reconstituting the transcriptome and DNA methylome landscapes of human implantation. Nature. 2019;572:660–664. doi: 10.1038/s41586-019-1500-0. - DOI - PubMed
    1. Xiang L, et al. A developmental landscape of 3D-cultured human pre-gastrulation embryos. Nature. 2020;577:537–542. doi: 10.1038/s41586-019-1875-y. - DOI - PubMed
    1. Shahbazi MN, Zernicka-Goetz M. Deconstructing and reconstructing the mouse and human early embryo. Nat. Cell Biol. 2018;20:878–887. doi: 10.1038/s41556-018-0144-x. - DOI - PubMed

Publication types