. 2023 Aug;4(8):1102-1121.
doi: 10.1038/s43018-023-00594-z. Epub 2023 Jul 17.

The Akt/mTOR and MNK/eIF4E pathways rewire the prostate cancer translatome to secrete HGF, SPP1 and BGN and recruit suppressive myeloid cells

Affiliations

The Akt/mTOR and MNK/eIF4E pathways rewire the prostate cancer translatome to secrete HGF, SPP1 and BGN and recruit suppressive myeloid cells

Daniela Brina et al. Nat Cancer. 2023 Aug.

Abstract

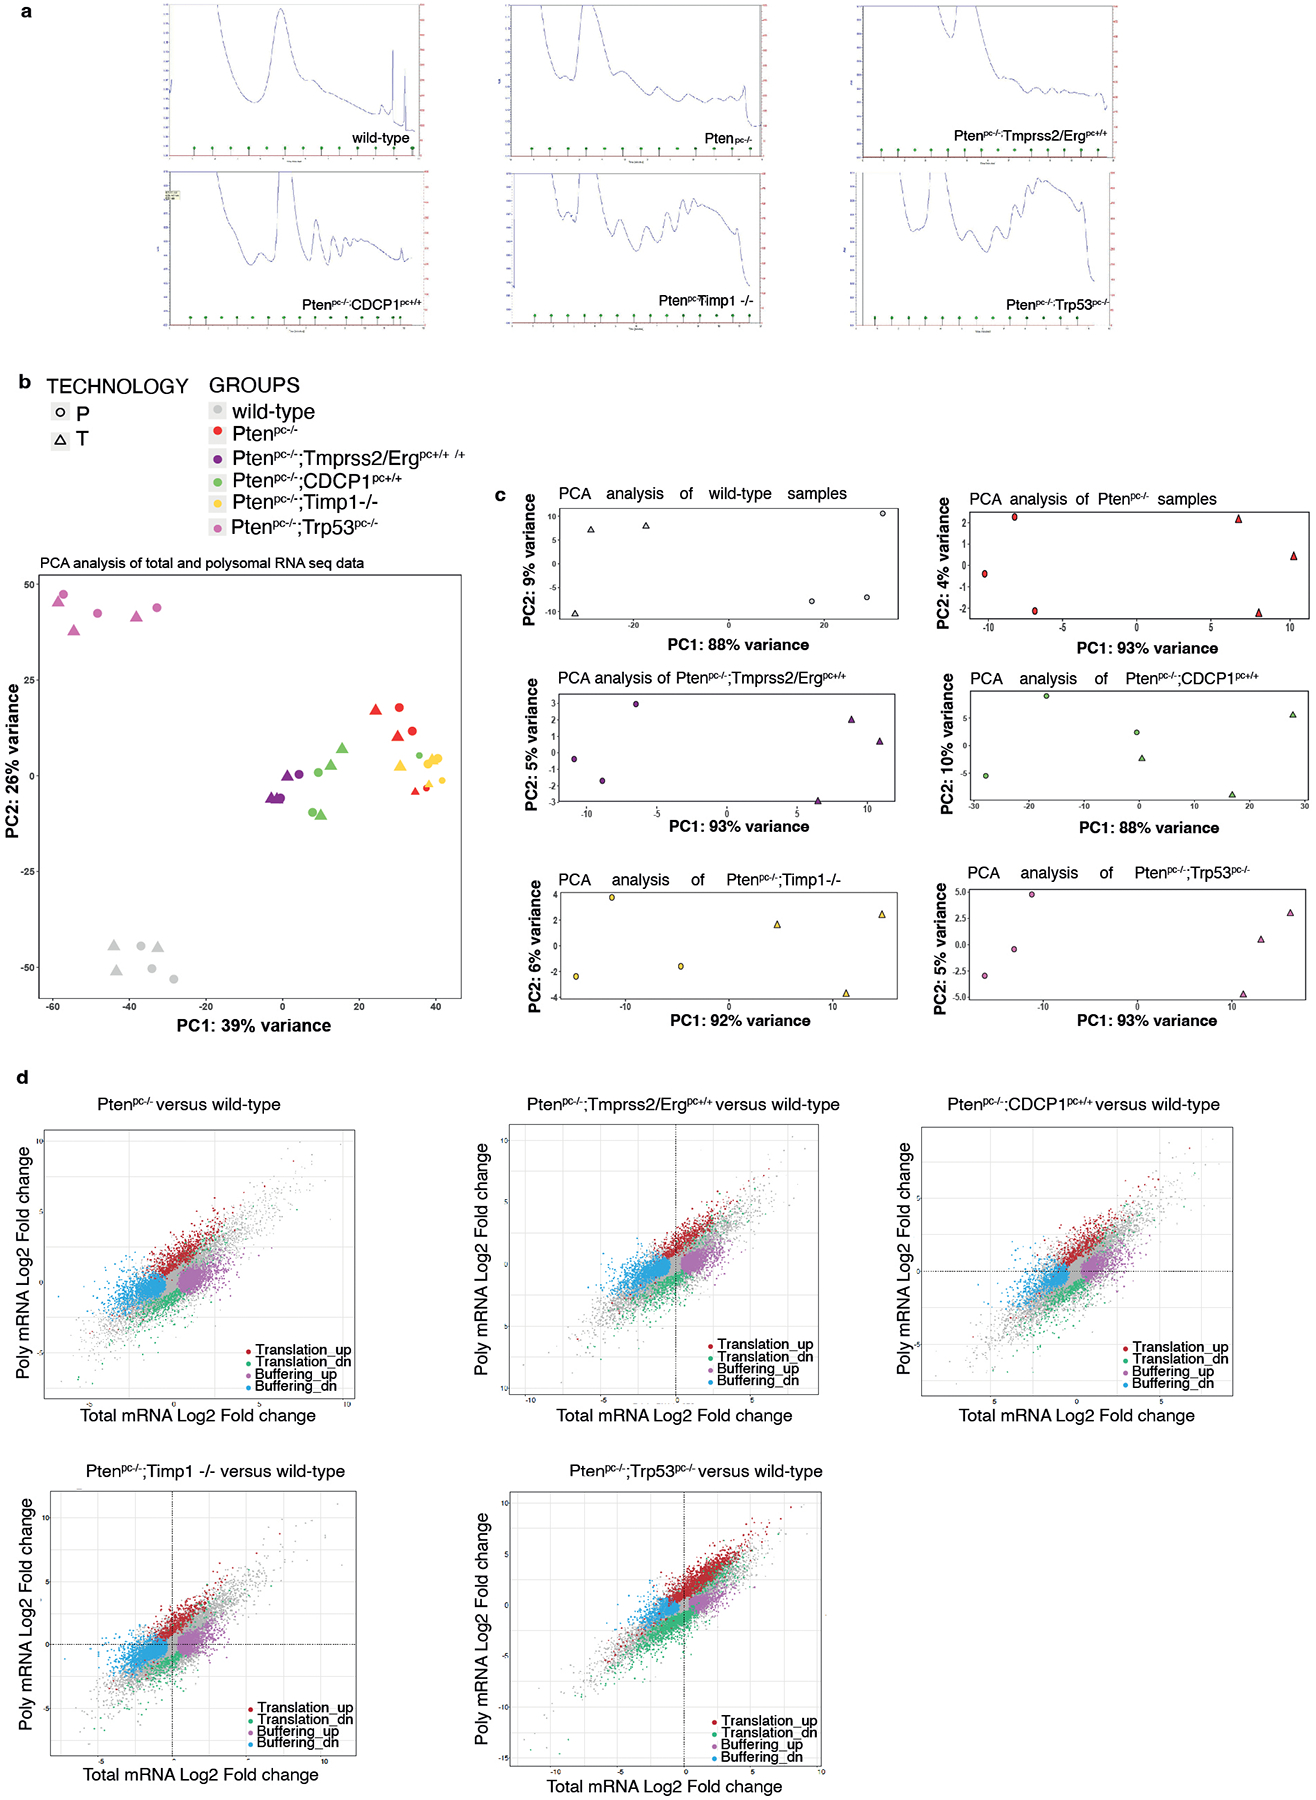
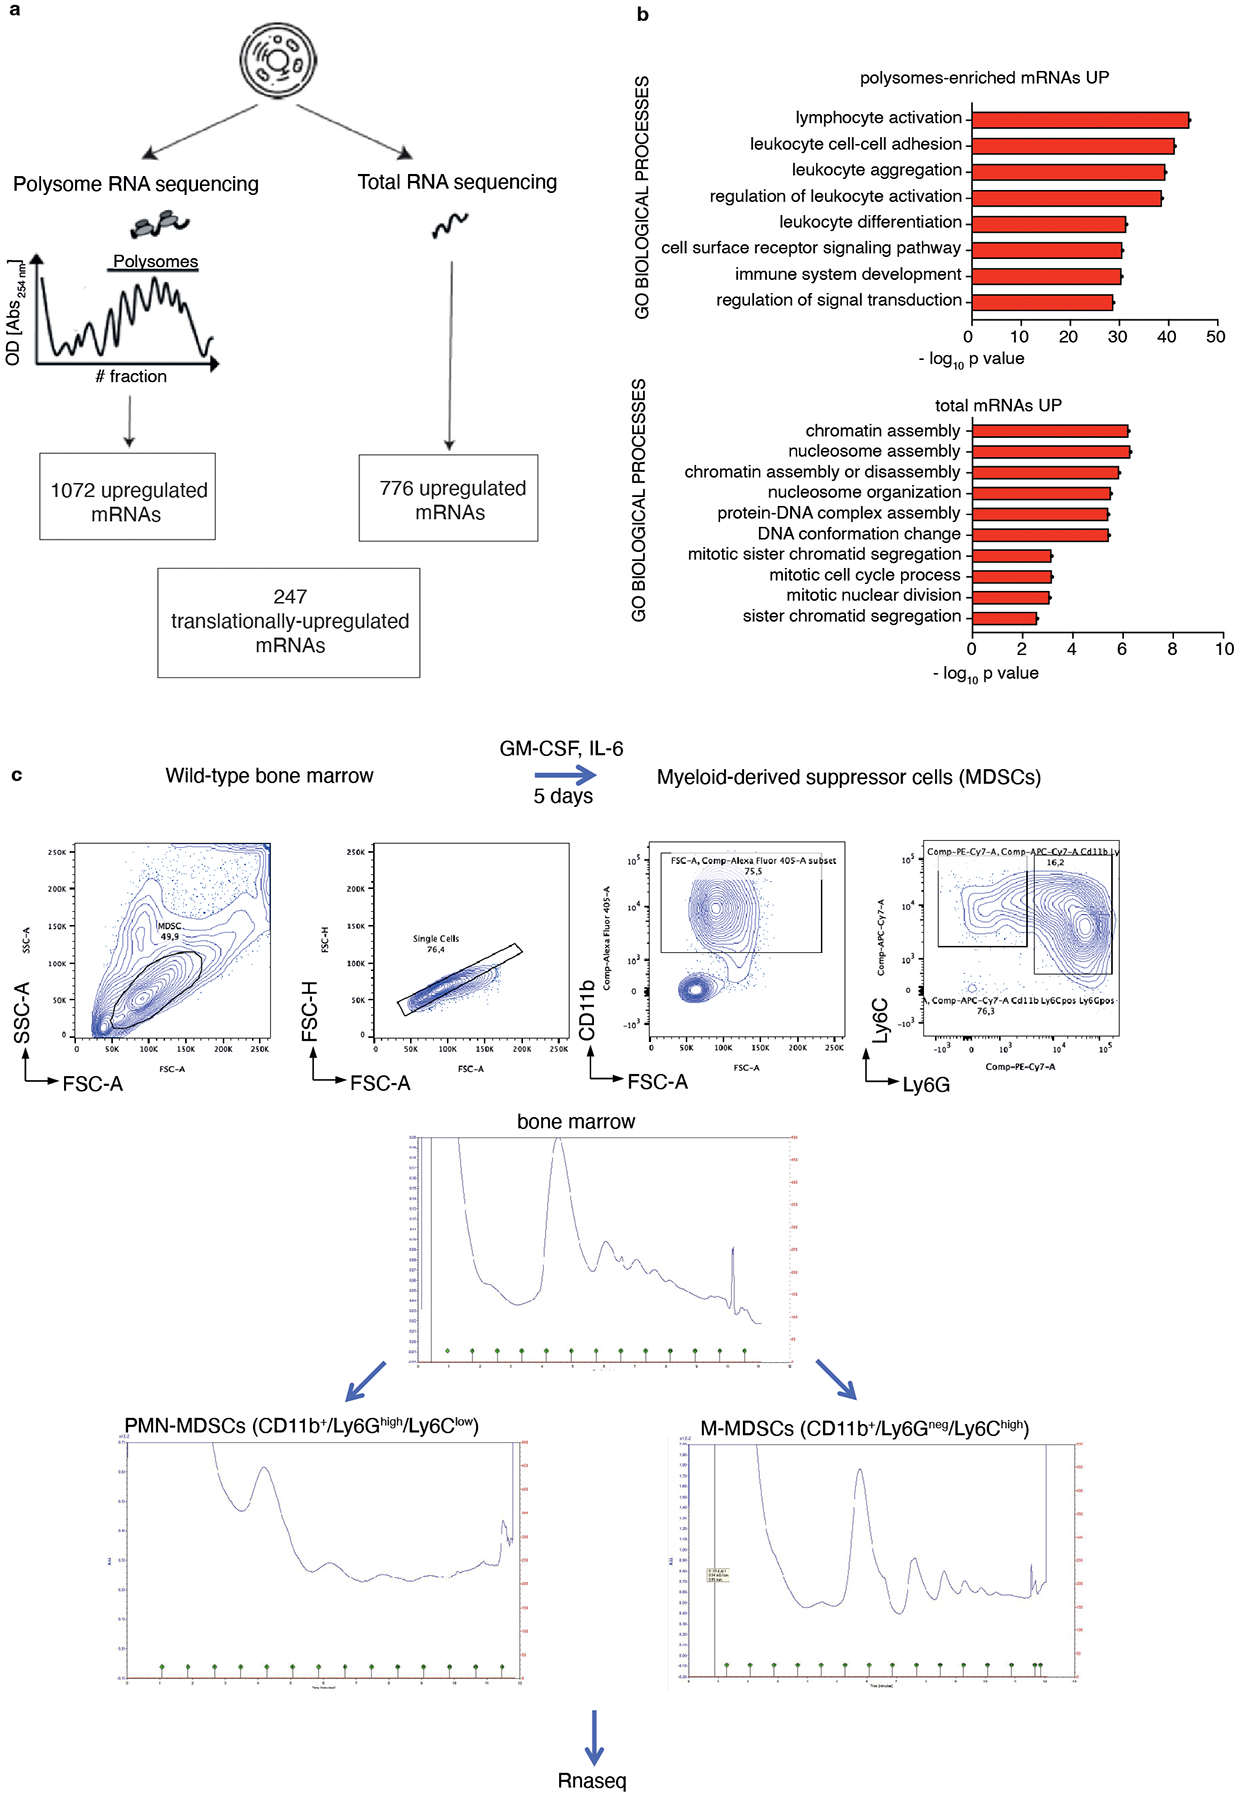
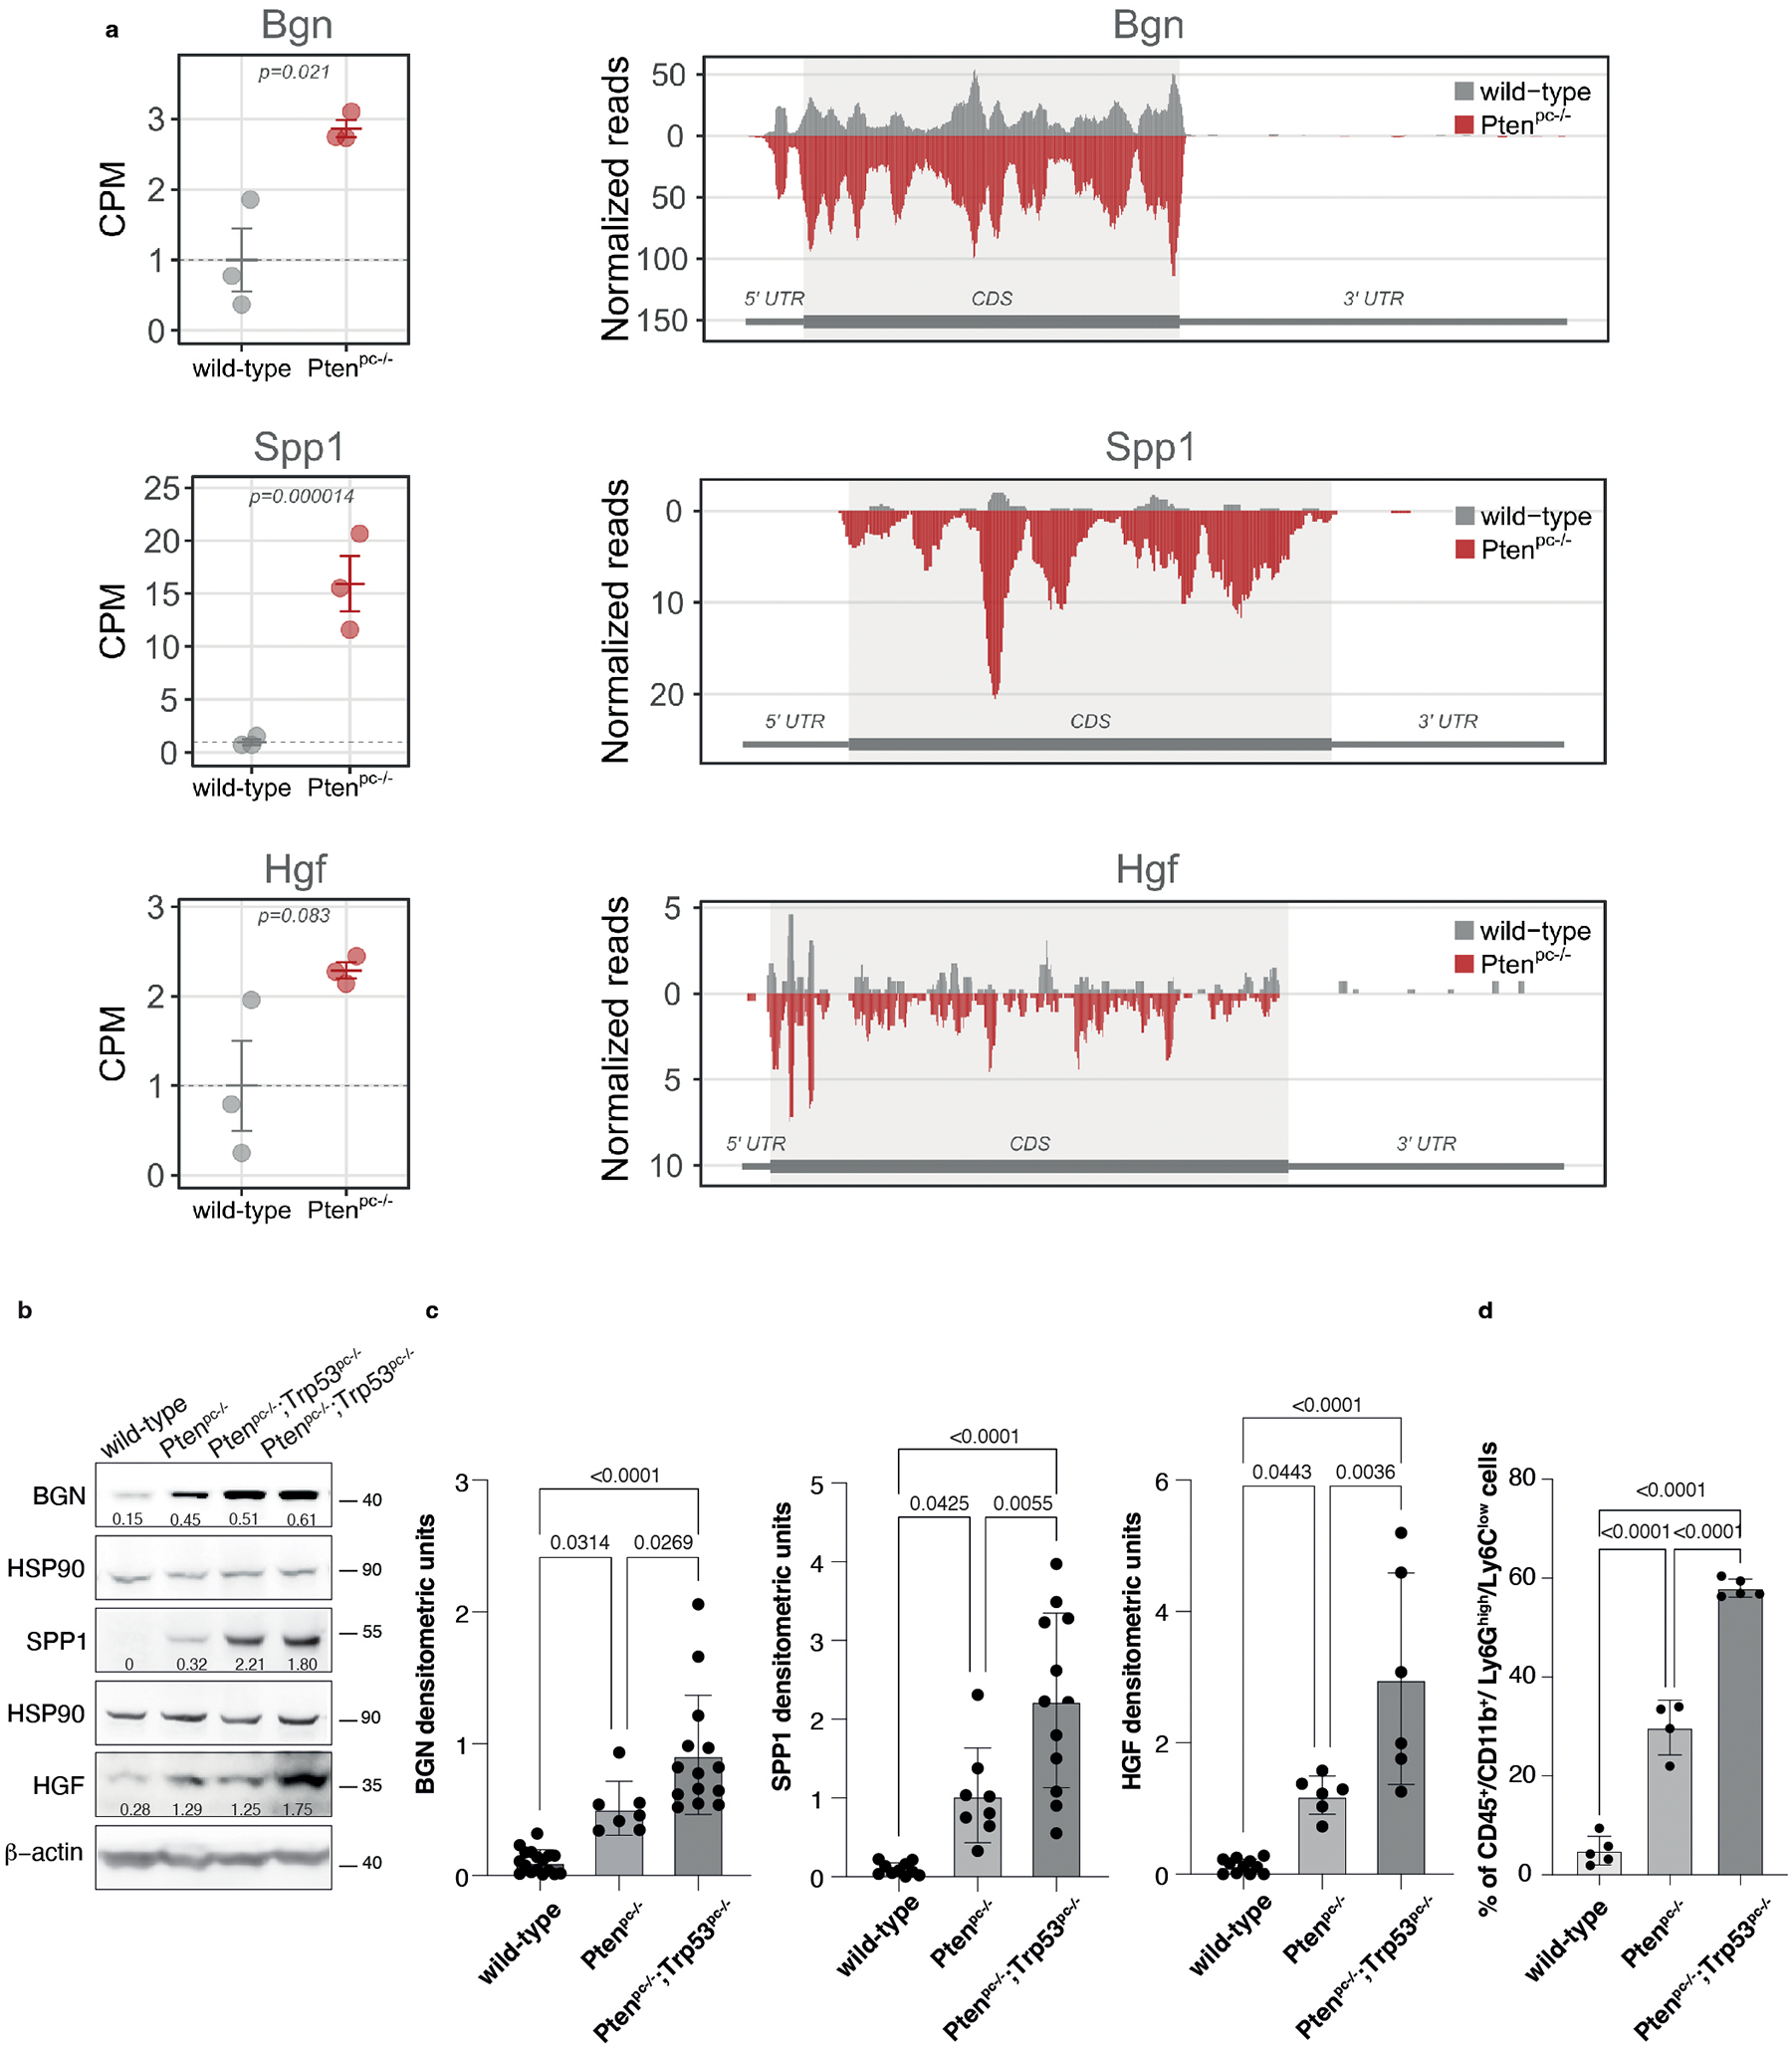
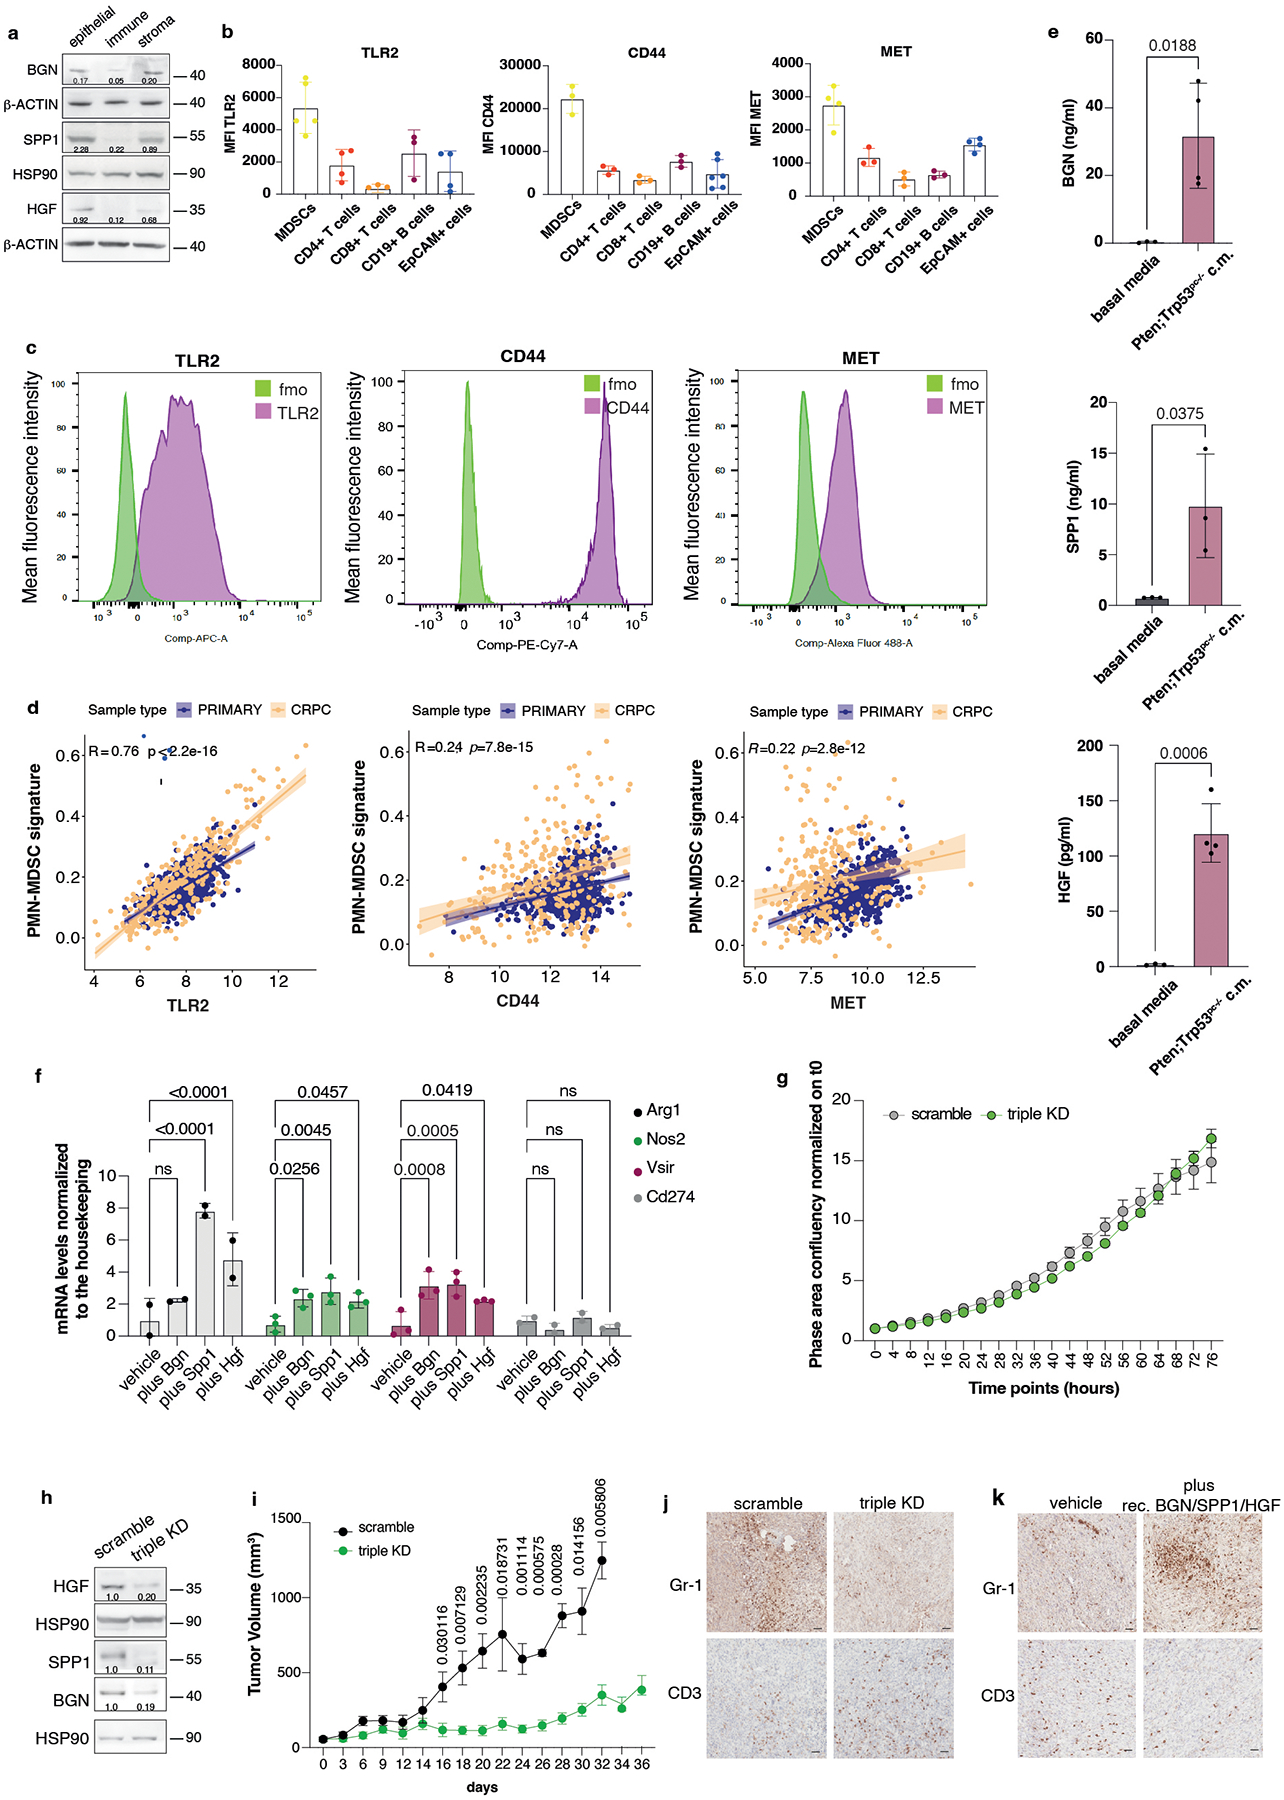
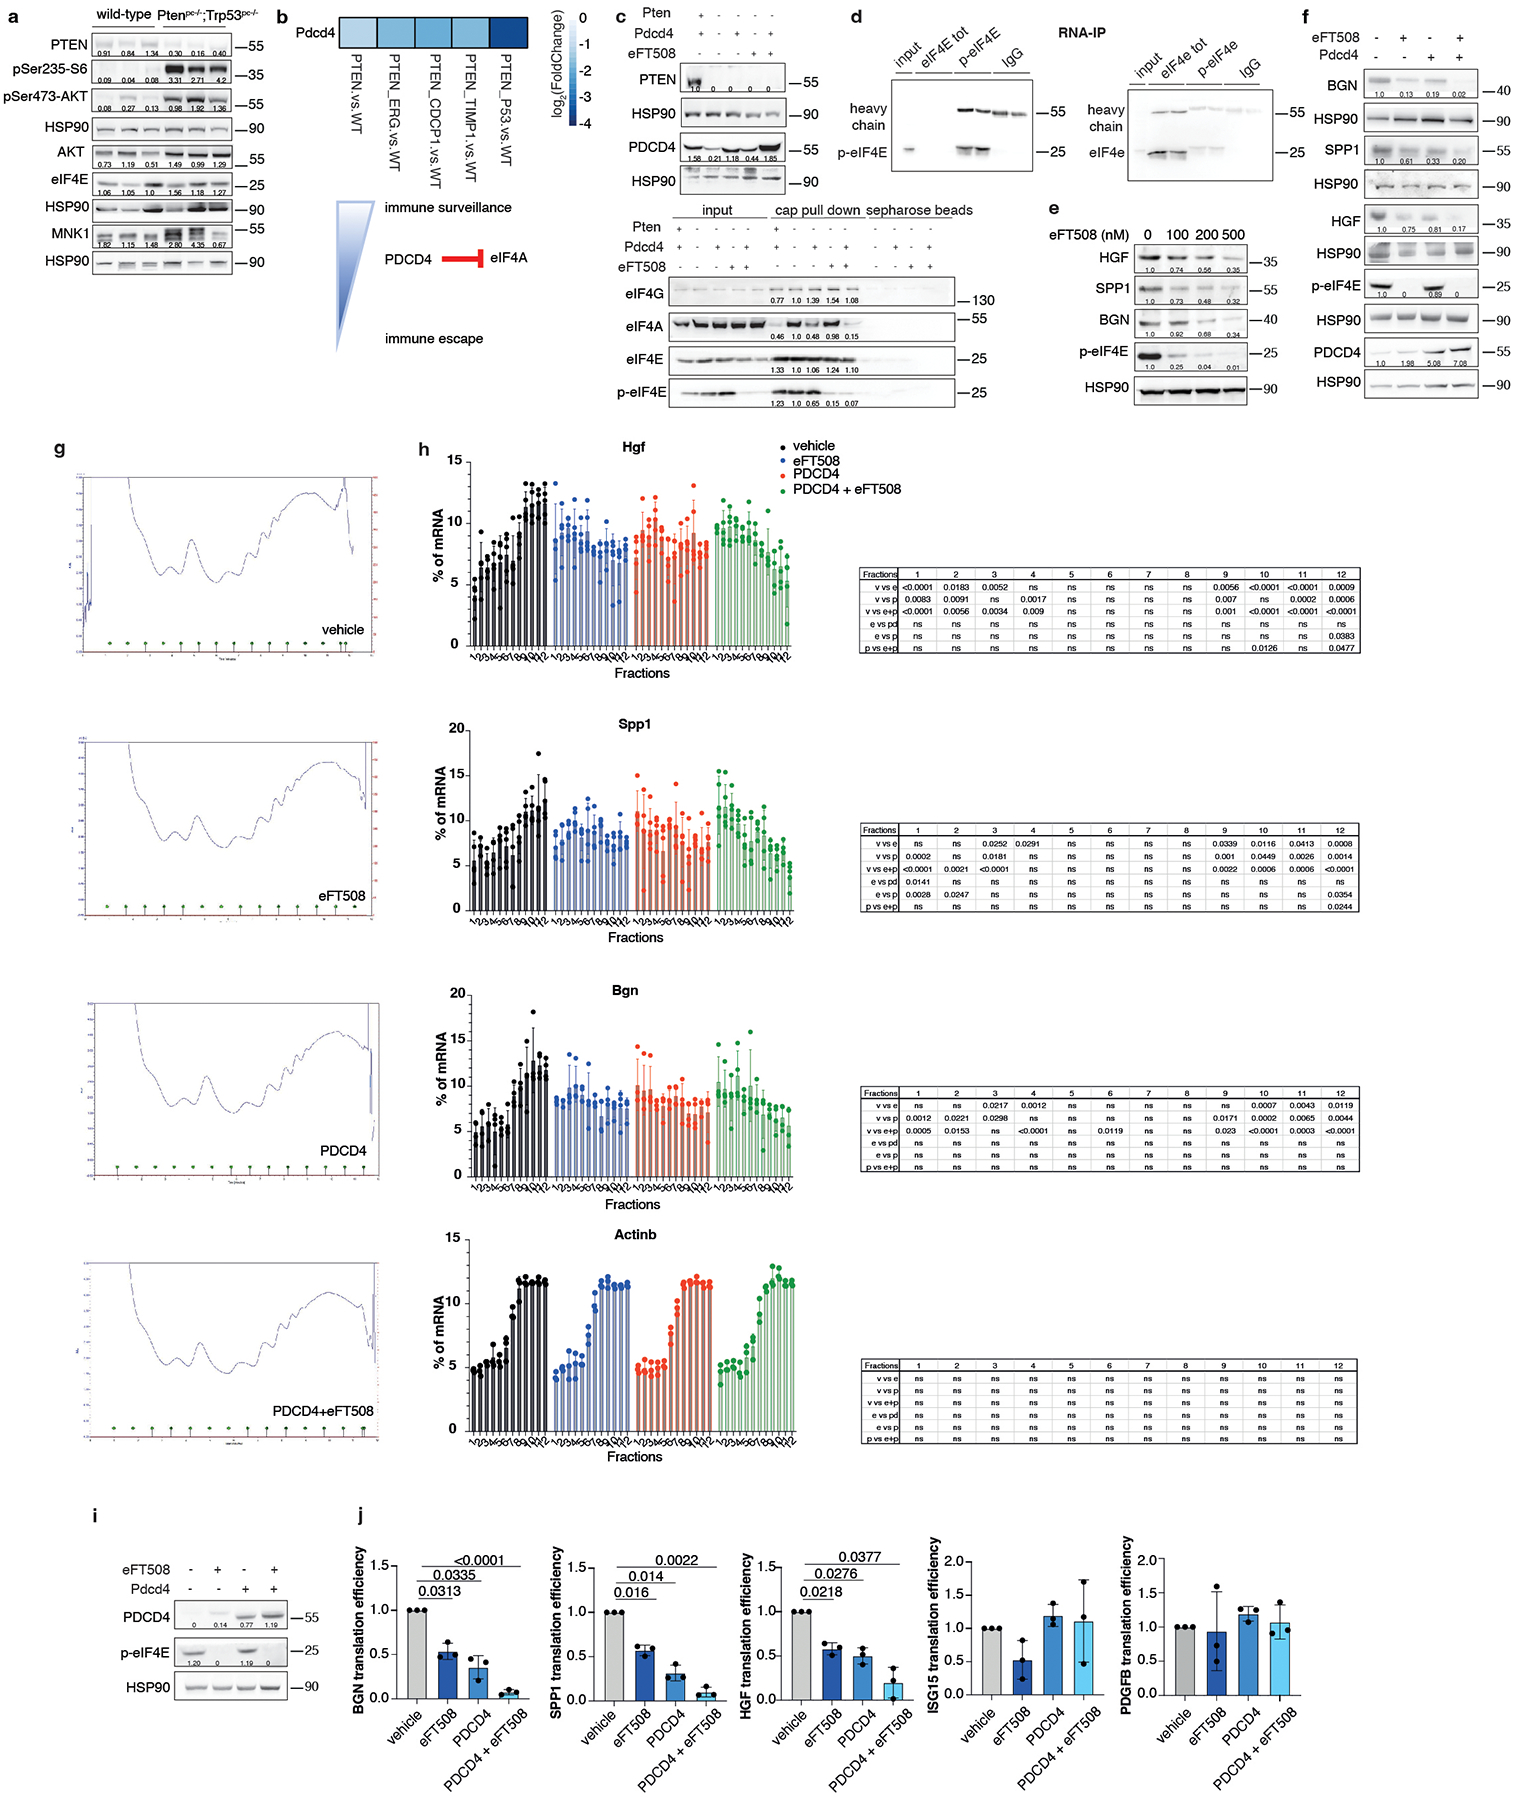
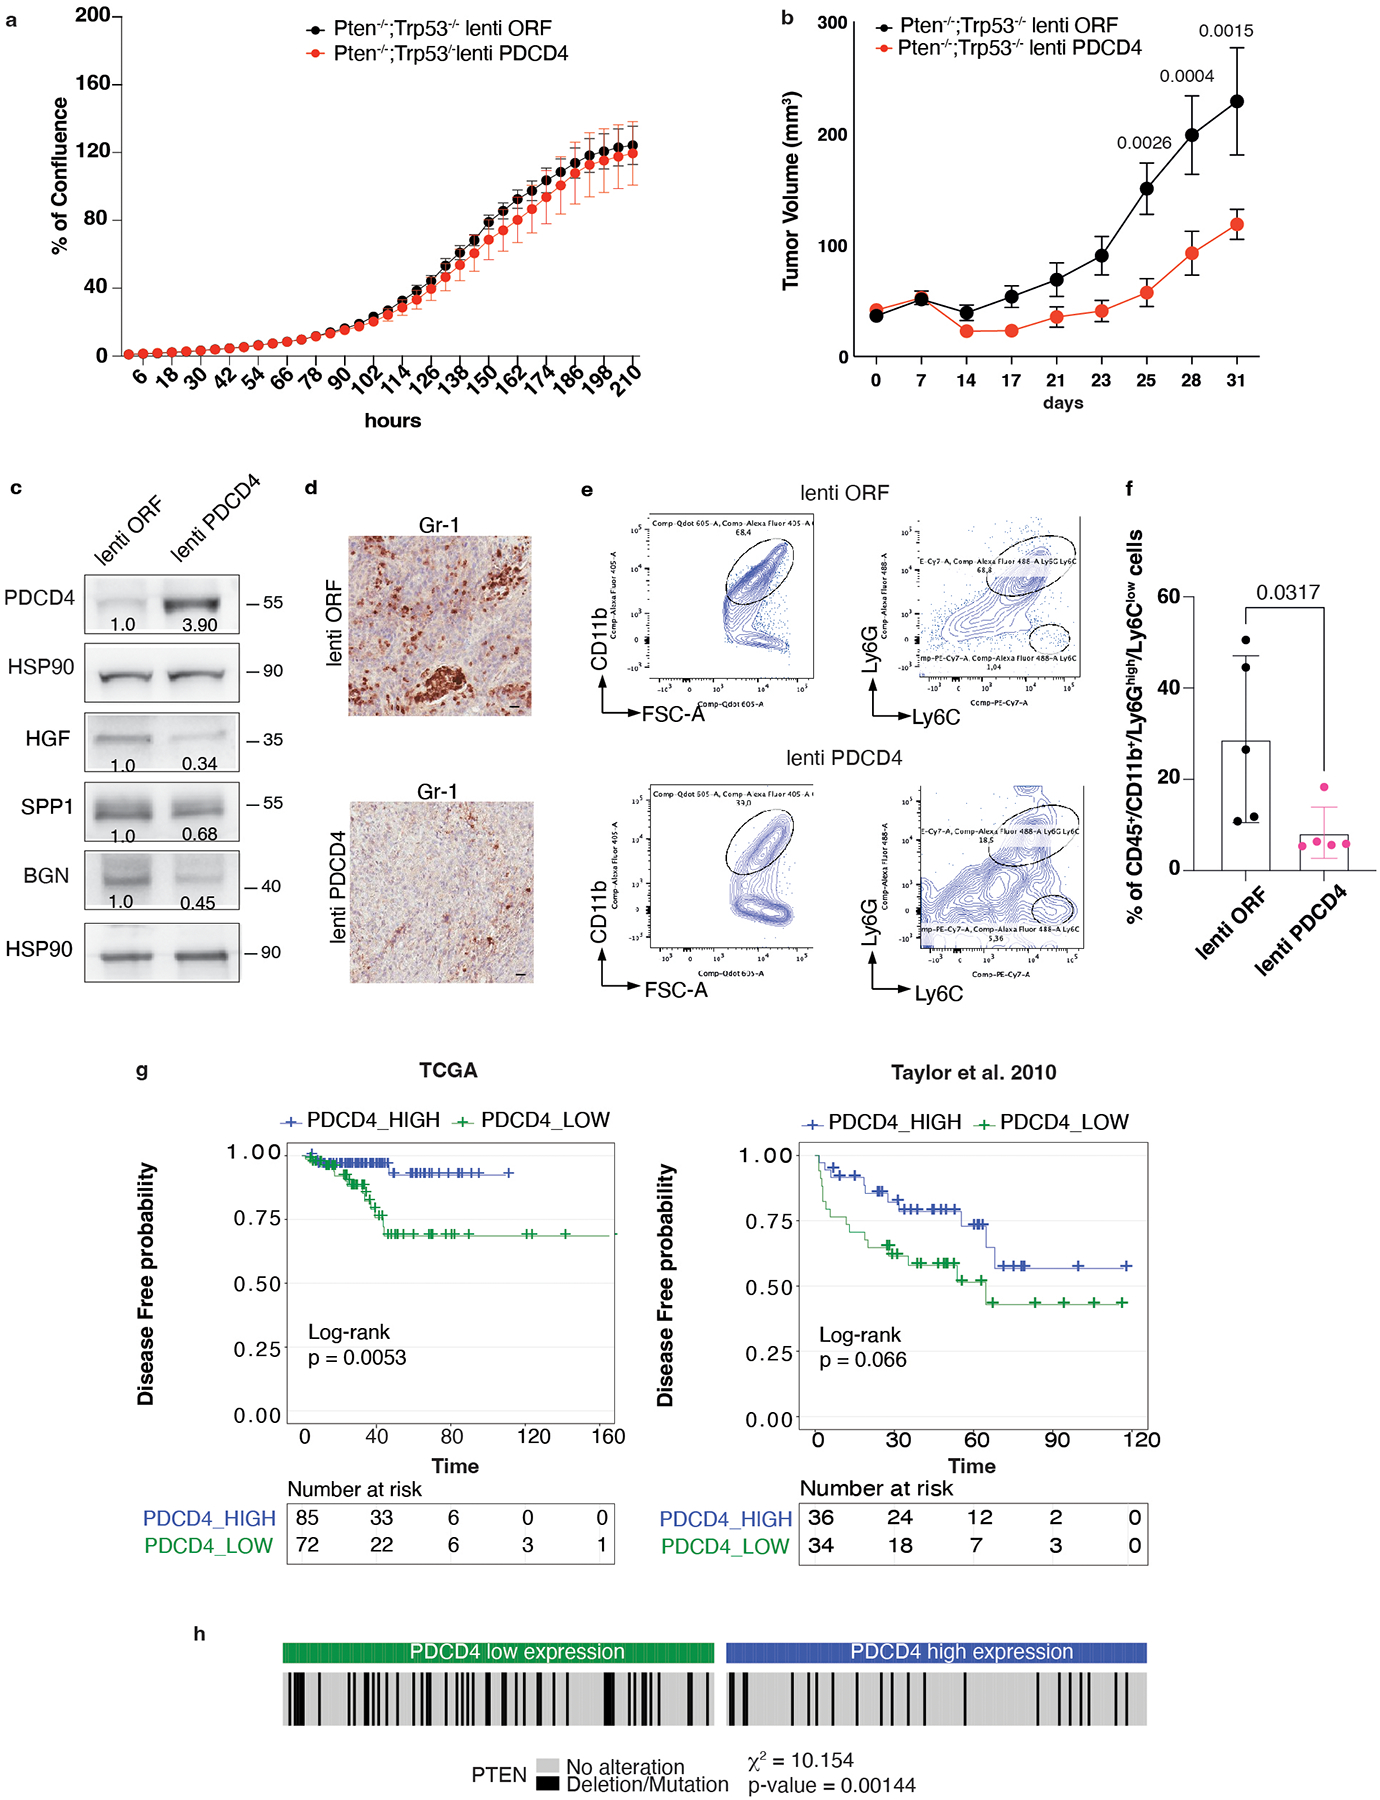
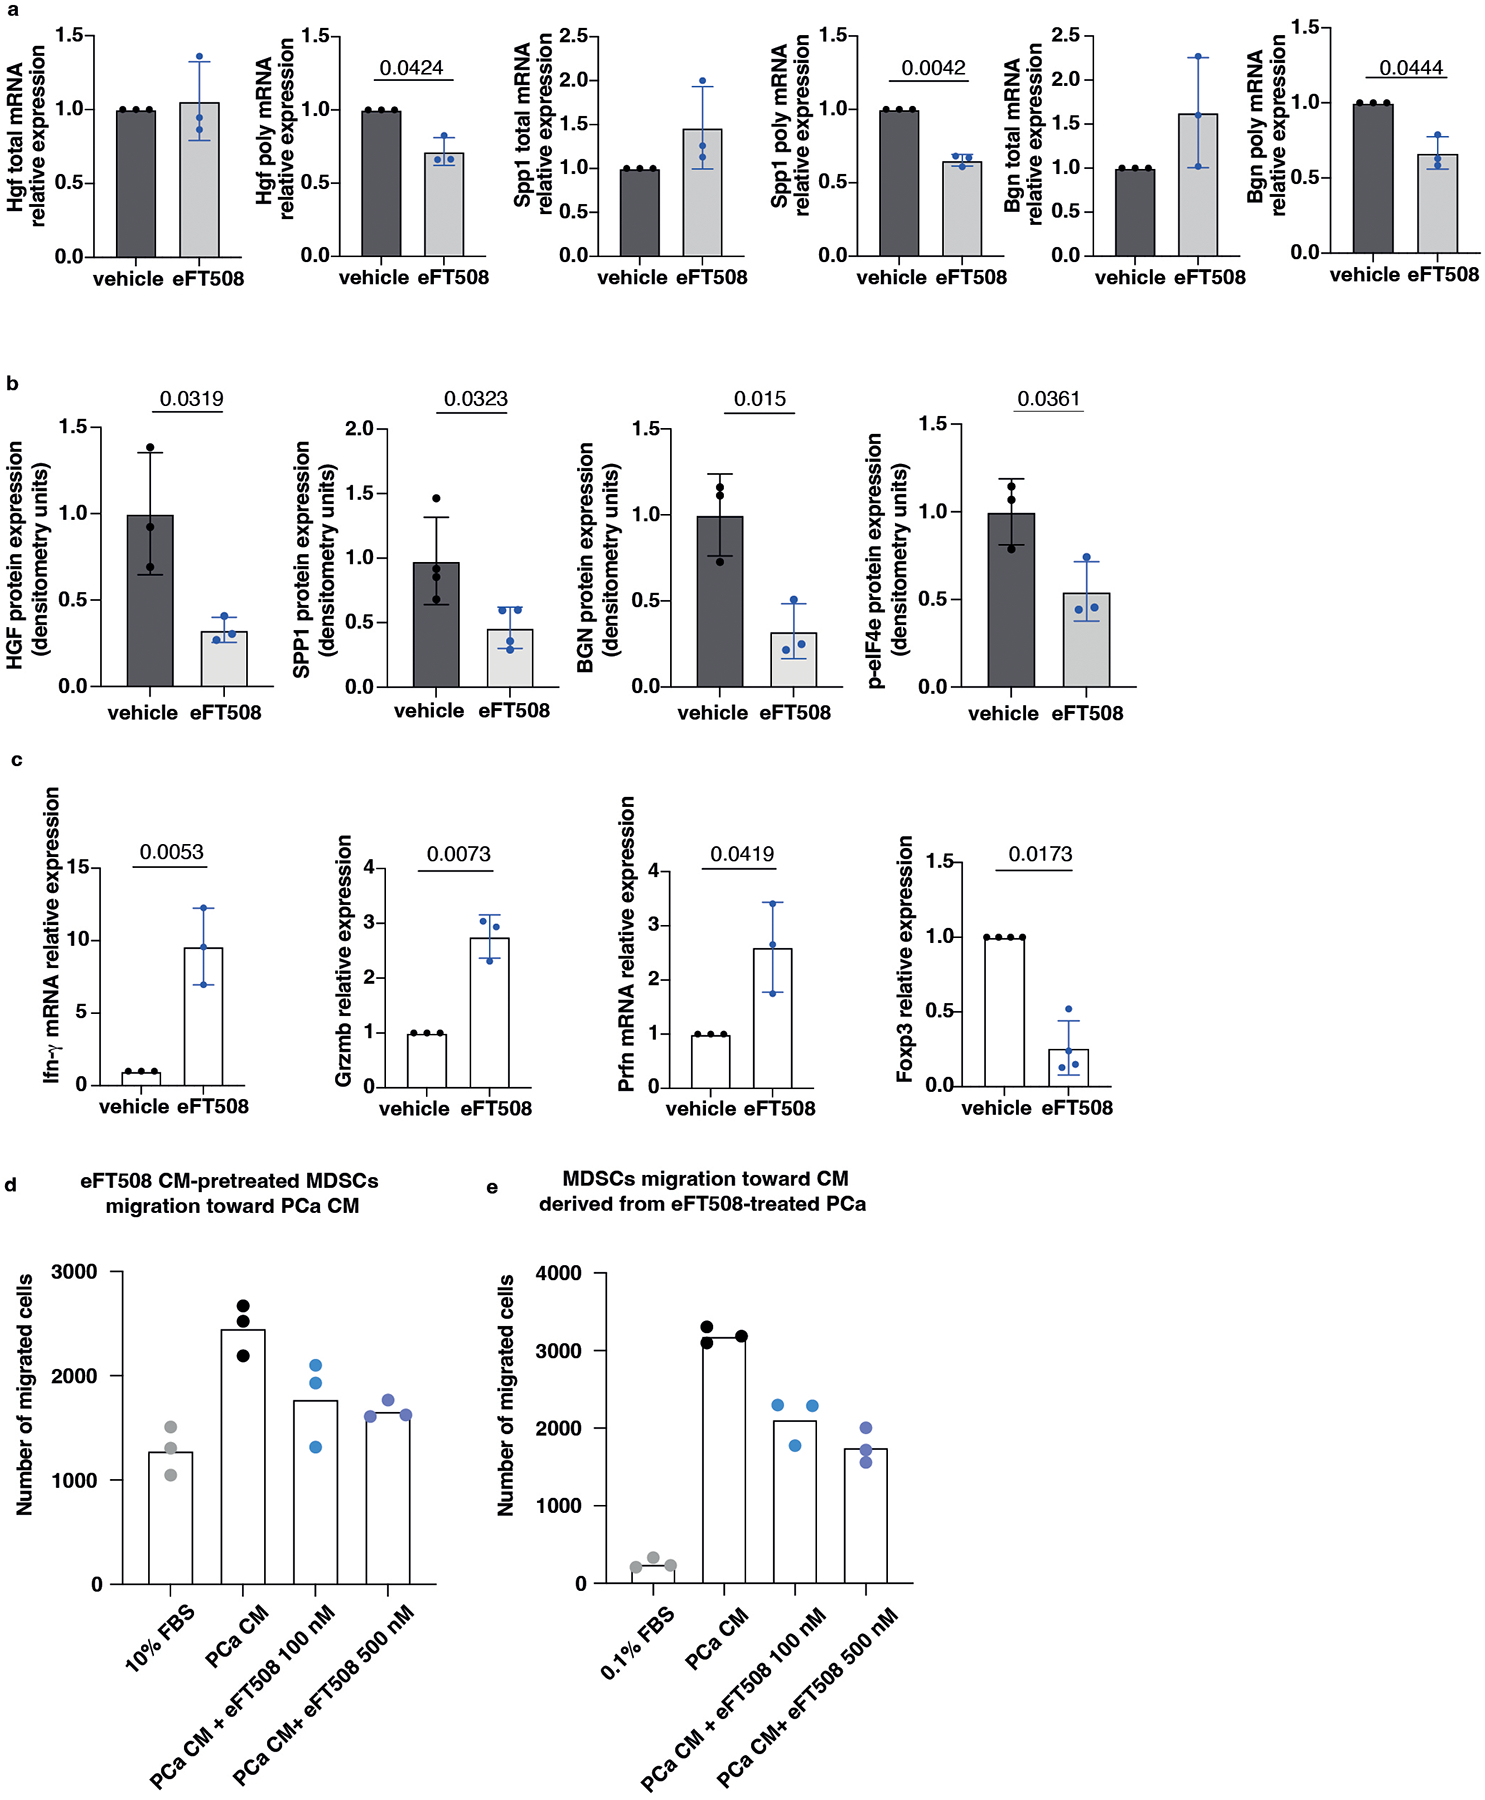
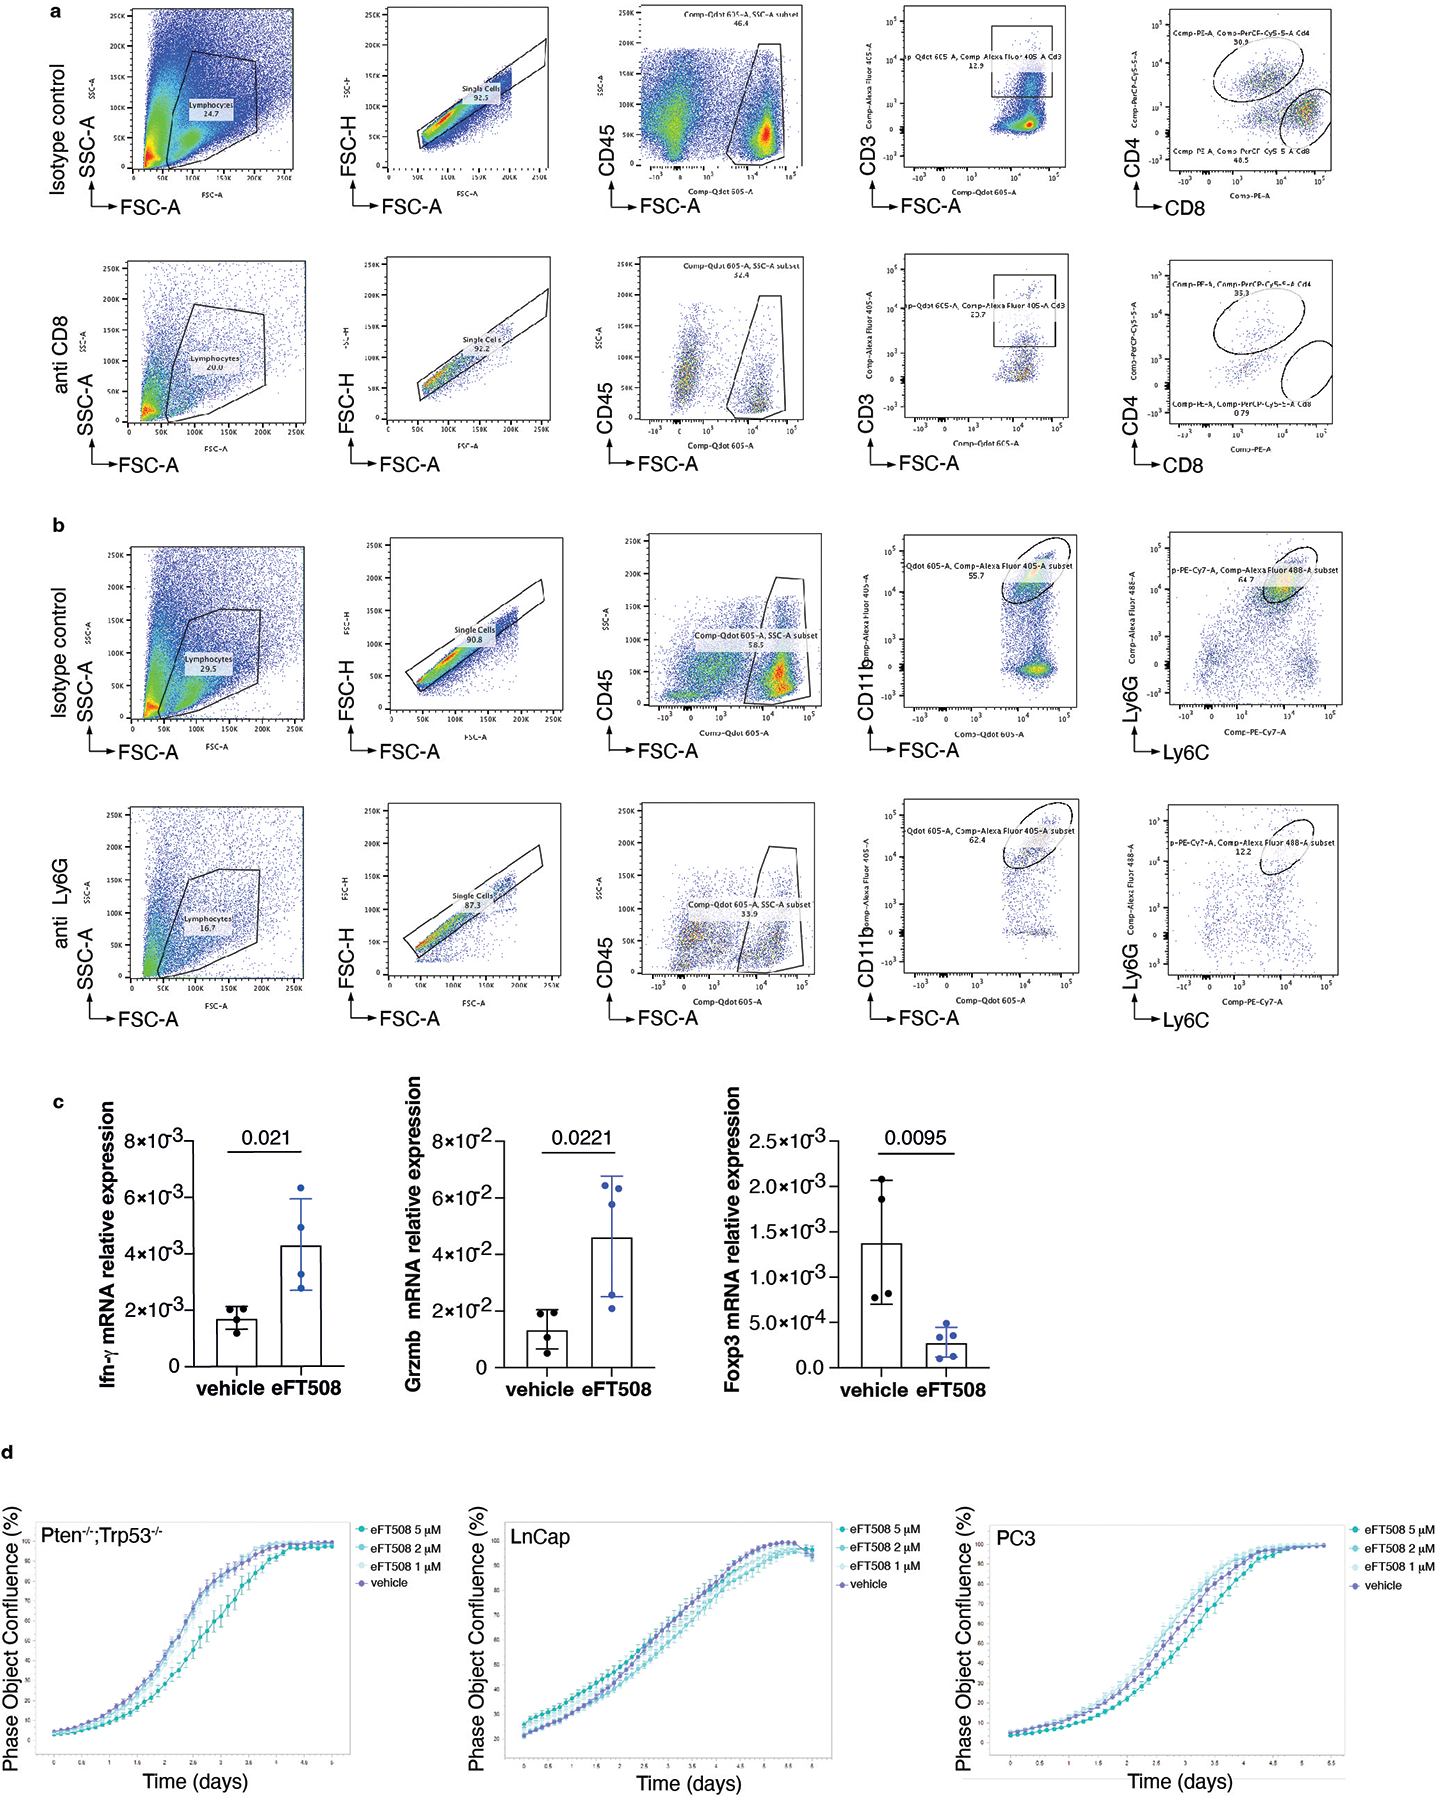
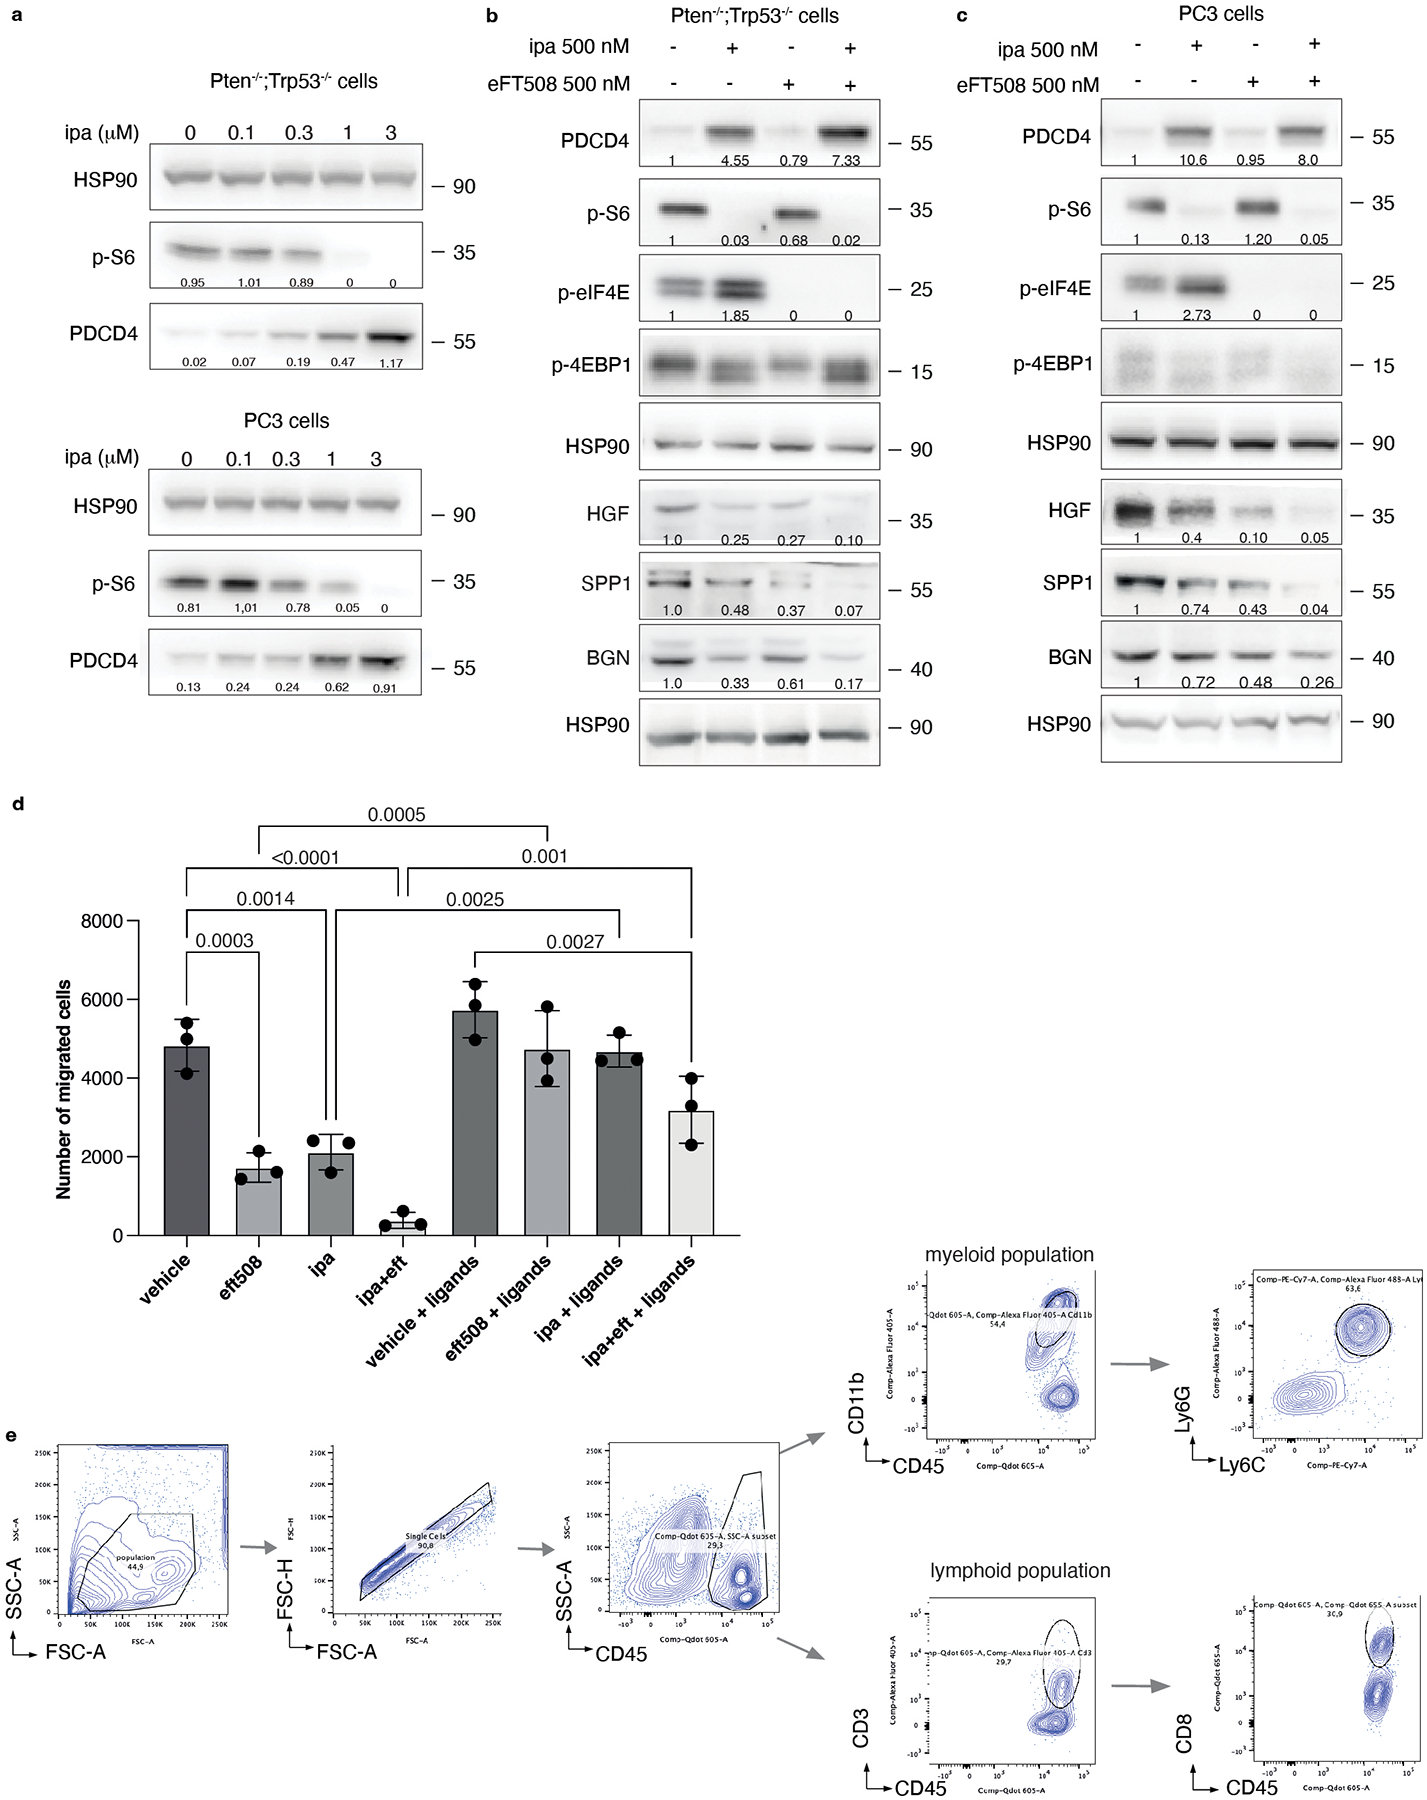
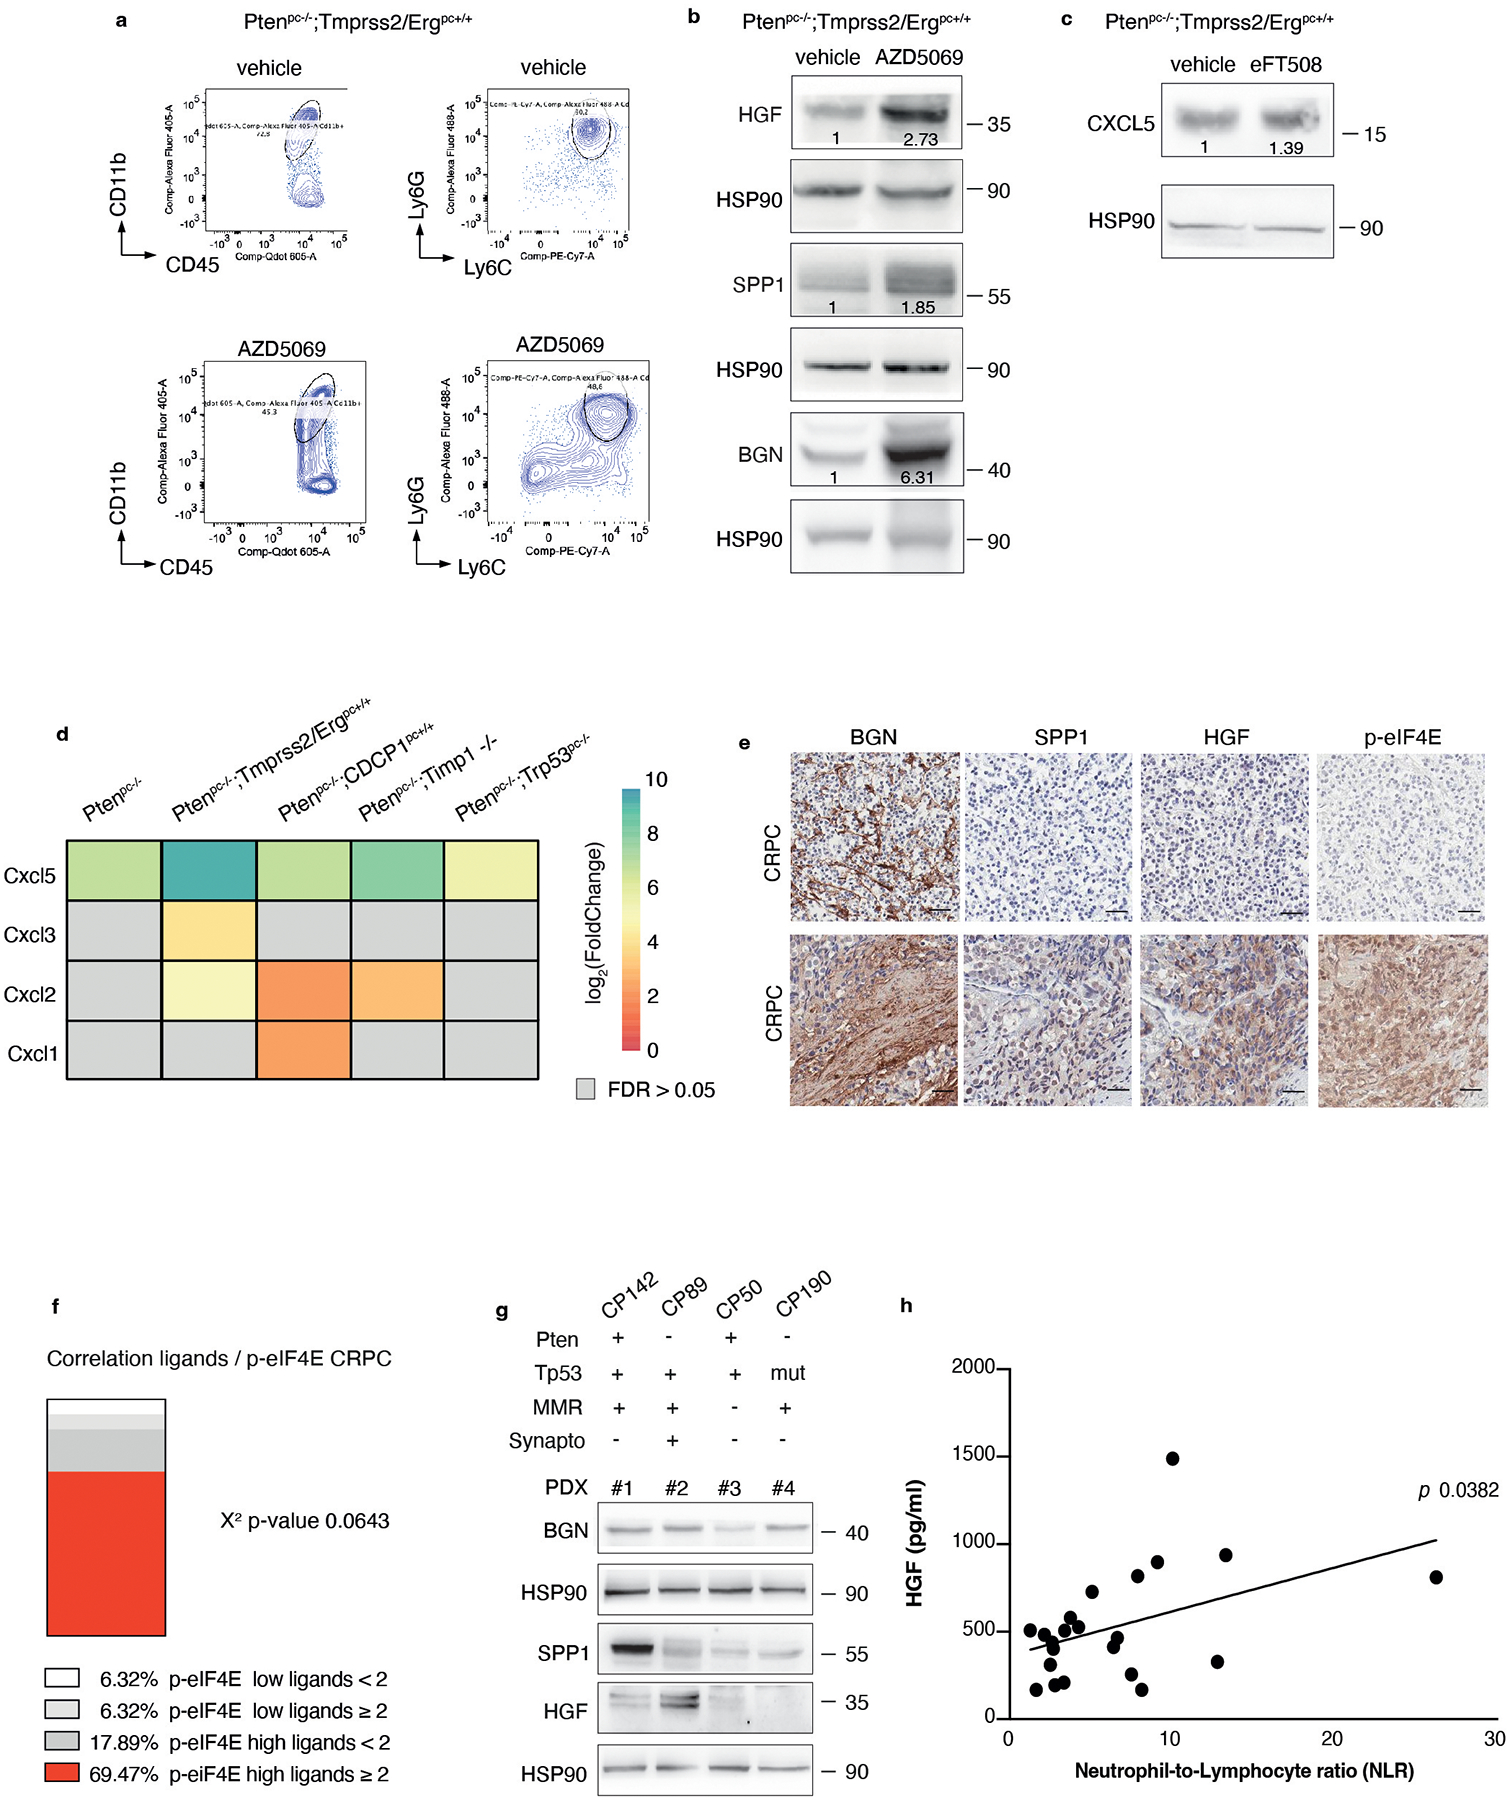
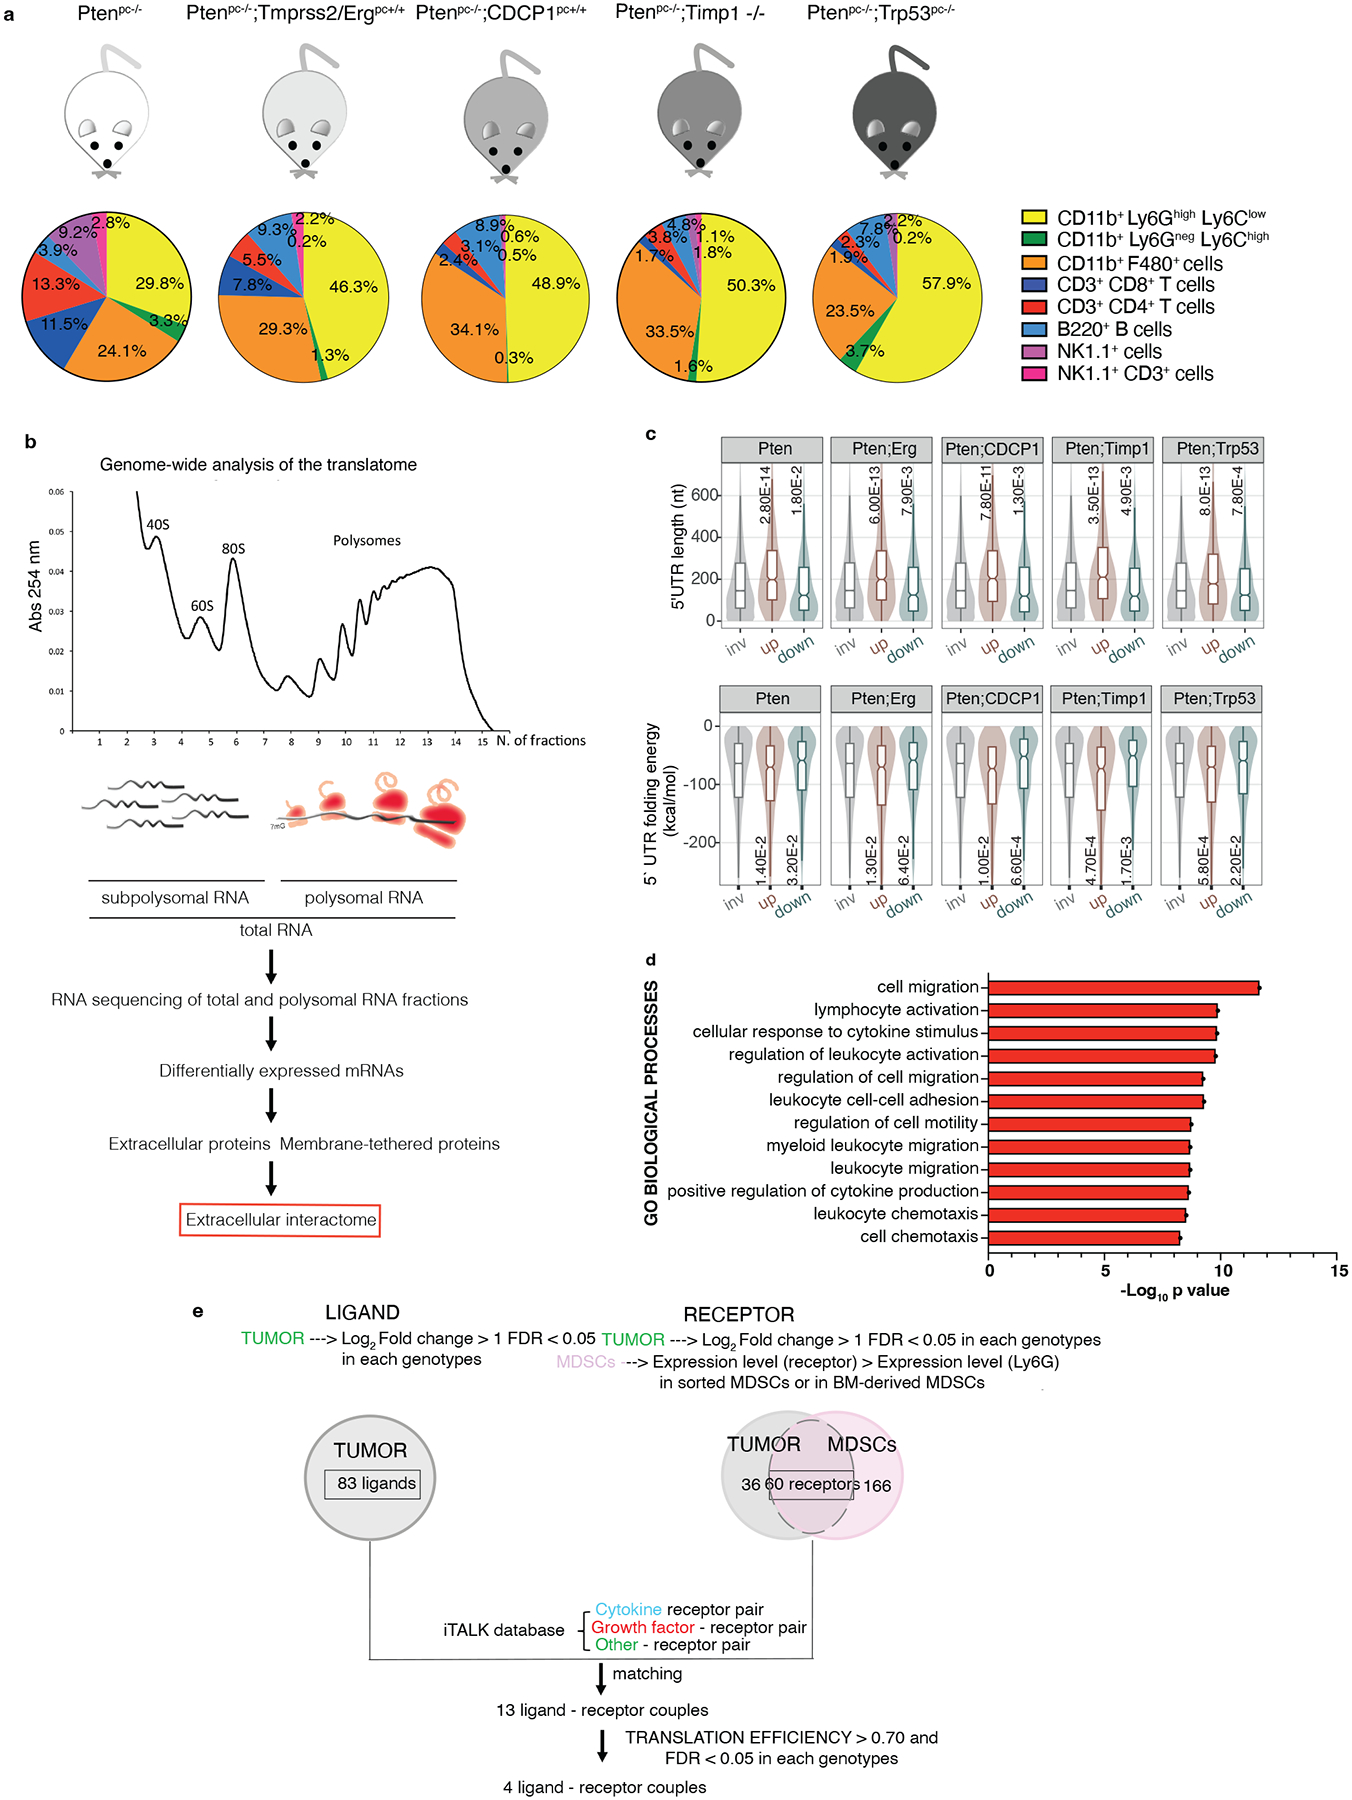
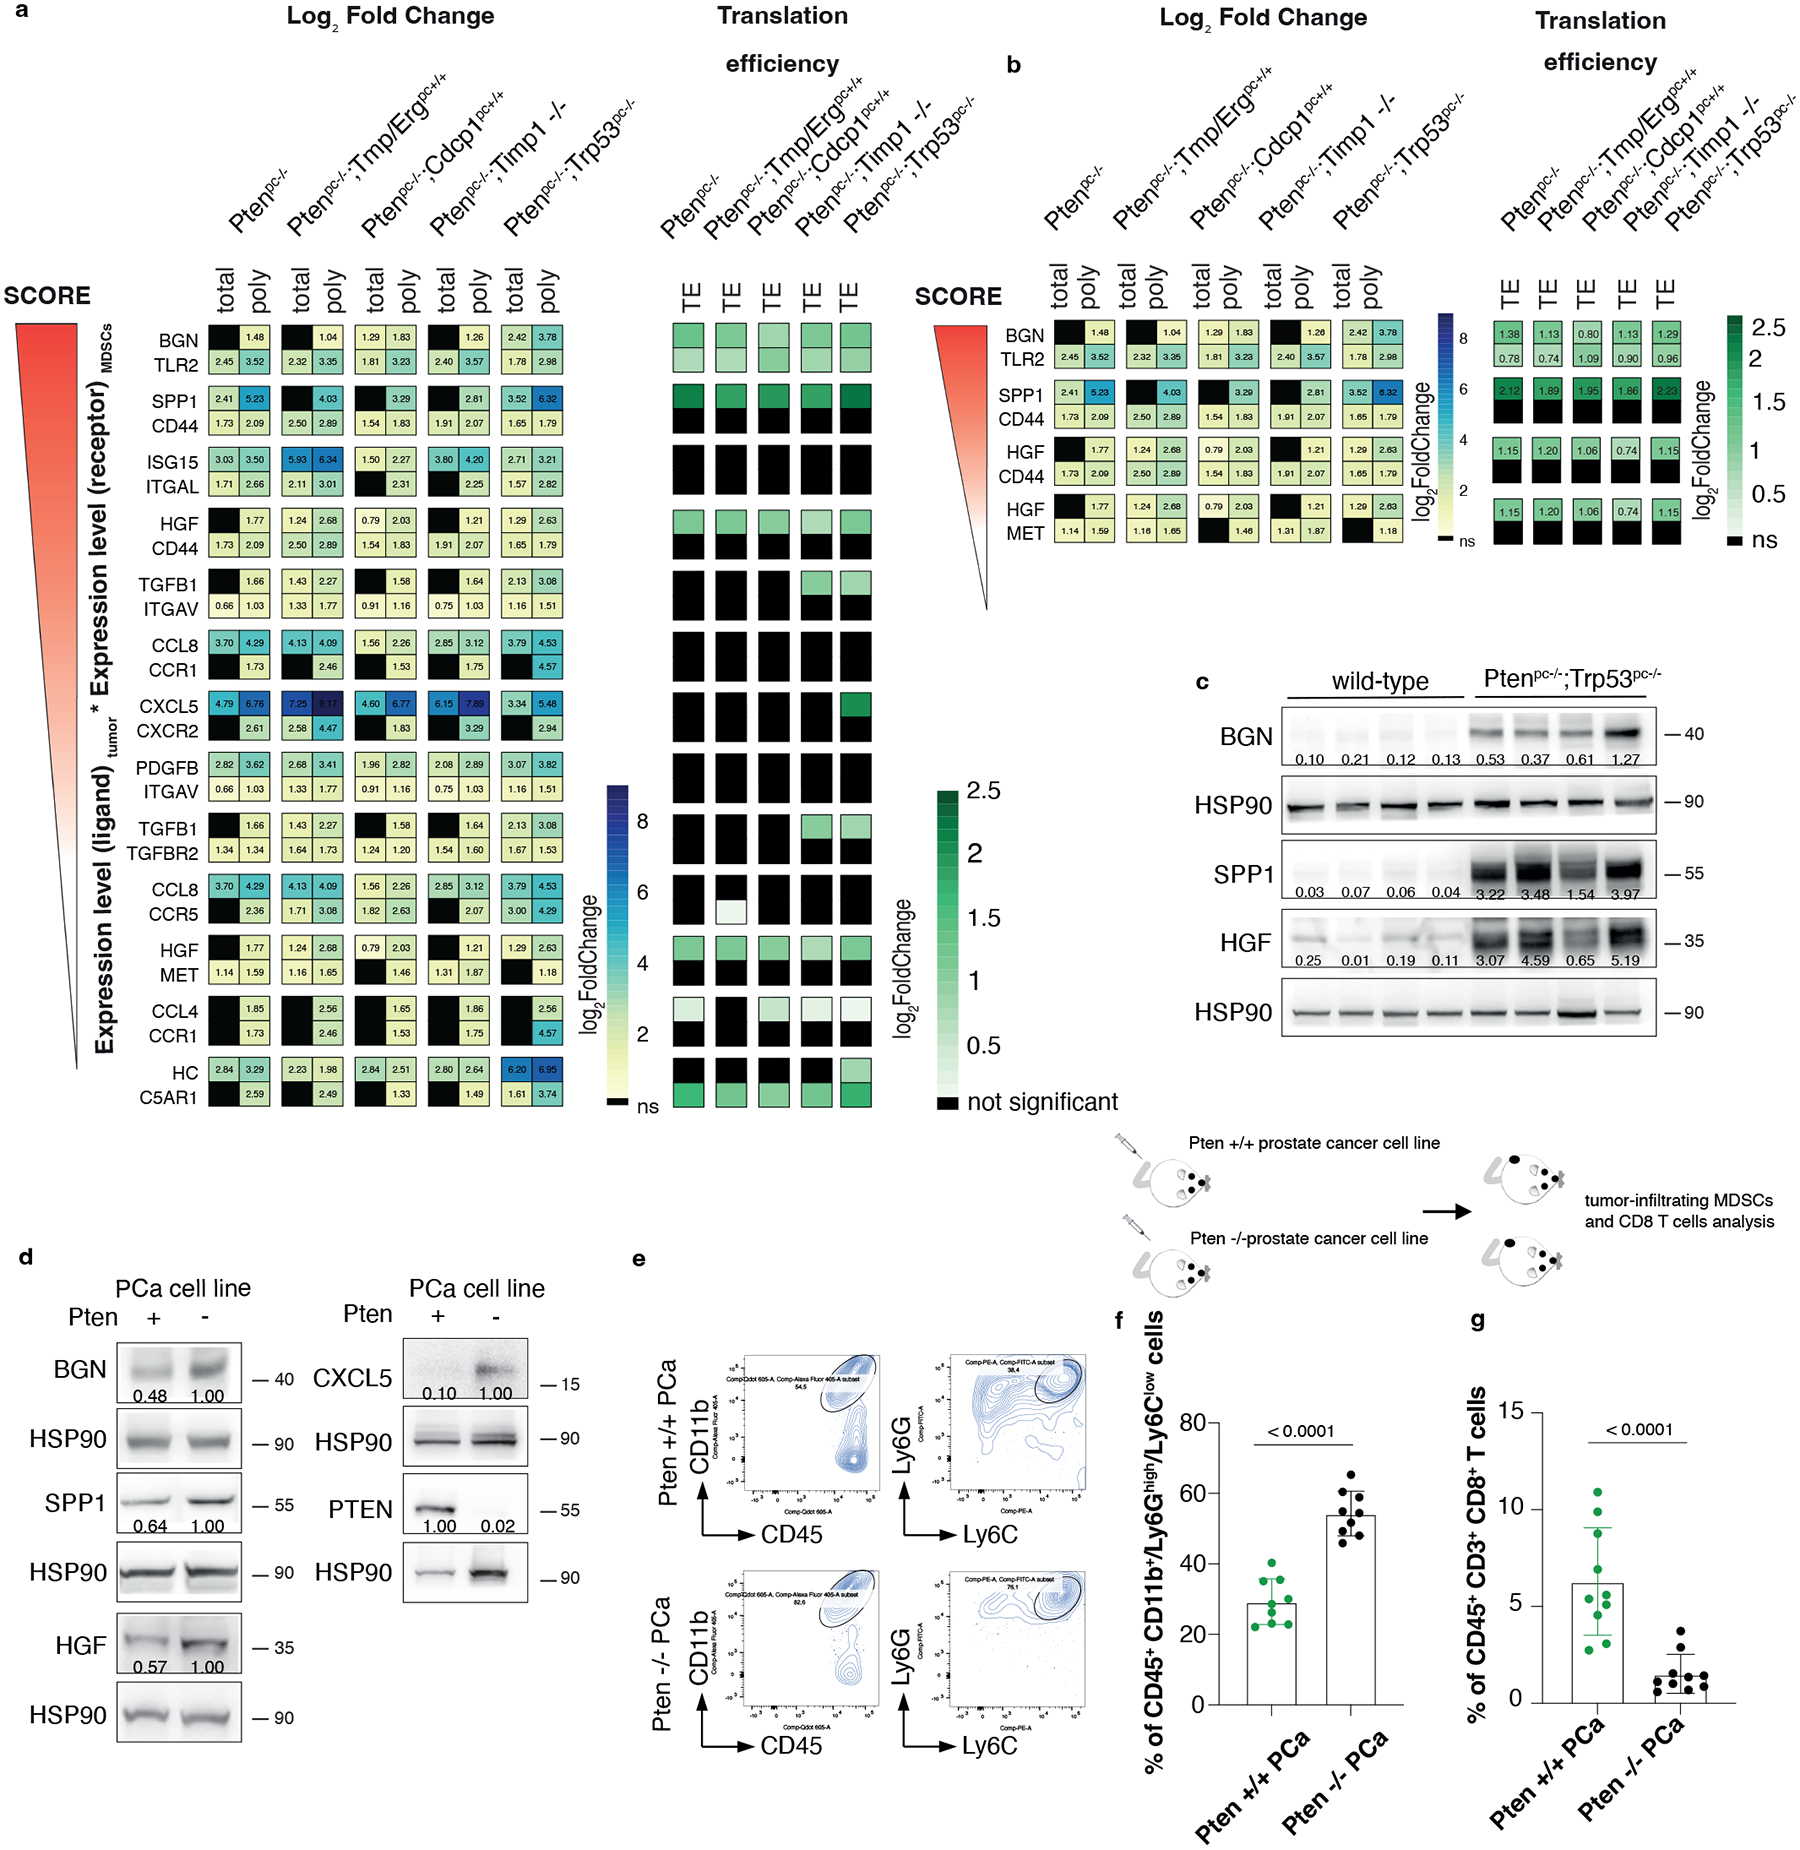
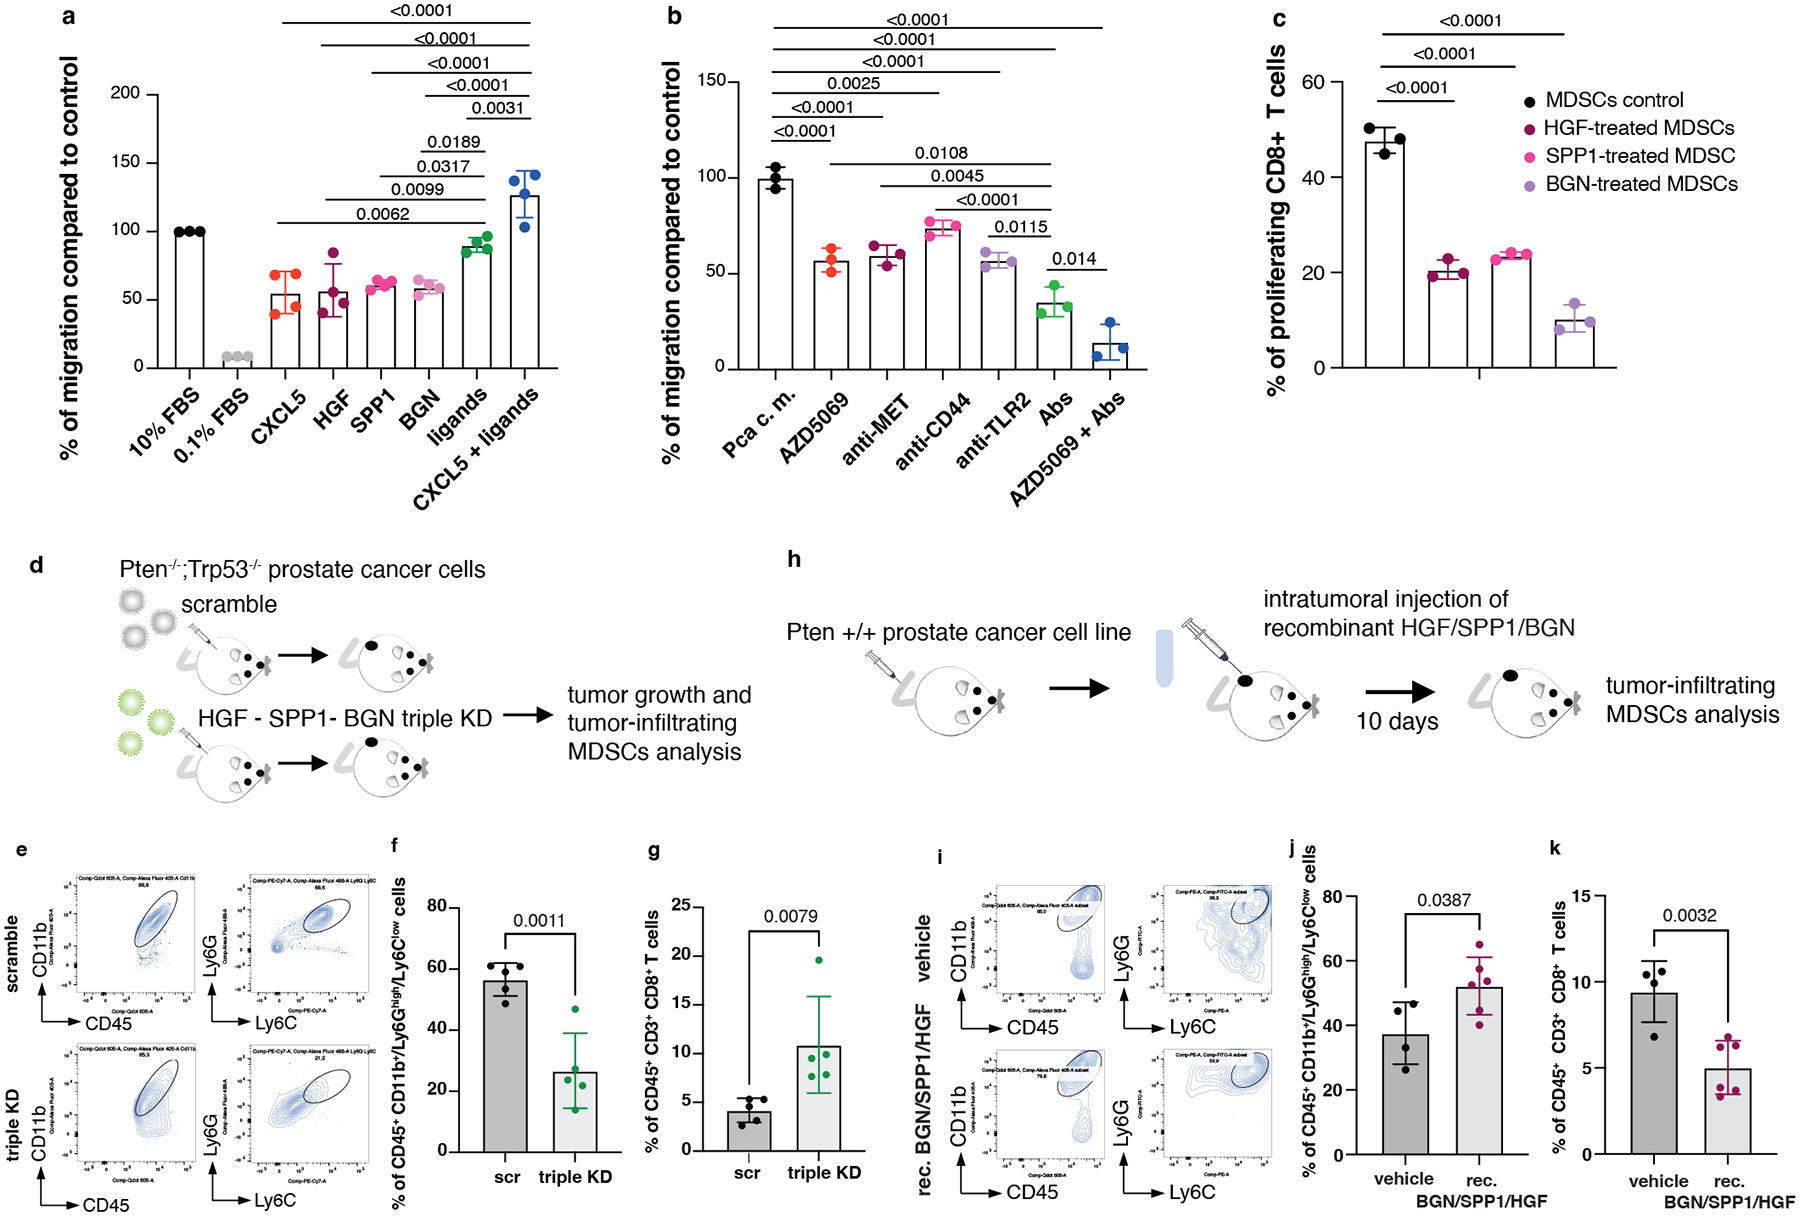
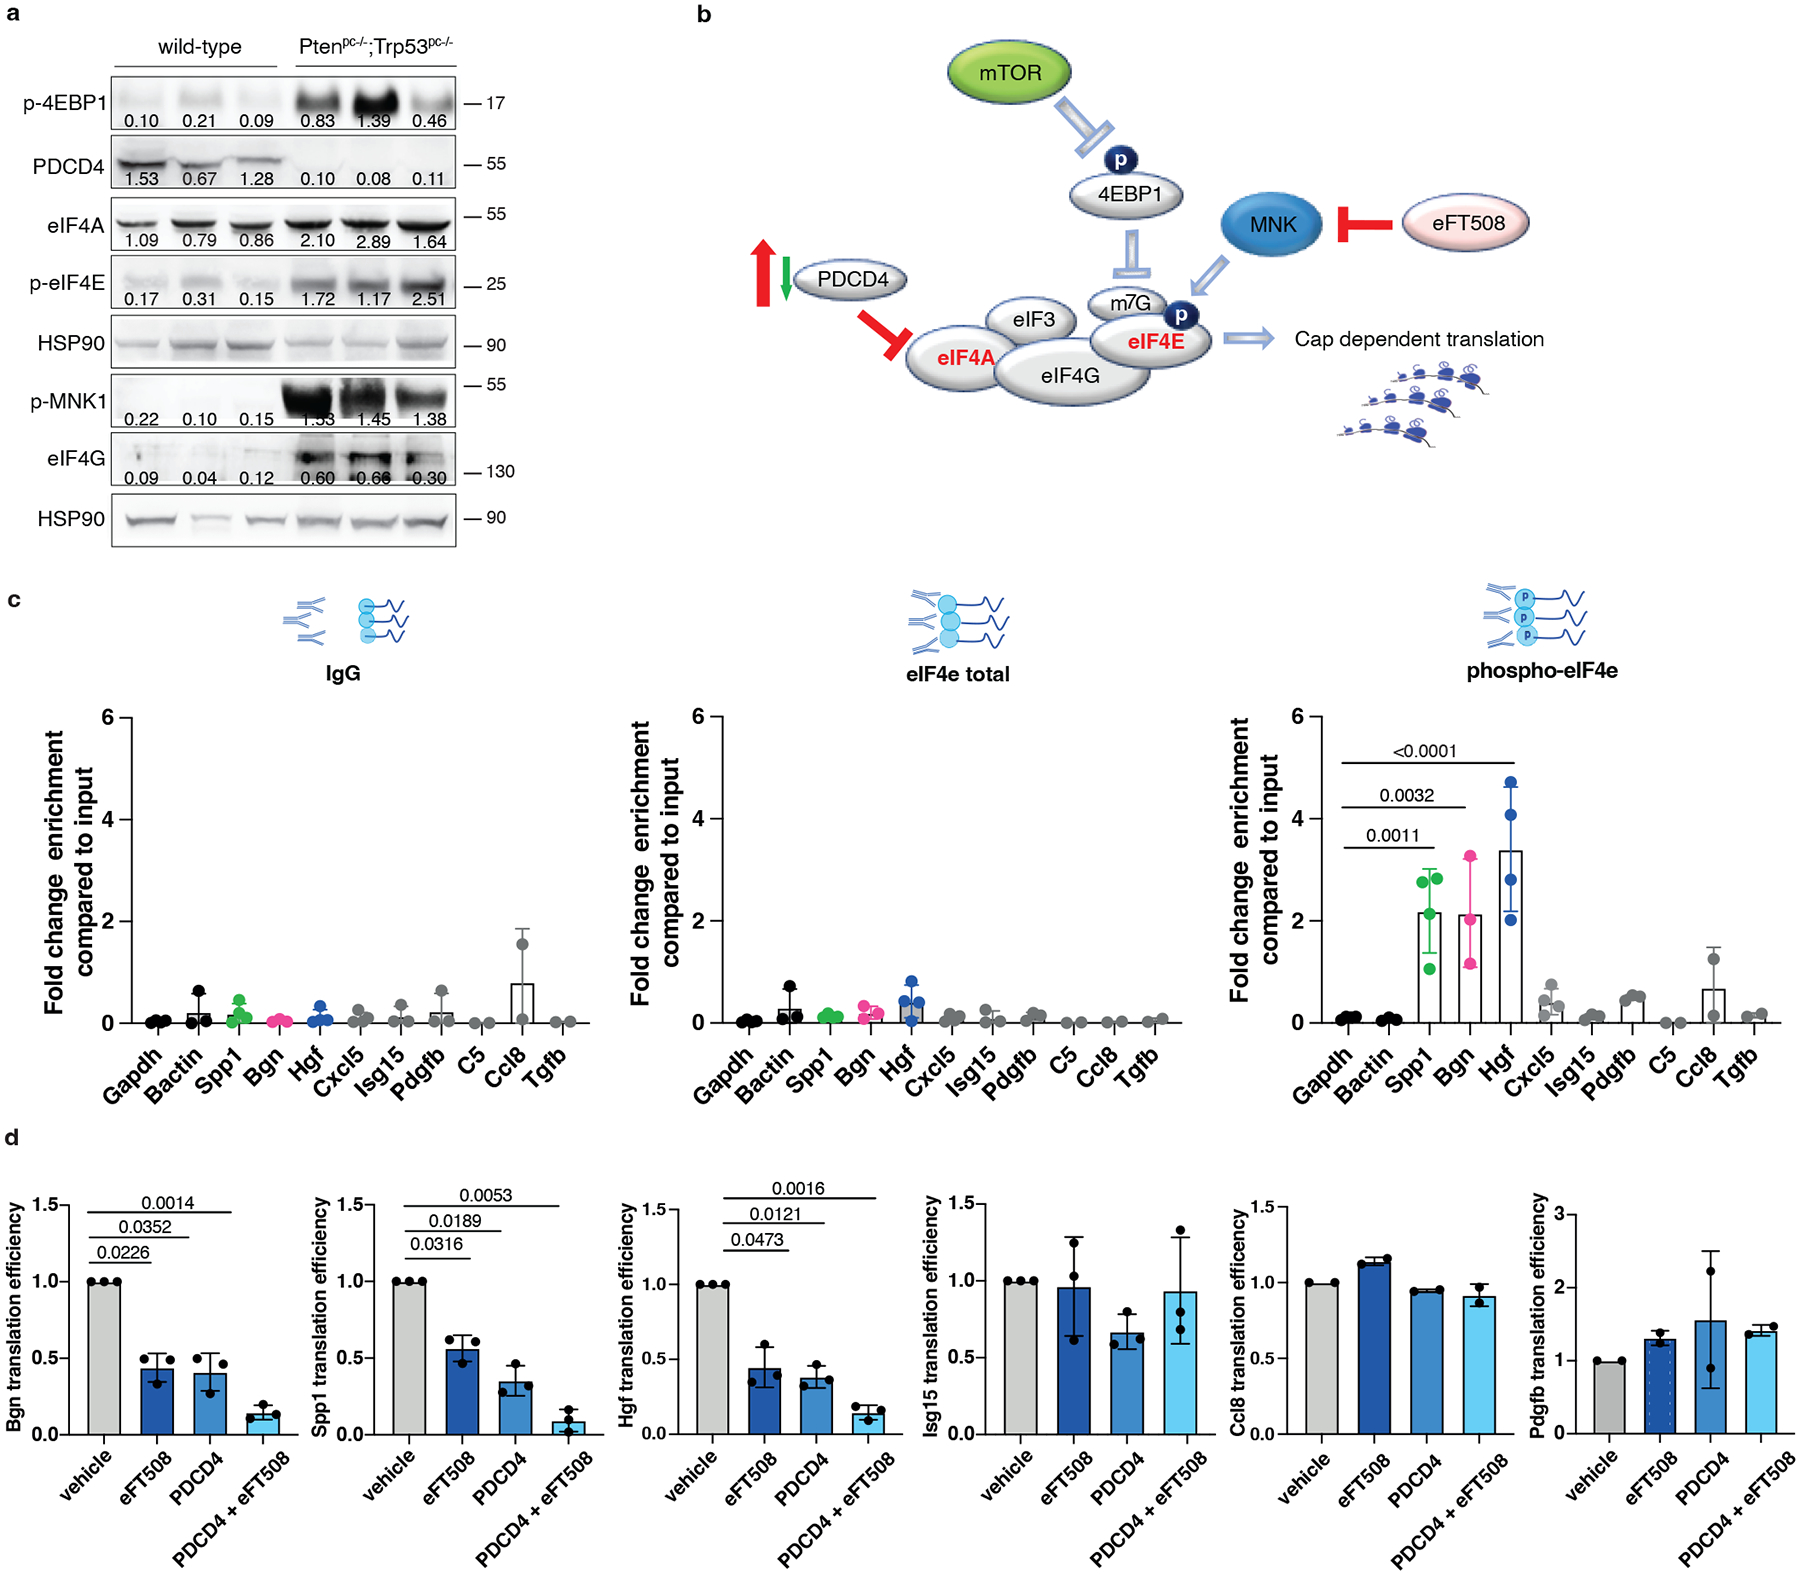
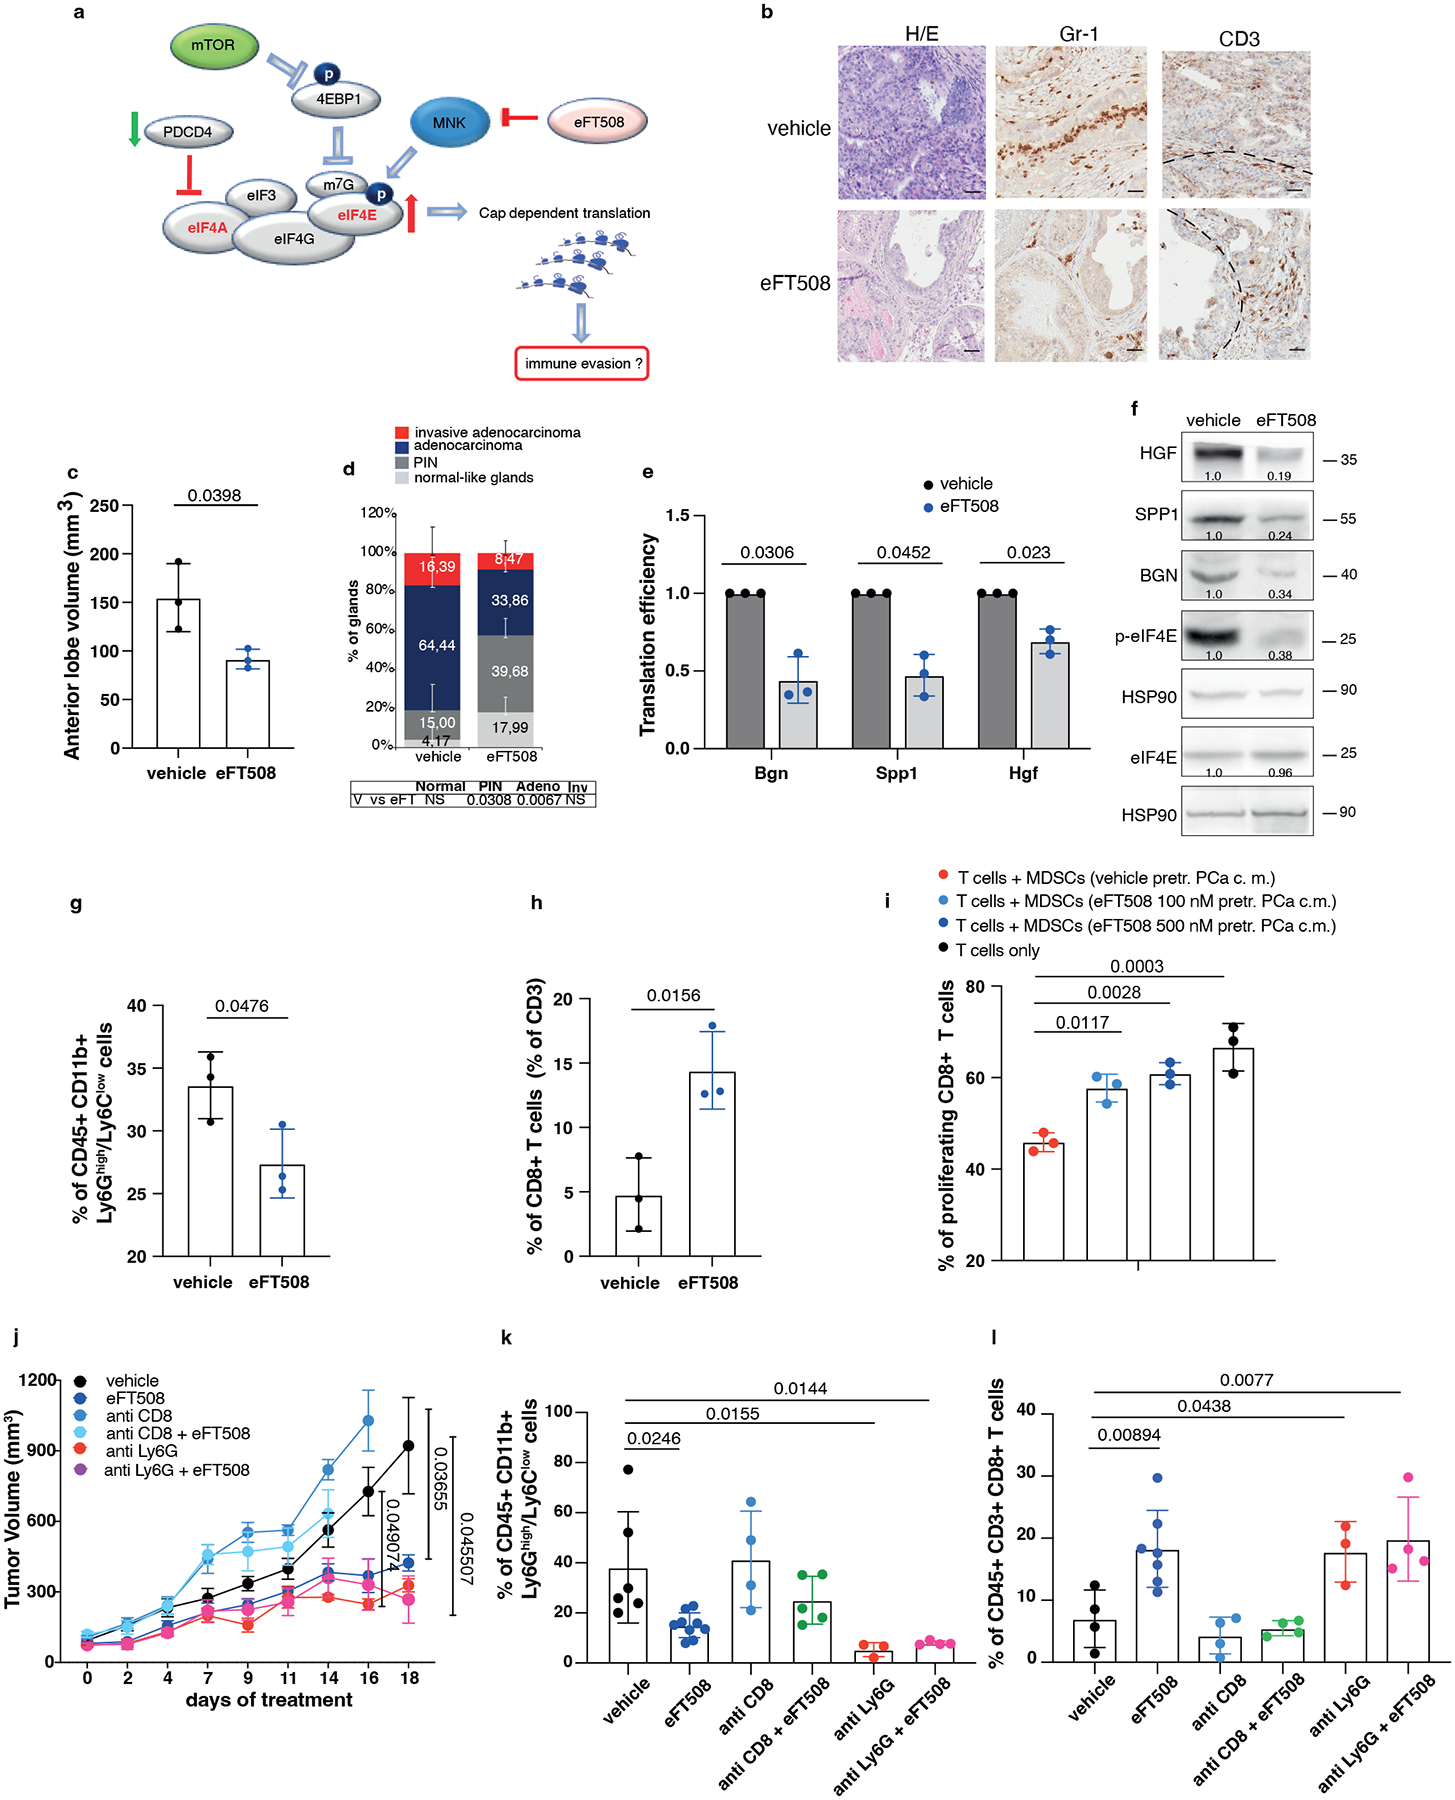
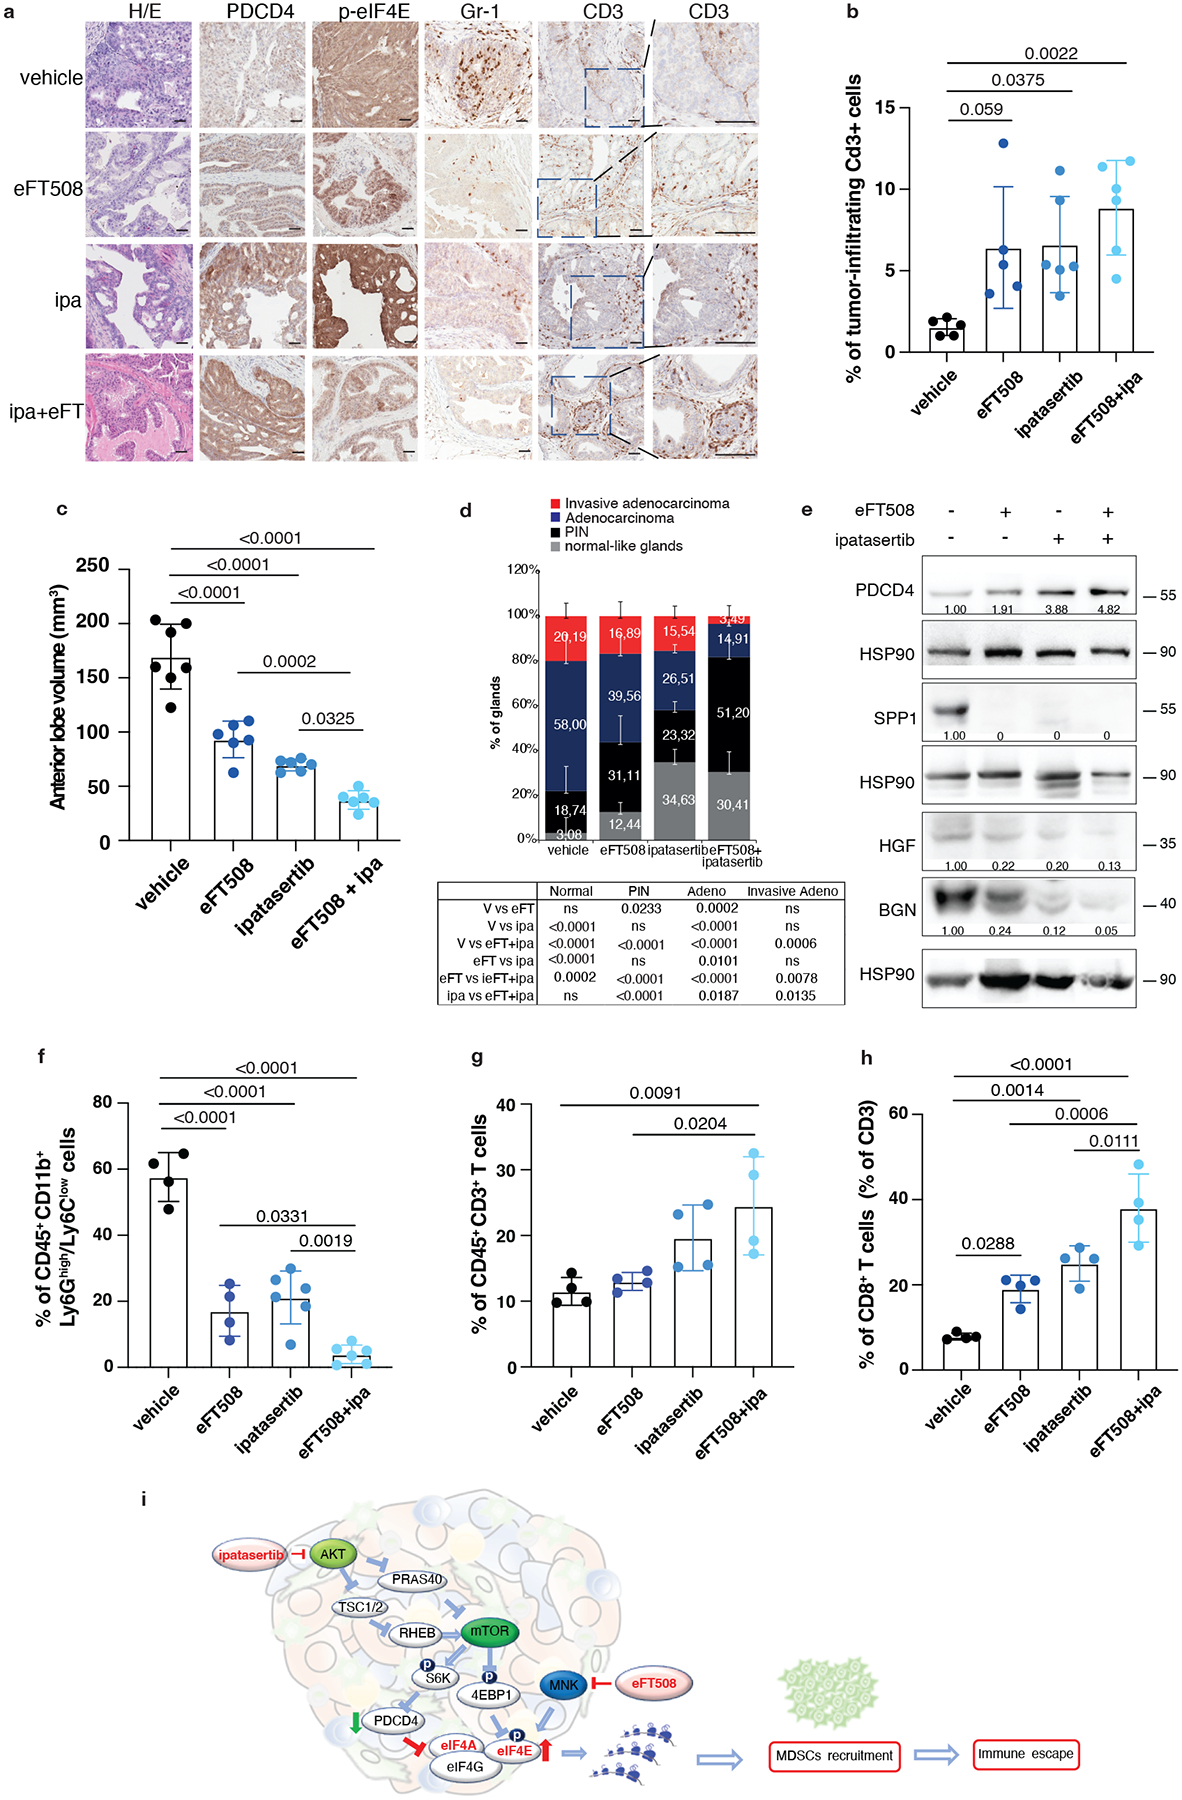
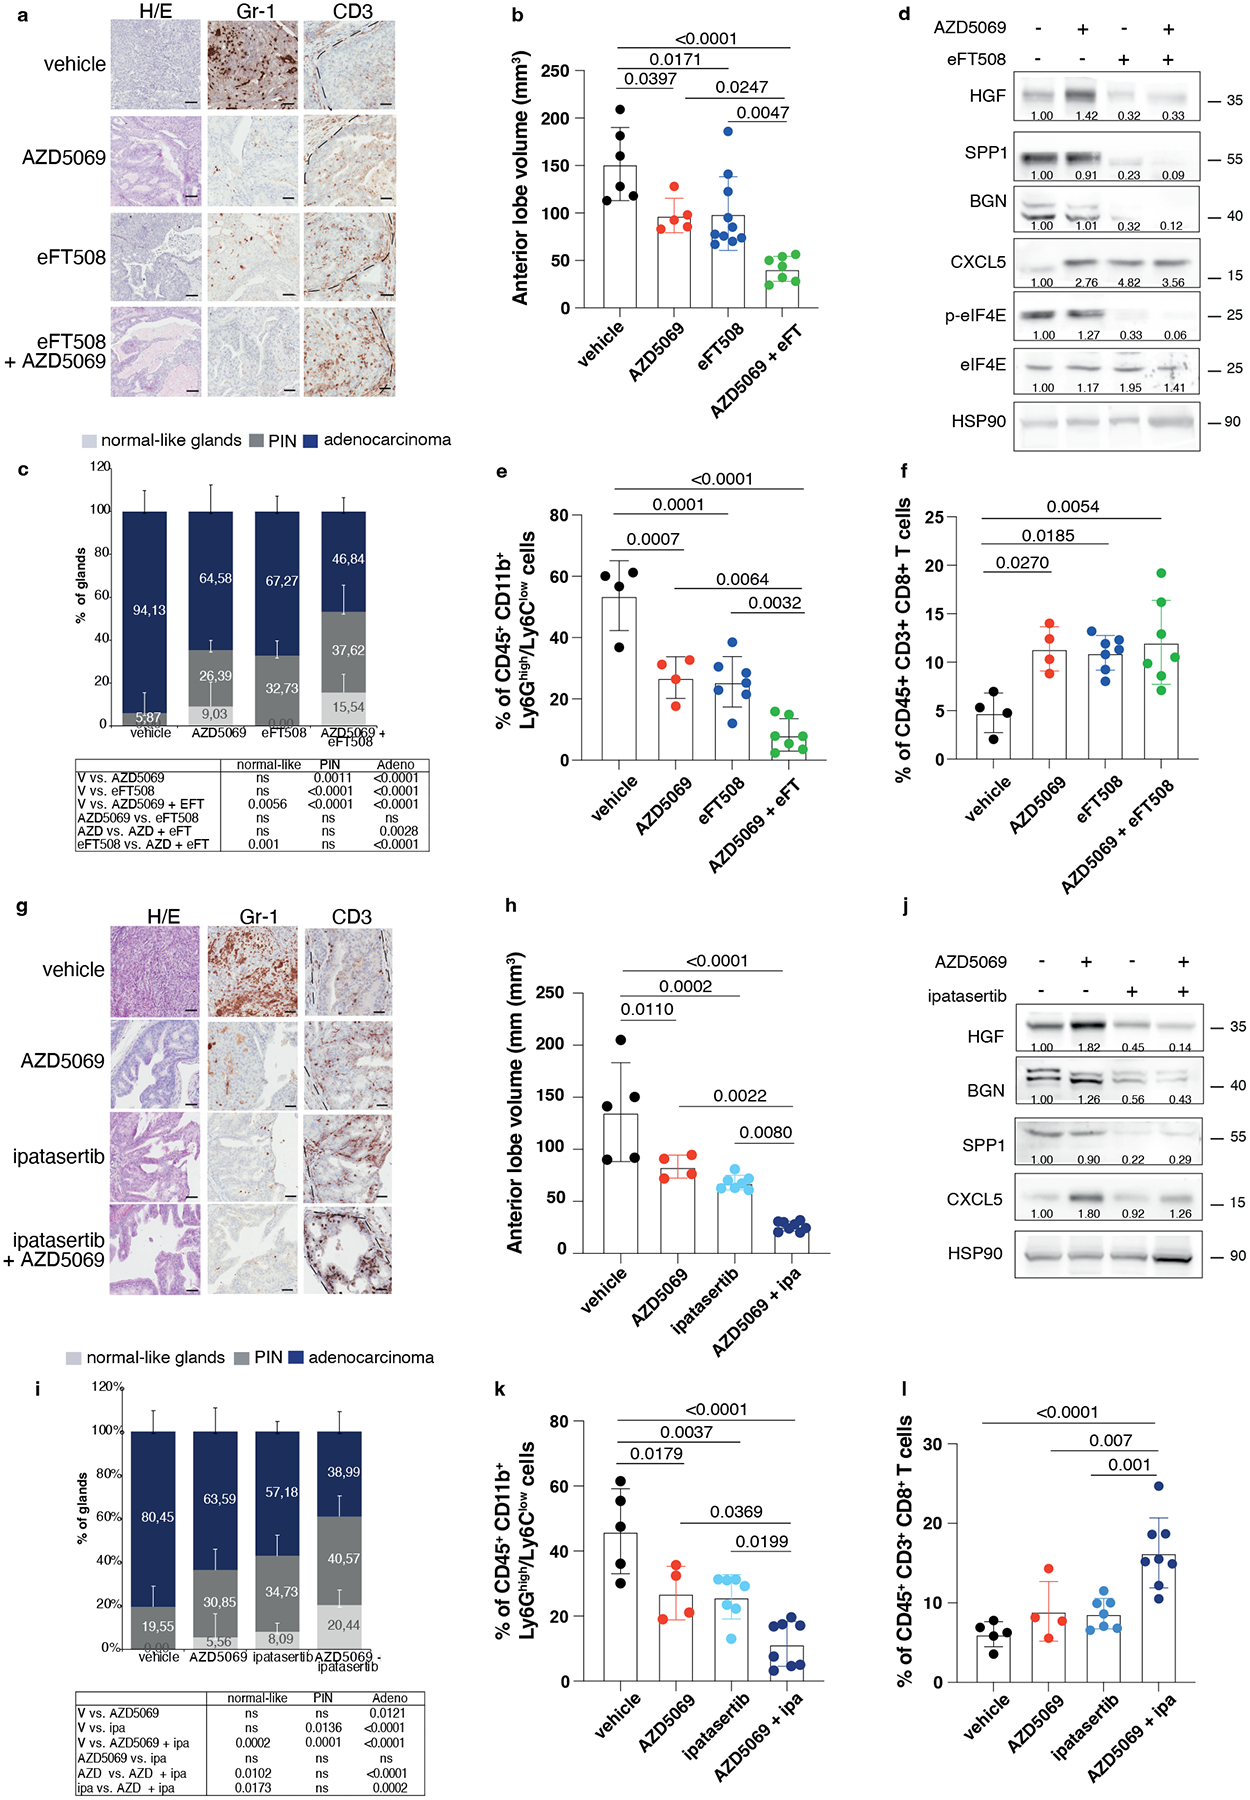
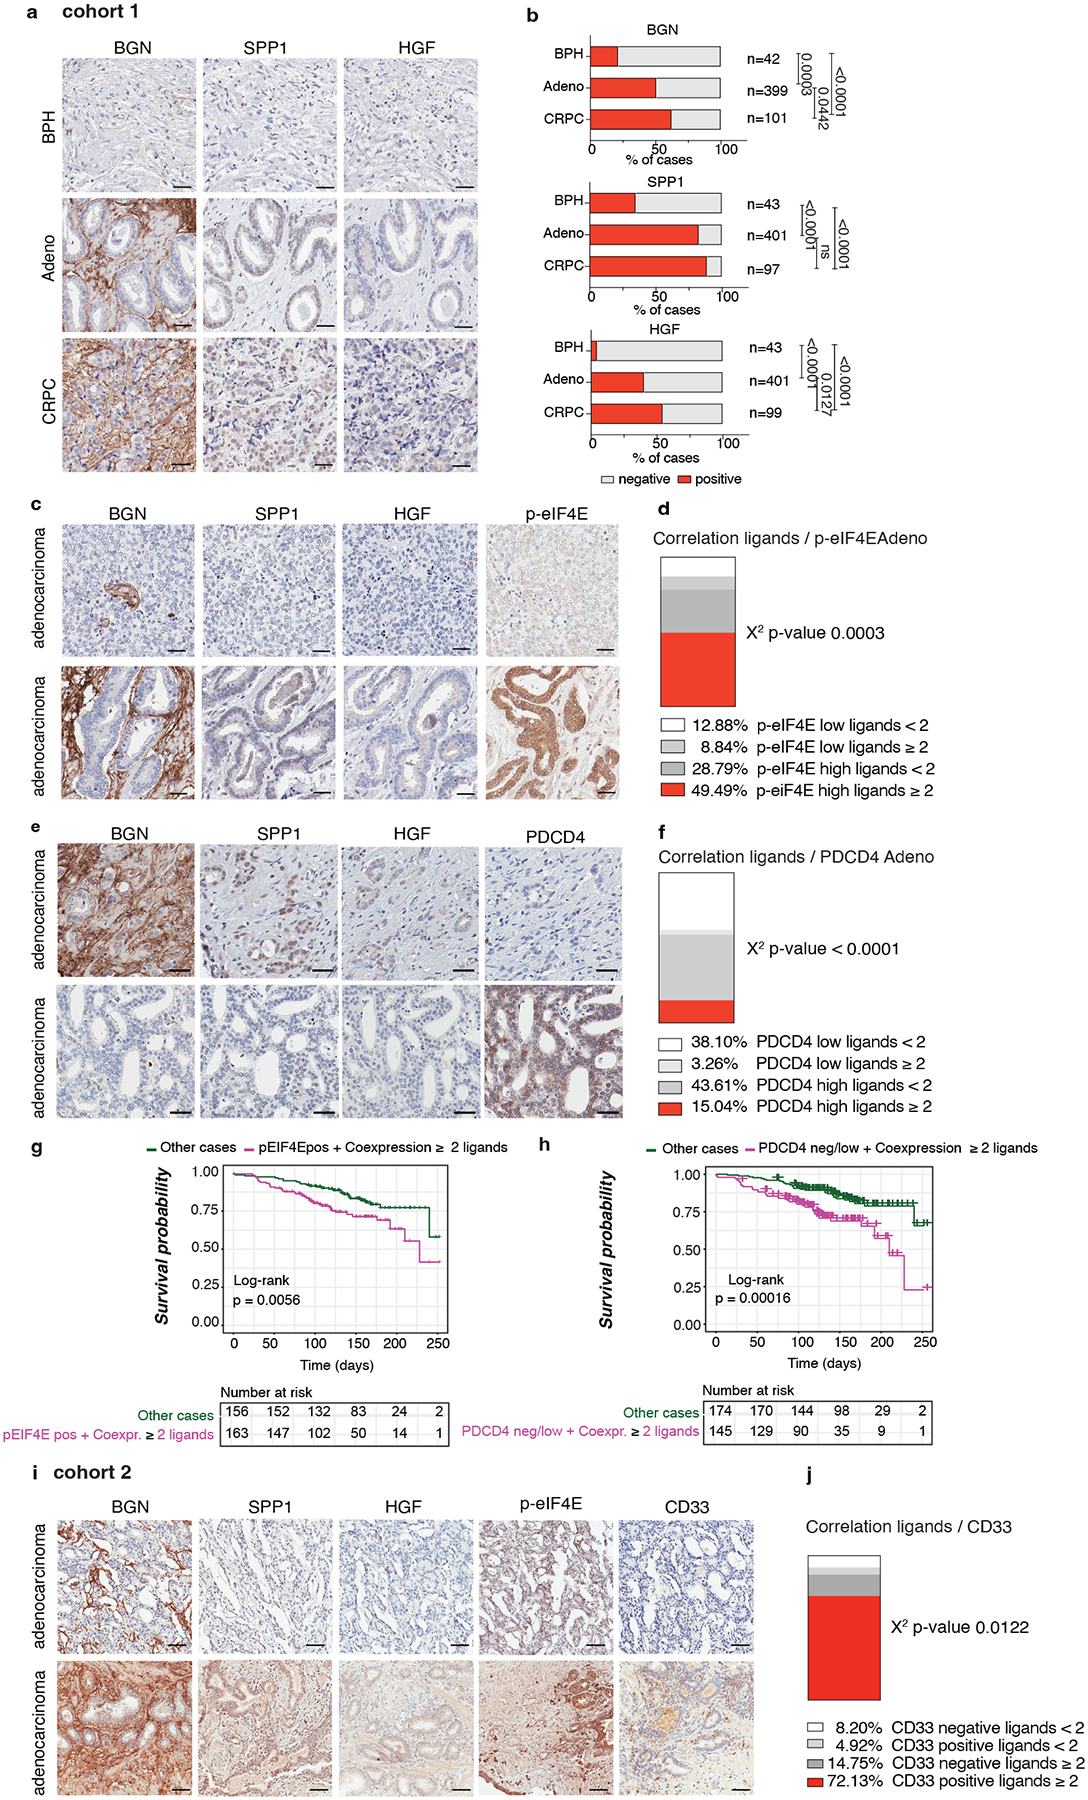
Cancer is highly infiltrated by myeloid-derived suppressor cells (MDSCs). Currently available immunotherapies do not completely eradicate MDSCs. Through a genome-wide analysis of the translatome of prostate cancers driven by different genetic alterations, we demonstrate that prostate cancer rewires its secretome at the translational level to recruit MDSCs. Among different secreted proteins released by prostate tumor cells, we identified Hgf, Spp1 and Bgn as the key factors that regulate MDSC migration. Mechanistically, we found that the coordinated loss of Pdcd4 and activation of the MNK/eIF4E pathways regulate the mRNAs translation of Hgf, Spp1 and Bgn. MDSC infiltration and tumor growth were dampened in prostate cancer treated with the MNK1/2 inhibitor eFT508 and/or the AKT inhibitor ipatasertib, either alone or in combination with a clinically available MDSC-targeting immunotherapy. This work provides a therapeutic strategy that combines translation inhibition with available immunotherapies to restore immune surveillance in prostate cancer.


Conflict of interest statement

S.B. is affiliated with IMED Oncology AstraZeneca, Li Ka Shing Centre, Cambridge, UK and provided the AZD5069 compound. Johann de Bono has served on Advisory Boards for Roche and AstraZeneca and he is an employee of the ICR, which has received funding or other support for his research work from AstraZeneca and which has a commercial interest in PI3K/AKT pathway inhibitors (no personal income). Johann de Bono and Andrea Alimonti are principal investigators of the NCT03177187 trial which was partially supported by AstraZeneca and Astellas Pharma. The remaining authors declare no competing interests.

Figures

Extended Data Fig. 1.
Extended Data Fig. 1.. Polysome profiling analysis in Pten null-driven prostate cancer
a, Polysome profiles of wild-type prostate, Ptenpc−/−, Ptenpc−/−;TMPRSS2/Ergpc+/+, Ptenpc−/−;CDCP1pc+/+, Ptenpc−/−;Timp1−/− and Ptenpc−/−;Trp53pc−/− prostate cancer. RNA-seq was performed on polysome-bound RNAs and total RNA derived from the prostate of three mice for each genetic background for a total of 18 samples. b, PCA plots of total (T) and polysomal RNA (P) fractions for each analyzed genetic background (n = 3 mice for each genetic background for a total of 18 samples). c, PCA plots of total and polysomal RNA fractions for each genetic background analyzed, corrected for the batch effect (n = 3 mice for each genetic background for a total of 18 samples). d, Scatter plots of fold-changes for polysome-associated and total mRNA levels for the comparisons between the indicated genetic backgrounds and wild-type prostates showing mRNAs with upregulated translation efficiency (red), downregulated translation efficiency, buffering up (pink), buffering down (blue) (n = 3 mice for each genetic background for a total of 18 samples). Details are provided in Supplementary Table 1 and Supplementary Table 2.
Extended Data Fig. 2.
Extended Data Fig. 2.. Polysome profiling analysis in Pten null-driven prostate cancer and bone marrow-derived MDSCs
a, Schematic representation of the polysome profiling analysis performed by selecting mRNAs changes in common among the five different genetic backgrounds analyzed (Ptenpc−/−, Ptenpc−/−; TMPRSS2/Ergpc+/+, Ptenpc−/−;CDCP1pc+/+, Ptenpc−/−;Timp1−/− and Ptenpc−/−;Trp53pc−/− prostate cancer) and wild-type prostate. Using this approach, 1072 polysomes-bound mRNAs were upregulated in the polysomal RNA pool (threshold Log2 FC > 1.0; FDR < 0.05), 776 total mRNA were upregulated in the total RNA pool (threshold Log2 FC > 1.0; FDR < 0.05) and 247 mRNAs were found translationally up-regulated (threshold for polysomal mRNA expression Log2 FC 1.0; FDR < 0.05: threshold for translation efficiency Log2 FC 0.5; FDR < 0.1) in each genetic background compared to wild-type prostate. b, Gene Ontology biological processes enriched among the upregulated mRNAs in the polysomes-bound pool (upper panel) and in the total RNA pool (lower panel) in Ptenpc−/−, Ptenpc−/−; TMPRSS2/Ergpc+/+; Ptenpc−/−;CDCP1pc+/+, Ptenpc−/−;Timp1−/− and Ptenpc−/−;Trp53pc−/− prostate cancer compared to wild-type prostate, determined by DAVID software (n = 3 mice for each genetic background for a total of 18 samples). Log10 adjusted p-values by using the linear step-up method of Benjamini is reported. c, Scheme of the differentiation protocol of bone marrow-derived MDSCs; FACS plot of the gating strategy of bone marrow-derived MDSCs, sorted in CD11b+/Ly6Ghigh/Ly6Clow PMN-MDSCs and CD11b+/Ly6Gneg/Ly6Chigh M-MDSCs after 5 days of differentiation with 40 ng/ml GM-CSF and 40 ng/ml IL-6 in RPMI plus 10% FBS medium (top); polysome profiles of undifferentiated bone marrow (middle) CD11b+/Ly6Ghigh/Ly6Clow PMN-MDSCs (bottom left) and CD11b+/Ly6Gneg/Ly6Chigh M-MDSCs (bottom right). RNA-seq was performed on polysome-bound RNAs and total RNA derived from three biological replicates.
Extended Data Fig. 3.
Extended Data Fig. 3.. BGN, SPP1 and HGF are upregulated in Pten null-driven prostate cancer compared to wild-type prostate
a, Graphs showing the CPM of Bgn, Spp1 and Hgf in wild-type prostate and Ptenpc−/− prostate cancer determined by Ribo-seq analysis (left panel). Data are presented as mean values +/− SEM of n = 3 mice for each genotype. P values were computed by one-tailed quasi-likelihood F-test and are indicated at the top of the graph. Ribosome occupancy in wild-type prostate (grey) and Ptenpc−/− prostate cancer (red) determined by Ribo-seq analysis (right panel). Each profile represents the mean normalized coverage among n = 3 mice for each genotype. The structure of the transcript, showing the boundaries of CDS and UTR regions, is outlined below each profile. b, Western blot showing the protein levels of BGN, SPP1 and HGF in wild-type prostates, Ptenpc−/− and Ptenpc−/−;Trp53pc−/− prostate cancers. Densitometry values normalized to the respective loading control are indicated for each band. See quantification for the indicated number of mice in Ext Data Fig. 3c. c, Densitometric analysis of BGN, SPP1 and HGF in wild-type prostates, Ptenpc−/− and Ptenpc−/−;Trp53pc−/− prostate cancers (from the left, BGN n = 17, n = 7, n = 14; SPP1 n = 10, n = 8, n = 12; HGF n = 11, n = 6, n = 6). Data are mean ± SD. d, Percentage of tumor-infiltrating CD45+/CD11b+/ Ly6Ghigh/Ly6Clow cells (PMN-MDSCs) in wild-type, Ptenpc−/− and Ptenpc−/−;Trp53pc−/− prostate cancers (from the left, n = 5, n = 4, n = 5 derived from the analysis of Fig. 1a. Data are mean ± SD. Statistical analysis between all groups in (c) and (d): (ordinary one-way ANOVA followed by Tukey’s multiple comparisons test).
Extended Data Fig. 4.
Extended Data Fig. 4.. TLR2, CD44 and MET expression correlates with the PMN-MDSCs signature in human prostate cancer and CRPC
a, Western blot showing the protein levels of BGN, SPP1 and HGF in epithelial (EpCAM+ cells), immune (CD45+ cells) and stromal fraction (EpCAM-, CD45- cells) of Ptenpc−/−;Trp53pc−/− prostate cancer. Densitometry values normalized to the respective loading control are indicated for each band. The experiment was repeated two independent times with similar results. b, Mean fluorescence intensity (MFI) of the indicated receptors in tumor-infiltrating immune cells subsets and EpCAM+ cells in Ptenpc−/−;Trp53pc−/− prostate cancers. At least n = 3 biologically independent samples. Data are mean ± SD. c, FACS plots of TLR2, CD44 and MET receptor expression in bone marrow-derived MDSCs; green signal: MDSCs stained with fluorescence minus one control, violet signal: MDSCs stained with the specific antibody. d, Correlation of TLR2 (left panel), CD44 (middle panel) and MET (right panel) expression with the PMN-MDSCs signature in primary prostate cancer and CRPC. Pearson correlation and p value are indicated at the top of the graph. TLR2: 95 % confidence interval 0.734–0.785; CD44: 95 % confidence interval: 0.180–0.295; MET: 95 % confidence interval: 0.156–0.273 e, BGN, SPP1 and HGF protein levels determined in Pten−/−;Trp53−/− (RapidCap)-derived conditioned medium by ELISA assay. n = 3 biologically independent samples. Data are mean ± SD. Statistical analysis (unpaired two-sided Student’s t-test). f, Arg1, Nos2, Vsir and Cd274 mRNA expression levels in bone marrow-derived MDSCs pretreated with recombinant BGN, SPP1 and HGF for 24 hours. n = 2 (Arg1), n = 3 (Nos2), n = 3 (Vsir), n = 2 (Cd274) biologically independent samples Data are mean ± SD. Statistical analysis (two-way ANOVA followed by Dunnett’s multiple comparisons test). g, Growth curve of scramble and Hgf/Spp1/Bgn triple KD Pten−/−;Trp53−/− (RapidCap) cells. Data are mean ± SEM. The experiment was repeated two independent times with similar results. h, Western blot showing HGF, SPP1 and BGN protein levels in scramble and triple KD Pten−/−;Trp53−/− (RapidCap)- cell lines used for the in vivo experiments. Densitometry values normalized to the respective loading control are indicated for each band. i, Tumor growth of scramble and Hgf/Spp1/Bgn triple KD in Pten−/−;Trp53−/− (RapidCap) - allografts (for all groups, n = 5 in each group). Data are mean ± SEM. Statistical analysis (multiple unpaired student t test). j, Representative IHC of Gr-1 and CD3 in scramble and Hgf/Spp1/Bgn triple KD Pten−/−;Trp53−/− (RapidCap)- allografts. Scale bar 50 μm. (n = 5 mice in each group). k, Representative IHC of Gr-1 and CD3 in vehicle-treated (n = 4 mice) and recombinant Bgn/Spp1/Hgf-treated (n = 6 mice) TRAMP-C1 allografts. Scale bar 50 μm.
Extended Data Fig. 5.
Extended Data Fig. 5.. PDCD4 inhibits eIF4F complex formation and cooperates with eFT508 to reduce Hgf, Spp1 and Bgn levels
a, Western blot showing the protein levels of PTEN, pSer473-AKT, AKT total, pSer235-S6, eIF4E, MNK1 and representative HSP90 in wild-type prostate and Ptenpc−/−;Trp53pc−/− prostate cancer. The experiment was performed once with n = 3 mice for each group. b, Heatmap showing PDCD4 mRNA levels in the indicated genetic background of prostate cancer compared to wild-type prostate (total mRNA expression determined by RNA-seq). c, Western blot showing the levels of Pten and PDCD4 in the indicated settings (top). Cap pull-down assay showing the levels of eIF4G, eIF4A, eIF4E and p-eIF4E in input, cap pull-down and sepharose control beads. Densitometry values of the cap pull-down normalized to the input are indicated for each band (bottom). d, Western blot showing the levels of p-eIF4E and eIF4E after RNA immunoprecipitation with the respective antibody in Pten-sh TC1 prostate cancer cells. e, Western blot showing the levels of HGF, SPP1, BGN, p-eIF4E and representative HSP90 in Pten-sh TC1 cell line upon the indicated concentration of eFT508. f, Western blot showing the levels of HGF, SPP1, BGN, p-eIF4E, PDCD4 and representative HSP90 in Pten-sh TC1 cell line upon 500 nM eFT508 treatment and PDCD4 rescue. g, Polysome profiles of vehicle, 500 nM eFT508-treated, Pdcd4-overexpressing Pten-sh cells and eFT508-treated / Pdcd4-overexpressing Pten-sh cells. h, Distribution of Hgf, Spp1 and Bgn mRNA levels in the fractions derived from the sucrose gradient fractionation in Pten-sh TC1 cells, determined by qRT-PCR (n = 5 independent experiments for Hgf and Spp1; n = 4 independent experiments for Bgn; n = 3 independent experiments for Actinb). The percentages of Hgf, Spp1 and Bgn mRNA distributed in each fraction are shown. v= vehicle; e= eFT508; p=pdcd4; e+p=eFT508+pdcd4. Data are mean ± SD. Statistical analysis between all groups (ordinary two-way ANOVA followed by Tukey’s multiple comparisons test). i, Western blot showing the levels of PDCD4 and p-eIF4E in human PC3 prostate cancer cell line. j, Translation efficiency (polysomal mRNA expression/total mRNA expression) of HGF, SPP1, BGN, ISG15 and PDGFB upon 500 nM eFT508 treatment and PDCD4 rescue in human PC3 prostate cancer cell line (n = 3 independent experiments). Data are mean ± SD. Statistical analysis between all groups: (RM one-way ANOVA followed by Tukey’s multiple comparisons test). Densitometry values normalized to the housekeeping are indicated for each band in (a) and (e-f) and (i). The experiment was repeated at least two independent times with similar results in (c-f) and (i).
Extended Data Fig. 6.
Extended Data Fig. 6.. Prostate-specific Pdcd4 rescue inhibits tumor-infiltrating PMN-MDSCs and its loss is associated with decreased disease-free survival in human prostate cancer
a, Growth curve of control vector (lenti ORF) and PDCD4 -overexpressing (lenti PDCD4) Pten−/−;Trp53−/− (RapidCap) prostate cancer cells, determined by the Incucyte system. Data are mean ± SEM. The experiment was repeated two independent times with similar results. b, Tumor growth of C57BL6 mice injected with 2.5 × 10⁶ control vector or PDCD4 -overexpressing Pten−/−;Trp53−/− (RapidCap) prostate cancer cells (lenti ORF n = 10; lenti Pdcd4 n = 7 mice). Data are mean ± SEM. Statistical analysis: (two way ANOVA followed by Šídák’s multiple comparisons test). c, Western blot showing the protein levels of PDCD4, SPP1, HGF, BGN and representative HSP90 in control vector and PDCD4 -overexpressing Pten−/−;Trp53−/− (RapidCap) murine prostate cancer cells. Densitometry values normalized to the housekeeping are indicated for each band. The experiment was repeated two independent times with similar results. d, Representative IHC of Gr-1-positive cells in control vector or PDCD4 -overexpressing Pten−/−;Trp53−/− (RapidCap) allografts. Scale bar 50 μm. (n = 5 mice in each group). e, Representative FACS plot of CD45+/CD11b+/Ly6Ghigh/Ly6Clow cells (PMN-MDSCs) inside the CD45+/CD11b+ population. f, Percentage of tumor-infiltrating CD45+/CD11b+/Ly6Ghigh/Ly6Clow (PMN-MDSCs) in control vector and PDCD4-overexpressing Pten−/−;Trp53−/− (RapidCap) allografts determined by flow cytometric analysis (n = 5 mice in each group). Data are mean ± SD. Statistical analysis (Mann-Whitney test). g, Correlation between PDCD4 mRNA levels and disease-free probability in the indicated human prostate cancer datasets. h, Correlation between PDCD4 mRNA expression levels and Pten deletion/mutation in the human prostate cancer TCGA dataset. Statistical analysis: chi-square test.
Extended Data Fig. 7.
Extended Data Fig. 7.. eFT508 inhibits translation of Hgf, Spp1 and Bgn and impairs PMN-MDSCs migration in prostate cancer
a, Hgf, Spp1 and Bgn mRNA levels in polysomes-bound mRNAs and total mRNAs fraction in prostate cancer of eFT508-treated and vehicle-treated Ptenpc−/−;Trp53pc−/− mice determined by qRT- PCR (n = 3 mice in each group). Data are mean ± SD. Statistical analysis (two-tailed ratio paired t-test). b, Densitometry of BGN, SPP1 and HGF protein expression levels in prostate cancer of eFT508-treated or vehicle-treated Ptenpc−/−;Trp53pc−/− mice (BGN and HGF, n = 3 mice ; SPP1, n = 4 mice). Data are mean ± SD. Statistical analysis (unpaired two-sided Student’s t-test). c, Ifng, Granzyme B (GrzmB), Perforin (Prfn) and FoxP3 mRNA levels in prostate cancer of eFT508-treated compared to vehicle-treated Ptenpc−/−;Trp53pc−/− mice determined by qRT- PCR (IFN-γ, GrzmB anf Prfn, n = 3 mice, Foxp3 n = 4 mice). Data are mean ± SD. Statistical analysis (two-tailed ratio paired t-test). d, Number of migrated MDSCs tested in a transwell migration assay: MDSCs, previously exposed to 10% FBS, vehicle, 100 nM or 500 nM eFT508-treated Ptenpc−/−;Trp53pc−/− (RapidCap)-derived conditioned media for 24 hours, were allowed to migrate through a 5 μm-transwell to the bottom well for 6 hours toward Pten−/−;Trp53−/− (RapidCap)-derived conditioned media. The number of migrated cells was determined by flow cytometric analysis. Experiment in technical replicates performed twice with similar results. e, Number of migrated MDSCs tested in a transwell migration assay: MDSCs were allowed to migrate through a 5 μm-transwell to the bottom well for 6 hours toward 0.1% FBS media, vehicle, 100 nM or 500 nM eFT508-treated Pten−/−;Trp53−/− (RapidCap)-derived conditioned media. The number of migrated cells was determined by flow cytometric analysis. Experiment in technical replicates performed twice with similar results.
Extended Data Fig. 8.
Extended Data Fig. 8.. eFT508 restores T cell activation in the Ptenpc−/−;Trp53pc−/− mouse model
a, Representative FACS plots of the CD45+/CD3 population and CD45+/CD3+/CD8+ cells upon isotype control and anti-CD8 depleting antibody. b, Representative FACS plots of the CD45+/CD11b+ population and CD45+/CD11b+/Ly6Ghigh/Ly6Clow (PMN-MDSCs) upon isotype control and anti-Ly6G depleting antibody. c, IFN-γ, GrzmB and Foxp3 mRNA levels in eFT508-treated and vehicle-treated Pten−/−;Trp53−/− (RapidCap) allografts determined by qRT- PCR (vehicle group, n = 4; eFT508 group, n = 4, n = 5, n = 5 mice, respectively). Data are mean ± SD. Statistical analysis (unpaired two-sided Student’s t-test). d, Growth curve analysis of Pten−/−;Trp53−/− (RapidCap) murine prostate cancer cells, LnCap and PC3 human prostate cancer cell line treated with vehicle or 1 μM, 2 μM, 5 μM eFT508, determined by the Incucyte system. Data are mean ± SEM. The experiment was repeated two independent times with similar results.
Extended Data Fig. 9.
Extended Data Fig. 9.. AKT inhibition increases PDCD4 levels and cooperates with eFT508 to reduce HGF, SPP1 and BGN protein levels in Pten−/−;Trp53−/− prostate cancer cells
a, Western blot analysis showing the protein levels of PDCD4 and phospho-S6 in Pten−/−;Trp53−/− (RapidCap) and PC3 prostate cancer cell line upon treatment with the indicated concentration of ipatasertib. Densitometry values normalized to the loading control are indicated at the bottom for each band. The experiment was repeated two independent times with similar results. b, Western blot analysis showing the protein levels of PDCD4, p-S6, p-eIF4E, p-4EBP1, HSP90 (upper panel) and HGF, SPP1, BGN and representative HSP90 (lower panel) in Pten−/−;Trp53−/− (RapidCap) murine prostate cancer cell line upon treatment with vehicle, 500 nM eFT508, 500 nM ipatasertib or the dual treatment. Densitometry values normalized to the loading control are indicated at the bottom for each band. The experiment was repeated two independent times with similar results. c, Western blot analysis showing the protein levels of PDCD4, p-S6, p-eIF4E, p-4EBP1, HSP90 (upper panel) and HGF, SPP1, BGN and representative HSP90 (lower panel) in PC3 human prostate cancer cell line upon treatment with vehicle, 500 nM eFT508, 500 nM ipatasertib or the dual treatment. Densitometry values normalized to the loading control are indicated for each band. The experiment was repeated two independent times with similar results. d, Transwell migration assay performed with bone marrow-derived MDSCs tested for the capability to migrate toward PCa medium conditioned with the indicated treatments. n = 3 biological replicates. The experiment was repeated two independent times with similar results. Data are mean ± SD. Statistical analysis between all groups (ordinary one-way ANOVA followed by Tukey’s multiple comparisons test). e, Representative FACS plot of the gating strategy for the quantification of CD45+/CD11b+/Ly6Ghigh/Ly6Clow (PMN-MDSCs) (left) and CD45+/CD3+/CD8+ cells (right) in Ptenpc−/−;Trp53pc−/− prostate tumors.
Extended Data Figure 10.
Extended Data Figure 10.. BGN, SPP1 and HGF are highly expressed in CRPC and correlate with p-eIF4E protein levels
a, Representative FACS plots of CD45+/CD11b+ population and Ly6Ghigh/Ly6Clow cells (PMN-MDSCs) inside the CD45+/CD11b+ population in AZD5069-treated and vehicle-treated Ptenpc−/−;Tmprss2/Ergpc+/+. b, Western blot analysis showing the protein levels of HGF, SPP1 and BGN in Ptenpc−/−;Tmprss2/Ergpc+/+ prostate tumors upon treatment with vehicle or AZD5069. Densitometry values normalized to the housekeeping are indicated for each band. The experiment was performed once. c, Western blot analysis showing the protein levels of CXCL5 in Ptenpc−/−;Tmprss2/Ergpc+/+ prostate tumors upon treatment with vehicle or eFT508. Densitometry values normalized to the housekeeping are indicated for each band. The experiment was repeated two independent times with similar results. d, Heatmap depicting the mRNA levels of CXCL-chemokines in prostate tumors of the indicated genotypes compared to wild-type prostates (total mRNA expression determined by RNA-seq; n = 3 mice for each genetic background). e, Representative IHC of BGN, SPP1, HGF and p-eIF4E showing negative (upper panel) and positive (lower panel) cases in CRPC in cohort 1. Scale Bar 50 μm. f, Correlation between the co-expression of ≥ 2 ligands and p-eIF4E in CRPC in cohort 1 (n = 101). Two-sided Fisher’s exact test. g, Western blot showing the protein levels of BGN, SPP1 and HGF and representative HSP90 in CRPC patient-derived xenografts. (n = 4). h, Correlation between plasma HGF levels (pg/ml), determined by ELISA assay, and neutrophil-to-lymphocyte ratio (NLR) in CRPC patients. Statistical analysis: simple linear regression.
Fig. 1.
Fig. 1.. Genome-wide analysis of the translatome is exploited to identify the extracellular interactome of prostate cancer - PMN-MDSCs
a, Immunophenotype of Ptenpc−/− (n = 4), Ptenpc−/−;TMPRSS2/Erg pc+/+ (at least n = 3), Ptenpc−/−;CDCP1pc+/+ (at least n = 2), Ptenpc−/−;Timp1−/− (n = 3) and Ptenpc−/−;Trp53pc−/− (n = 5) prostate cancers. b, Scheme of the polysome profiling analysis. c, Features of the 5’ UTRs of the translationally regulated mRNAs: 5’ UTR estimated length (top) and folding energy comparison (bottom). The mRNAs with an increased translation efficiency (TE) and the mRNAs with a decreased TE (down) were compared to mRNAs with a not significantly changed TE (inv) for each indicated genetic background (n = 3 mice) compared to wild-ty prostates (n = 3 mice). Definition of box whisker plots: center: median of the distribution; box: between lower and upper quartile; whisker: 1.5 interquartile range; outliers not displayed. Statistical test: Wilcoxon Rank Sum Test (two-sided). d, Gene Ontology Biological processes enriched among the translationally upregulated mRNAs in Ptenpc−/−, Ptenpc−/−;TMPRSS2/Ergpc+/+; Ptenpc−/−;CDCP1pc+/+, Ptenpc−/−;Timp1−/− and Ptenpc−/−;Trp53pc−/− prostate cancer compared to wild-type prostate, determined by the DAVID software. (n = 3 mice for each genetic background for a total of 18 samples). Log10 adjusted p-values by using the linear step-up method of Benjamini are reported. e, Bioinformatic algorithm applied to identify the extracellular interactome of prostate cancer - PMN-MDSCs.
Fig. 2.
Fig. 2.. HGF, SPP1 and BGN are the most expressed, translationally regulated secreted factors in Pten null-driven prostate cancer
a, List of ligand-receptor couples upregulated in the indicated genetic backgrounds of prostate cancer: on the left, the Log2 Fold change of polysome-bound RNA (poly) and total RNA (total) expression (threshold fold change >1; threshold significant FDR < 0.05) and, on the right, the Log2 Fold change Translation efficiency (TE) (threshold fold change >0.70; threshold significant FDR < 0.05) (n = 3 for each genetic background for a total of 18 samples). See also Supplementary Table 1 for the Fold change of total RNA and polysomal RNA. b, Translationally regulated ligand-receptor pairs upregulated in the indicated genetic backgrounds of prostate cancer (threshold fold change >0.70; threshold significant FDR < 0.05) (n = 3 for each genetic background for a total of 18 samples). Log2 Fold change is indicated in the heatmap. See Supplementary Table 2 for the Fold change of the translation efficiency. c, Western blot showing the levels of HGF, SPP1 and BGN in wild-type prostates and Ptenpc−/−;Trp53pc−/−prostate cancers. The experiment was performed once with n = 4 mice for each group. Densitometry values normalized to the respective loading control are indicated for each band. d, Western blot showing the levels of HGF, SPP1, BGN, CXCL5 and PTEN in Pten wild-type or Pten-sh TC1 cell line. Densitometry values normalized to the respective loading control are indicated for each band. The experiment was repeated three independent times with similar results. e, Scheme of the experiment of Pten wild-type or Pten-sh TC1 prostate cancer cell injection (top), representative FACS plots of the CD45+/CD11b+ population and Ly6Ghigh/Ly6Clow cells inside the CD45+/CD11b+ population (bottom left). f. Percentage of CD45+/CD11b+/Ly6Ghigh/Ly6Clow cells inside the CD45+ population in Pten wild-type and Pten-sh TC1 allograft tumors. (n = 9 mice in each group) Statistical analysis: (unpaired two-sided Student’s t-test). g. Percentage of CD45+/CD3+/CD8+ cells inside the CD45+ population in Pten wild-type and Pten-sh TC1 allograft tumors. (n = 10 mice in each group). Statistical analysis: (Mann-Whitney test).
Fig. 3.
Fig. 3.. HGF, SPP1 and BGN induce PMN-MDSCs migration and T cell suppressive function
a, Transwell migration assay with bone marrow-derived MDSCs tested for the capability to migrate toward RPMI medium supplemented with the indicated secreted factors. Ligands: HGF+SPP1+BGN. n = 4 biological replicates. The experiment was repeated two independent times with similar results. b, Transwell migration assay with bone marrow-derived MDSCs tested in the presence of blocking antibodies for MET, CD44 and TLR2 with or without CXCR2 antagonist AZD5069, toward PCa conditioned medium derived from Pten−/−;Trp53−/− (RapidCap) prostate cancer cells. Abs: anti-MET+anti-CD44+anti-TLR2. n = 3 biological replicates. The experiment was repeated two independent times with similar results. c, Flow cytometric analysis of T cell suppression assay, analyzed as CFSE dilution, of splenocytes co-cultured with bone marrow-derived MDSCs; MDSCs were incubated for 24 hours with the indicated secreted factors before performing the experiment. n = 3 biological replicates. The experiment was repeated two independent times with similar results. d, Scheme of the experiment of Hgf, Spp1 and Bgn shRNAs in Pten−/−;Trp53−/− (RapidCap) cells. e, Representative FACS plots of CD45+/CD11b+ population and Ly6Ghigh/Ly6Clow cells inside the CD45+/CD11b+ population in scramble and triple KD in Pten−/−;Trp53−/− (RapidCap) allografts. f, Percentage of CD45+/CD11b+/Ly6Ghigh/Ly6Clow cells (PMN-MDSCs) inside the CD45+ population in Pten−/−;Trp53−/− (RapidCap) allografts tumors (n = 5 mice in each group). g, Percentage of CD45+/CD3+/CD8+ cells inside the CD45+ population in Pten−/−;Trp53−/− (RapidCap) allografts tumors (n = 5 mice in each group). h, Scheme of the experiment of rec. BGN/SPP1/HGF-treated Pten wild-type TC1 allografts (10 days treatment). i, Representative FACS plots of CD45+/CD11b+ population and Ly6Ghigh/Ly6Clow cells (PMN-MDSCs) inside the CD45+/CD11b+ population in vehicle-treated or rec. BGN/SPP1/HGF treated Pten wild-type TC1 allografts. j, Percentage of CD45+/CD11b+/Ly6Ghigh/Ly6Clow cells (PMN-MDSCs) inside the CD45+ population in rec. BGN/SPP1/HGF-treated Pten wild-type TC1 allografts for 10 days. (vehicle n = 4 mice; recombinant BGN/SPP1/HGF n = 6 mice). k, Percentage of CD45+/CD3+/CD8+ cells inside the CD45+ population in rec. BGN/SPP1/HGF-treated Pten wild-type TC1 allografts (n = 4 vehicle; n = 6 recombinant proteins-treated mice). Statistical analysis in (a-c) between all groups (ordinary one-way ANOVA followed by Tukey’s multiple comparisons test.). Statistical analysis in (f) and (j-k) (unpaired two-sided Student’s t-test). Statistical analysis in (g): (Mann Whitney test). Data are mean ± SD in (a-c), (f-g) and (j-k).
Fig. 4.
Fig. 4.. PDCD4 and phospho-eIF4E control the translation of Hgf, Spp1 and Bgn
a, Western blot showing the levels of p-4EBP1, PDCD4, eIF4A, p-MNK, p-eIF4E, eIF4G and representative HSP90 in Ptenpc−/−;Trp53pc−/−prostate cancers compared to wild-type prostates. Densitometry values normalized to the respective loading control are indicated for each band. The experiment was performed once with n = 3 mice for each group. b, Model depicting the proposed mechanism by which PDCD4 loss and phosho-eIF4E cooperate to regulate translation and modulate the tumor microenvironment. c, Fold change enrichment for the indicated mRNAs in Pten-sh TC1 determined by RNA immunoprecipitation using, from right to left, control anti-IgG, total eIF4E antibody or phospho-eIF4E antibody, followed by qRT- PCR performed (at least n = 2 independent experiments). Data are mean ± SD. Statistical analysis between all groups (ordinary one-way ANOVA followed by Dunnett’s multiple comparisons test). d, Translation efficiency (polysomal mRNA expression/total mRNA expression) of Hgf, Spp1, Bgn, Isg15, Ccl8 and Pdgfb upon 500 nM eFT508 treatment and Pdcd4 rescue in Pten-sh TC1 prostate cancer cell line, determined by qRT- PCR (at least n = 2 independent experiments). Data are mean ± SD. Statistical analysis between all groups: (RM one-way ANOVA followed by Tukey’s multiple comparisons test).
Fig. 5.
Fig. 5.. eFT508 treatment inhibits tumor growth and PMN-MDSCs infiltration in Ptenpc−/−; Trp53pc−/− prostate cancer
a, Model depicting the proposed mechanism by which MNK1/2 inhibition by eFT508 may inhibit translation and modulate the tumor microenvironment. b, Representative H/E, Gr-1 and CD3 staining (n = 3 mice in each group). Scale Bar 50 μm. c, Volume of the anterior prostate glands (n = 3 mice in each group). d, Histopathological score (n = 3 mice in each group). Summary table with statistical analysis (bottom) (2-way ANOVA followed by Šídák’s multiple comparisons test; top). PIN, prostatic intraepithelial neoplasia. e, Translation efficiency (polysomal mRNA expression/total mRNA expression) of Bgn, Spp1 and Hgf in eFT508-treated and vehicle-treated prostate cancer. n = 3 prostate tumors for each group. Statistical analysis (two-tailed ratio paired t test). f, Western blot analysis showing the protein levels of HGF, SPP1, BGN, p-eIF4E, eIF4E and representative HSP90 in eFT508-treated and vehicle-treated prostate cancer. Densitometry values normalized to the respective loading control are indicated for each band. The experiment was repeated three independent times with similar results. g, Percentage of CD45+/CD11b+/Ly6Ghigh/Ly6Clow cells (PMN-MDSCs) inside the CD45+ population (n = 3 mice in each group). h, Percentage of CD45+/CD3+/CD8+ cells inside the CD45+ population (n = 3 mice in each group). i, Flow cytometric analysis of CFSE dilution in spleen-derived T cells co-cultured with bone marrow-derived MDSCs in a T cell suppression assay; MDSCs were incubated for 24 hours with c.m. of eFT508-treated prostate cancer cells. n = 3 biological replicates. The experiment was repeated two independent times with similar results. j, Tumor growth of RapidCap allografts in C57BL6 mice treated with eFT508 (20 mg/Kg) or the indicated depleting-antibodies: anti-Ly6G (150 μg/Kg) and anti-CD8 (200 μg/Kg) (from the top of the legend, n = 8, n = 9, n = 4, n = 5, n = 5, n = 5). Data are mean ± SEM. Statistical analysis between all groups and time points (multiple unpaired t test). k, Percentage of CD45+/CD11b+/Ly6Ghigh/Ly6Clow cells (PMN-MDSCs) inside the CD45+ population (from the left, n = 6, n = 9, n = 4, n = 5, n = 3, n = 4). l, Percentage of CD45+/CD3+/CD8+ cells inside the CD45+ population (from the left, n = 4, n = 7, n = 4, n = 4, n = 3, n = 4). Data are mean ± SD in (c-e, g-i, k-l). Statistical analysis (two-sided unpaired Student’s t-test) in (c) and (g-h). Statistical analysis between all groups (ordinary one-way ANOVA followed by Tukey’s multiple comparisons test) in (k) and (i) and one-way ANOVA followed by Dunnett’s multiple comparisons test in (l).
Fig. 6.
Fig. 6.. Dual eFT508 and ipatasertib treatment dampens tumor-growth, tumor-infiltrating PMN--MDSCs and increases CD8+ T cells in Ptenpc−/− Trp53pc−/− prostate cancer
a, Representative haematoxylin and eosin (H/E), PDCD4, p-eIF4E, Gr-1 and CD3 staining in the tumor at the completion of the study. (vehicle n = 5, eFT508 n = 5, ipa n = 6, eFT+ipa n = 6). Scale bar 50 μm. b, Quantification of the percentage of CD3+ cells infiltrating the glands in the tumors of the indicated treatment groups (from the left, n = 5, n = 5, n = 6, n = 6). c, Volume of the anterior prostate glands in Ptenpc−/−;Trp53pc−/− mice randomly assigned to the indicated treatment groups (from the left, n = 7, n = 6, n = 6, n = 6). d, Histopathological score of Ptenpc−/−;Trp53pc−/− prostate tumor glands in the indicated treatment groups (from the left, n = 5, n = 5, n = 6, n = 6). Summary table with statistical analysis (2-way ANOVA followed by Tukey’s multiple comparisons test) on the bottom. e, Western blot analysis showing the protein levels of PDCD4, HGF, SPP1 and BGN in Ptenpc−/−;Trp53pc−/− whole tumor lysates in the indicated treatment groups. Densitometry values normalized to the respective loading control are indicated for each band. The experiment was repeated two independent times with similar results. f, Percentage of CD45+/CD11b+/Ly6Ghigh/Ly6Clow cells (PMN-MDSCs) inside the CD45+ population in Ptenpc−/−;Trp53pc−/− prostate cancer (from the left, n = 4, n = 4, n = 6, n = 6). g, Percentage of CD45+/CD3+ cells inside the CD45+ population in Ptenpc−/−;Trp53pc−/− prostate cancer (n = 4 in each group). h, Percentage of CD45+/CD3+/CD8+ T cells (% of CD3+ T cells) inside the CD45+ population determined by flow cytometric analysis in Ptenpc−/−; Trp53pc−/− prostate cancer in the indicated treatment groups (n = 4 in each group). i, Model depicting the proposed mechanism by which ipatasertib and eFT508 inhibit protein synthesis of the immunosuppressive secretome. Data are mean ± SD. Statistical analysis in b,c,f,g,h between all groups: (ordinary one-way ANOVA followed by Tukey’s multiple comparisons test).
Fig. 7.
Fig. 7.. eFT508 or Ipatasertib enhances the anti-tumor immune response of AZD5069 in Ptenpc−/−;TMPRSS2/Ergpc+/+ prostate cancer
a, Representative H/E, Gr-1 and CD3 staining in the tumor. Scale bar 50 μm (vehicle n = 5, AZD5069 n = 4, eFT508 n = 9, AZD5069+ eFT508 n = 7). b, Volume of the anterior prostate glands (from the left, n = 6, n = 7, n = 10, n = 7). c, Histopathological score of prostate cancer glands (top). (from the left, n = 5, n = 4, n = 9, n = 7). Summary table with statistical analysis (2-way ANOVA followed by Tukey’s multiple comparisons test; bottom). d, Western blot showing the protein levels of HGF, SPP1, BGN, CXCL5, p-eIF4E, eIF4E and representative HSP90 in tumor lysates. Densitometry values normalized to the respective loading control are indicated for each band. The experiment was repeated two independent times with similar results. e, Percentage of tumor-infiltrating CD45+/CD11b+/Ly6Ghigh/Ly6Clow cells (PMN-MDSCs) inside the CD45+ population (from the left, n = 4, n = 4, n = 7, n = 7). f, Percentage of tumor-infiltrating CD45+/CD3+/CD8+ inside the CD45+ population (from the left, n = 4, n = 4, n = 7, n = 7). g, Representative H/E, Gr-1 and CD3 staining in the tumor. Scale bar 50 μm. (vehicle n = 4, AZD5069 n = 4, ipa n = 6, AZD5069+ipa n = 8). h, Volume of the anterior prostate glands (from the left, n = 5, n = 4, n = 7, n = 8). i, Histopathological score of prostate tumor glands (top). (from the left, n = 4, n = 4, n = 6, n = 8). Summary table with statistical analysis (2-way ANOVA followed by Tukey’s multiple comparisons test; bottom). j, Western blot showing the protein levels of HGF, SPP1, BGN, CXCL5 and representative HSP90 in whole tumor lysates. Densitometry values normalized to the respective loading control are indicated for each band. The experiment was repeated two independent times with similar results. k, Percentage of tumor-infiltrating CD45+/CD11b+/Ly6Ghigh/Ly6Clow cells (PMN-MDSCs) inside the CD45+ population (from the left, n = 5, n = 4, n = 7, n = 8). l, Percentage of tumor-infiltrating CD45+/CD3+/CD8+ inside the CD45+ population (from the left, n = 5, n = 4, n = 7, n = 8). Data are mean ± SD. Statistical analysis in (b), (e), (f), (h), (k) and (l) between all groups (ordinary one-way ANOVA followed by Tukey’s multiple comparisons test).
Fig. 8.
Fig. 8.. BGN, SPP1 and HGF are highly expressed in human prostate cancer and correlate with p-eIF4E and CD33 density
a, Representative IHC of BGN, SPP1 and HGF in benign prostate hyperplasia (BPH), prostate adenocarcinoma (PCa) and CRPC in Cohort 1 (n = 545). Scale bar 50 μm. b, Percentage of BGN, SPP1 and HGF negative and positive cases in BPH, prostate adenocarcinoma and CRPC in Cohort 1 for the indicated number of patients. Two-sided Fisher’s exact test. c, Representative IHC of BGN, SPP1, HGF and p-eIF4E showing negative (upper panel) and positive (lower panel) cases in prostate adenocarcinoma in cohort 1. Scale Bar 50 μm. d, Correlation between the co-expression of ≥ 2 ligands and p-eIF4E in prostate adenocarcinoma in Cohort 1 (n = 401). Two-sided Fisher’s exact test. e, Representative IHC of BGN, SPP1, HGF and PDCD4 showing the negative correlation in prostate adenocarcinoma in cohort 1. Scale Bar 50 μm. f, Correlation between the co-expression of ≥ 2 ligands and PDCD4 in prostate adenocarcinoma in Cohort 1 (n = 401); Two-sided Fisher’s exact test. g, Correlation between overall survival and co-expression of p-eIF4E and ≥ 2 ligands in prostate adenocarcinoma. The number of cases is indicated in the table below for each comparison. h, Correlation between overall survival and concomitant PDCD4 loss and expression of ≥ 2 ligands in prostate adenocarcinoma; The number of cases is indicated in the table below for each comparison. i, Representative IHC of BGN, SPP1, HGF and CD33 showing a positive correlation of BGN, SPP1 and HGF with p-eIF4E and CD33 in prostate adenocarcinoma in cohort 2. Scale Bar 50 μm. j, Correlation between the co-expression of ≥ 2 ligands and CD33 in prostate adenocarcinoma in cohort 2; Two-sided Fisher’s exact test.

References

    1. Kwon ED et al. Ipilimumab versus placebo after radiotherapy in patients with metastatic castration-resistant prostate cancer that had progressed after docetaxel chemotherapy (CA184–043): a multicentre, randomised, double-blind, phase 3 trial. Lancet Oncol 15, 700–712 (2014). 10.1016/S1470-2045(14)70189-5 - DOI - PMC - PubMed
    1. de Bono JS et al. Prostate carcinogenesis: inflammatory storms. Nat Rev Cancer 20, 455–469 (2020). 10.1038/s41568-020-0267-9 - DOI - PubMed
    1. Feng S et al. Myeloid-derived suppressor cells inhibit T cell activation through nitrating LCK in mouse cancers. Proc Natl Acad Sci U S A 115, 10094–10099 (2018). 10.1073/pnas.1800695115 - DOI - PMC - PubMed
    1. Veglia F, Sanseviero E & Gabrilovich DI Myeloid-derived suppressor cells in the era of increasing myeloid cell diversity. Nat Rev Immunol 21, 485–498 (2021). 10.1038/s41577-020-00490-y - DOI - PMC - PubMed
    1. Di Mitri D et al. Tumour-infiltrating Gr-1+ myeloid cells antagonize senescence in cancer. Nature 515, 134–137 (2014). 10.1038/nature13638 - DOI - PubMed

Publication types

MeSH terms