. 2023 Aug;30(8):1077-1091.
doi: 10.1038/s41594-023-01033-4. Epub 2023 Jul 17.

Sperm chromatin structure and reproductive fitness are altered by substitution of a single amino acid in mouse protamine 1

Affiliations

Sperm chromatin structure and reproductive fitness are altered by substitution of a single amino acid in mouse protamine 1

Lindsay Moritz et al. Nat Struct Mol Biol. 2023 Aug.

Abstract

Conventional dogma presumes that protamine-mediated DNA compaction in sperm is achieved by electrostatic interactions between DNA and the arginine-rich core of protamines. Phylogenetic analysis reveals several non-arginine residues conserved within, but not across species. The significance of these residues and their post-translational modifications are poorly understood. Here, we investigated the role of K49, a rodent-specific lysine residue in protamine 1 (P1) that is acetylated early in spermiogenesis and retained in sperm. In sperm, alanine substitution (P1(K49A)) decreases sperm motility and male fertility-defects that are not rescued by arginine substitution (P1(K49R)). In zygotes, P1(K49A) leads to premature male pronuclear decompaction, altered DNA replication, and embryonic arrest. In vitro, P1(K49A) decreases protamine-DNA binding and alters DNA compaction and decompaction kinetics. Hence, a single amino acid substitution outside the P1 arginine core is sufficient to profoundly alter protein function and developmental outcomes, suggesting that protamine non-arginine residues are essential for reproductive fitness.


Conflict of interest statement

Competing interests

The authors have no competing interests.

Figures
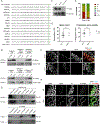
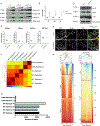
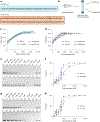
Extended Data Fig. 1 |
Extended Data Fig. 1 |. The P1 K49 residue is highly conserved across the mouse lineage and the custom antibody against P1 K49ac is specific.
(a) Alignment of P1 amino acid sequences across multiple mouse species illustrates conservation of P1. (b) Immunoblot of acid extracted protein lysates from mature sperm illustrates a clear band for P1 K49ac that is competed off only in the presence of a specific peptide containing acetylated P1 at K49 (top blot using a non-specific, unrelated peptide and bottom blot using a P1 non-acetylated peptide). Shown are representative immunoblots and similar results were obtained from n = 3 independent experiments. (c) Acid urea immunoblot of protein lysates from P1+/+, P1K49A/+, and P1K49A/K49A sperm probed for P1 K49ac illustrates specificity of the antibody. Shown is a representative blot and similar results were obtained from n = 2 experiments. (d) Quantification of synchronization efficiency in testes collected 23- and 24 days-post retinoic acid (RA) injection illustrates successful synchronization and enrichment of stage VIII-X elongating spermatids. Similar results were obtained from n = 4 independent experiments. (e) Total epididymal sperm count (left) and progressive sperm motility after 1 hour (right) for P1+/+ and P1V5/+ males (n = 5 P1+/+ males and n = 4 P1V5/+ males). Statistical test was performed using an unpaired, two-tailed t-test, p = 0.4032 for sperm count and p = 0.8787 for sperm motility. Center line represents the mean and error bars represent standard deviation. Each dot represents a measurement from a single animal. (f) Immunofluorescence of adult P1+/+ or P1V5/+ testes cross sections illustrates specificity of staining for the V5 tag. Scale bars: 20 μm. Shown are representative images and similar results were obtained from n = 3 independent experiments. (g) Immunoblots of subcellular fractions of elongating spermatids from synchronized testes lysates (days 23 and 24 post RA) for total P1 (V5-P1) and P1 K49ac. MNase, 0.5 M NaCl, 1 M NaCl, 2 M NaCl, and pellet represent nuclear fractions of increasing inaccessibility. Shown are representative immunoblots and similar results were obtained from n = 4 independent experiments. (h) Immunofluorescence of synchronized testes cross-sections days 23 and 24 post RA. Scale bars: 20 μm. Shown are representative images and similar results were obtained from n = 4 independent experiments.
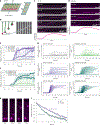
Extended Data Fig. 2 |
Extended Data Fig. 2 |. P1 K49A substitution results in sperm motility defects and subfertility.
(a) List of potential off-targets and corresponding sequencing results verify no off-target modifications generated by CRISPR/Cas9 editing. (b) Testes/body weight ratio of P1+/+, P1K49A/+, and P1K49A/K49A males (n = 4 per genotype) suggests no loss of germ cell populations due to P1 K49A substitution. Each dot represents a measurement from a single animal. Statistical test was performed using a one-way ANOVA and adjusted for multiple comparisons. Center line represents the mean and error bars represent standard deviation. (c) Periodic acid Schiff (PAS)-stained adult testes cross sections highlights normal testis morphology in P1K49A/K49A males. Scale bars: 50 μm. Shown are representative images and similar results were obtained from n = 2 males. (d) Acid urea immunoblot of acid-extracted testes from P1+/+, P1K49A/+, and P1K49A/K49A males shows comparable expression of P1 across all genotypes. Shown are representative immunoblots and similar results were obtained from n = 2 independent experiments.
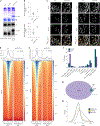
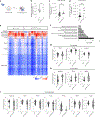
Extended Data Fig. 3 |
Extended Data Fig. 3 |. P1 K49A substitution results in abnormal histone retention and altered histone PTMs in mature sperm.
(a) Immunoblotting of sperm protein extracts reveals an abnormal retention of histones in P1K49A/K49A sperm. Blots were loaded by total input sperm number. Exact sperm numbers for the various antibodies provided in Methods section. (b) Quantification of immunoblots showing fold change of histone retention in P1K49A/K49A males. Data were collected from sperm from a total of n = 3 independent males per genotype. Across the 3 biological replicates, a total of n = 12 technical replicates were performed for H3, n = 9 technical replicates for H2B, and n = 7 technical replicates for H4. Each dot represents a single technical replicate measurement. Center line represents the mean and error bars represent standard deviation. (c) Immunoblots of protein lysates from P1+/+ and P1K49A/K49A elongating spermatid-enriched testes lysate illustrates no difference in ac-H4, TNP2, or TNP1 levels. Shown are representative immunoblots and similar results were obtained from n = 2 independent experiments. (d) Quantification of abundance of histone H4 K5/K8/K12/K16 acetylation retained in P1+/+ and P1K49A/K49A sperm. Each dot represents measurement from a single technical replicate (n = 3 technical replicates per genotype). Each biological sample (n = 1 per genotype) was prepared from a pool of sperm from n = 5 males per genotype. Center line represents the mean and error bars represent standard deviation. (e) Immunofluorescence staining of adult P1+/+ or P1K49A/K49A testes cross sections stained for TNP1. Scale bars: 20 μm. Shown are representative images and similar results were obtained from n = 3 independent males. (f) Pearson correlation and hierarchical clustering shows high correlation between replicates and between WT and mutant datasets. (g) Number of peaks identified in each replicate dataset. (h) Genome-wide distribution of MNase-seq reads with respect to transcriptional start sites (TSS) of coding genes from mm10 reference genome. The region in the map is centered at the TSS and spans 2.5 kb on both sides of the TSS. Average profiles across gene regions ±2.5 kb for MNase-seq reads are shown on top.
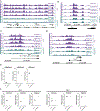
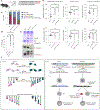
Extended Data Fig. 4 |
Extended Data Fig. 4 |. P1 K49A sperm exhibit less fixed histone retention patterns and altered histone PTMs.
(ad) Genome browser tracks of nucleosomes enriched at developmental loci and imprinted genes. (e, f) Quantification of abundance of various histone H3 PTMs retained in P1+/+ and P1K49A/K49A sperm. Each dot represents measurement from a single technical replicate (n = 3 technical replicates per genotype) and each biological sample (n = 1 per genotype) was prepared from a pool of sperm from n = 5 males per genotype. Center line represents the mean and error bars represent standard deviation.
Extended Data Fig. 5 |
Extended Data Fig. 5 |. Purified protamines are free of contaminating histones and their binding to DNA is unaffected by incubation time.
(a) Immunoblot of input (prior to size exclusion chromatography) protein, purified P1 (WT or K49A), and purified P2 (WT or pro P2) illustrating efficient separation of P1 and P2 from each other and absence of histones in the final purified protein. Shown are representative immunoblots and similar results were obtained from n = 3 independent experiments. (b) Coomassie-stained SDS-PAGE gel of purified proteins illustrating high purity and equivalent concentrations. Shown is a representative gel and similar results were obtained from n = 4 independent experiments. (c) Proteinase K treatment of EMSA reactions after 1 hour of equilibration with DNA. (d,e) Quantification of binding affinities of WT P1 (d) and P1 K49A (e) after 10 minutes, 1 hour, or 4 hours of equilibration with DNA. Data are presented as an average of n = 4 technical replicates across n = 3 biologically independent samples for WT P1 10 minutes, n = 8 technical replicates across n = 3 biologically independent samples for WT P1 1 hour, n = 6 technical replicates across n = 3 biologically independent samples for WT P1 4 hours, n = 4 technical replicates across n = 3 biologically independent samples for P1 K49A 10 minutes, n = 9 technical replicates across n = 3 biologically independent samples for P1 K49A 1 hour, and n = 4 technical replicates across n = 3 biologically independent samples for P1 K49A 4 hours. Error bars represent standard deviation. (f, g) Quantification of binding affinities of WT P2 (f) and pro P2 (g) after 10 minutes, 1 hour, or 4 hours of equilibration with DNA. Data are presented as an average of n = 4 technical replicates across n = 3 biologically independent samples for WT P2 10 minutes, n = 9 technical replicates across n = 3 biologically independent samples for WT P2 1 hour, n = 4 technical replicates across n = 3 biologically independent samples for WT P2 4 hours, n = 3 technical replicates across n = 3 biologically independent samples for pro P2 10 minutes, n = 8 technical replicates across n = 3 biologically independent samples for pro P2 1 hour, and n = 4 technical replicates across n = 3 biologically independent samples for pro P2 4 hours. Error bars represent standard deviation. (h) Quantification of the binding affinities of P1 (either WT or K49A) and P2 (either WT or pro P2) mixed at a 1:2 ratio to a linear ~300 bp DNA fragment. Data are presented as an average of n = 4 technical replicates across n = 2 biologically independent samples for WT P1 + WT P2, n = 4 technical replicates across n = 2 biologically independent samples for WT P1 + pro P2, n = 3 technical replicates across n = 2 biologically independent samples for P1 K49A + WT P2, and n = 4 technical replicates across n = 2 biologically independent samples for P1 K49A + pro P2. Error bars represent standard deviation. (i) Representative EMSAs of titrations of increasing amounts of indicated P1 and P2 mixed at a 1:2 ratio. Data are presented as an average of n = 4 technical replicates for all protein combinations except P1 K49A + WT P2 (n = 3 technical replicates) across n = 2 biologically independent samples. Error bars represent standard deviation.
Extended Data Fig. 6 |
Extended Data Fig. 6 |. P1 K49A substitution alters DNA compaction and decompaction kinetics in vitro.
(a) Representative kymographs of WT P2 induced DNA compaction at increasing protein concentrations. (b) Representative kymographs of pro P2 induced DNA compaction at increasing protein concentrations. (c) Average DNA compaction by WT P2 at increasing concentrations. Error bars represent standard deviation (n = 71 traces for 200 nM, n = 63 for 225 nM, n = 95 for 250 nM, and n = 108 for 275 nM). (d) Average DNA compaction by pro P2 at increasing concentrations. Error bars represent standard deviation (n = 74 traces for 150 nM, n = 54 for 175 nM, n = 62 for 200 nM, n = 64 for 225 nM, and n = 65 for 250 nM). (e) Traces of individually tracked DNA molecules over time at low or high concentration of either WT P2 (left panels) or pro P2 (right panels) illustrating cooperative behavior. (f) Decompaction of DNA initially compacted by WT P2 and pro P2 over time illustrates differences in decompaction rates. Data were collected from n = 3 independent experiments (n = 3 flow cells per each independent experiment) for each protein. A total of n = 66 single DNA molecules were measured for WT P2 and n = 99 single DNA molecules were measured for pro P2. Error bars represent SEM.
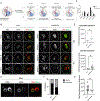
Extended Data Fig. 7 |
Extended Data Fig. 7 |. P1 K49A substitution results in premature decompaction of paternal chromatin, altered DNA replication kinetics, and stalling at the zygote stage.
(a) Cartoon representation of the four main stages of DNA replication in the mouse embryo as defined by Aoki and Schultz. (b) Immunofluorescence of zygotes collected 8.5 hpf and stained for BrdU. Representative images from each category are shown for both genotypes. Male and female pronuclei were identified based on proximity to the polar body (female being closer). Scale bars: 10 μm. Shown are representative images and similar results were obtained from n = 3 independent experiments. (c) Percent of WT and mutant embryos belonging to each category of DNA replication as defined in panel a. (d) Representative mutant embryo exhibiting altered DNA replication kinetics belonging to the ‘other’ category. Scale bar: 20 μm. Shown are representative images and similar results were obtained from n = 3 independent experiments. (e) Total fluorescence intensity measurements of BrdU per embryo indicates normal progression of DNA replication through early replication, but a stalling in late replication. Intensity measurements were taken from a total of n = 5 early replicating P1+/+ embryos, n = 7 early replicating P1K49A/K49A embryos, n = 11 late replicating P1+/+ embryos, and n = 21 late replicating P1K49A/K49A embryos. Statistical tests were performed using an unpaired, two-tailed t-test, p = 0.0325 for late replication. Center line represents the median. (f) Proportion of WT and mutant embryos collected at 30 hours post ICSI injection containing micro or multiple nuclei. (g) Total Zscan4 fluorescence intensity per blastomere for WT and mutant 2 cell embryos collected 26–30 hours post fertilization highlights a decrease in Zscan4 protein in mutant embryos. Intensity measurements were taken from a total of n = 38 P1+/+ blastomeres and a total of n = 10 P1K49A/K49A blastomeres. Statistical test was performed using an unpaired, two-tailed t-test, p = 0.0339. Center line represents the median.
Fig. 1 |
Fig. 1 |. P1(K49ac) is acquired in the spermatid nucleus in a stage-specific manner and persists in mature mouse sperm.
a, Schematic representation of modifications identified in the present study or by Brunner et al. on mouse P1. b, Phylogenetic tree across the orders Rodentia, Primate, and Artiodactyla, using the WAG substitution strategy. Bootstrap support with 1,000 replicates is shown for each node, with values >95 indicating strong support. S9 is highlighted across species in blue and K49 is highlighted across rodents in green and in gray across more distant species that occupy alternative residues at this site. c, Immunofluorescence staining of P1(K49ac) in adult testes cross-sections at various seminiferous tubule stages, using PNA-lectin as the acrosomal marker. Representative images from n = 2 mice per time point. Scale bar, 20 μm. d, Quantification of P1(K49ac) stage specificity across all stages of the seminiferous epithelial cycle in adult males, highlighting specificity to late-stage VIII–XI tubules. A total of n = 438 tubules were counted across all stages from a total of n = 4 mice. e, Immunoblot of P1(K49ac) from elongating spermatidenriched testes lysate, mature sperm from the epididymis, and mature sperm from the vas deferens highlights the persistence of the acetylation mark into mature sperm. Shown is a representative blot, and the experiment was repeated n = 3 independent times with similar results.
Fig. 2 |
Fig. 2 |. P1(K49A) results in sperm motility defects and subfertility.
a, Schematic of the modification made to the mouse P1 sequence and corresponding Sanger sequencing traces illustrating successful mutation of K49 to alanine. A few synonymous alterations were incorporated into the donor DNA to introduce an FspI site for genotyping purposes. b, Total epididymal sperm count (n = 4 males for each genotype). Each dot represents measurement from a single animal. Statistical tests were performed using a one-way analysis of variance (ANOVA) and adjusted for multiple comparisons. The center line represents the mean, and error bars represent the s.d. c, Epididymal sperm progressive motility after 1 h of incubation at 37 °C; n = 4 males for each genotype. Each dot represents a measurement from a single animal. Statistical tests were performed using a one-way ANOVA and adjusted for multiple comparisons; P = 0.0008 between P1+/+ and P1K49A/K49A and P= 0.0113 between P1K49A/+ and P1K49A/K49A. The center line represents the mean, and error bars represent the s.d. d, Representative mature sperm, stained with hematoxylin and eosin, from a P1K49A/K49A adult male, highlighting major abnormalities. Scale bar, 20 μm. e, Quantification of major abnormalities observed in P1+/+ and P1K49A/K49A mature sperm. Sperm was assessed from n = 2 P1+/+ males and n = 3 P1K49A/K49A males. f, Fertility assessment of n = 3 adult males per genotype, as measured by percentage of females impregnated (n = 3 females per male). Each dot represents measurement from a single animal. Statistical testing was performed using a Kruskal–Wallis test and with adjustment for multiple comparisons; P = 0.0266. The center line represents the mean, and error bars represent the s.d. n.s., not significant.
Fig. 3 |
Fig. 3 |. P1(K49A) substitution alters sperm chromatin composition.
a, Acid urea gel electrophoresis of sperm basic proteins reveals a shift in P1:P2 ratio in P1K49A/K49A males by Coomassie blue staining (top). Immunoblotting reveals no difference in P1 level but an accumulation of pro P2 (bottom panels). P1:P2 ratios, as quantified in ImageJ, are displayed below the immunoblot. b, Quantification of retained histone H3 (top) and histone H2B (bottom) in P1+/+ or P1K49A/K49A sperm, as determined by quantitative bottom-up MS. Statistical analyses were performed using a nested, two-tailed t-test, P = 0.0543 for H3 and P = 0.0221 for H2B. The center line represents the mean, and error bars represent the s.d. Each dot represents the average of three technical replicate measurements for a single biological replicate (n = 3 biological replicates per genotype). c, Immunofluorescence staining of adult P1+/+ or P1K49A/K49A testes cross-sections for ac-H4 (left panels) or TNP2 (right panels). Scale bar, 20 μm. Shown are representative images, and similar results were obtained from n = 3 independent males. d, Heatmap showing enrichment of genome-wide MNase-seq signal ±2.5 kb from the TSS (bottom) and corresponding enrichment profiles (top). Units next to the color bars indicate normalized fold enrichment. e, Heatmap showing enrichment of MNase-seq signal around regions called as peaks in both WT and mutant ±2.5 kb from the peak center (bottom), and corresponding enrichment profiles (top). Units next to the color bars indicate normalized fold enrichment. f, Bar plot depicting enrichment of nucleosome peaks in either P1+/+ or P1K49A/K49A sperm across various genomic features. g, Venn diagram of overlapped MNase-seq peaks (FDR ≥ 5%) between wild-type (WT) and mutant sperm. h, GC percentage of nucleotide sequences at peaks in WT and mutant sperm.
Fig. 4 |
Fig. 4 |. Protamine–DNA binding ability varies with DNA length.
a, Schematic of mouse P1 and P2 sequences. Blue bar in P2 indicates cleavage site. b, Scheme for purifying P1 and P2 from mature mouse sperm. c,d, Quantification of the binding affinities of wild-type (WT) P1 and P1(K49A) (c) or WT P2 and pro P2 (d) to a linear 99-bp 5′-FAM labeled DNA fragment using fluorescence anisotropy. Kd,app values were calculated using the Hill equation and were taken from n = 3 biologically independent samples per protein over 3 independent experiments. For each time point of each independent experiment, a total of 22 replicate measurements were averaged. Error bars represent s.e.m. e, Representative EMSAs of a titration of increasing amounts of WT P1 (top) or P1(K49A) (bottom) illustrating their interaction with a ~300 bp DNA fragment. f, Quantification of the binding affinities of WT P1 and P1(K49A) to a linear ~300-bp DNA fragment, determined by EMSA. Kd,app values were calculated using the Hill equation and are presented as an average of n = 8 technical replicates across n = 3 biologically independent samples for WT P1 and n = 9 technical replicates across n = 3 biologically independent samples for P1(K49A). Error bars represent s.d. g, Representative EMSAs of a titration of increasing amounts of WT P2 (top) or pro P2 (bottom) illustrating their interaction with a ~300-bp DNA fragment. h, Quantification of the binding affinities of WT P2 and pro P2 to a linear ~300-bp DNA fragment determined by EMSA. Kd,app values were calculated using the Hill equation and are presented as an average of n = 9 technical replicates across n = 3 biologically independent samples for WT P2 and n = 8 technical replicates across n = 3 biologically independent samples for pro P2. Error bars represent s.d.
Fig. 5 |
Fig. 5 |. P1(K49A) substitution alters DNA compaction and decompaction kinetics in vitro.
a, Schematic of DNA curtains. DNA molecules are labeled at the 3′ end by dCas9 (shown in pink). b, Cartoon representation shown aside actual images of protamine-driven DNA compaction. c,d, Representative kymographs of DNA compaction induced by WT P1 (c) or P1(K49A) (d) at increasing protein concentrations. e, Average DNA compaction by WT P1 at increasing concentrations. Error bars represent s.d. (n = 78 traces for 100 nM, n = 67 for 125 nM, n = 78 for 150 nM, n = 63 for 175 nM, and n = 66 for 200 nM). f, Average DNA compaction by P1(K49A) at increasing concentrations. Error bars represent s.d. (n = 48 traces for 200 nM, n = 74 for 225 nM, n = 68 for 250 nM, and n = 81 for 275 nM). g, Traces of individually tracked DNA molecules over time at a low, intermediate, or high concentration of either WT P1 (left panels) or P1(K49A) (right panels), illustrating cooperative behavior. h, Representative image of WT P1-driven compaction of adjacent DNA molecules within the curtain, highlighting differences in compaction even between DNA molecules that are beside each other. i, Decompaction of DNA initially compacted by WT P1 and P1(K49A) over time illustrates differences in decompaction rates. Data were collected from n = 3 independent experiments (n = 3 flow cells per experiment) for each protein. A total of n = 142 single DNA molecules were measured for WT P1 and n = 133 single DNA molecules were measured for P1(K49A). Error bars represent s.e.m.
Fig. 6 |
Fig. 6 |. The K49A substitution in P1 results in decreased blastocyst formation, accelerated decondensation of paternal chromatin, and altered gene expression.
a, Experimental scheme for assessing pronuclear size. b, Quantification of relative male pronuclear size (male/female) in zygotes derived from either P1+/+ or P1K49A/K49A sperm. Statistical testing was done using an unpaired, two-sided t-test, P = 0.0075. Quantification was performed from a total of n = 12 P1+/+ zygotes and n = 13 P1K49A/K49A zygotes. The center line represents the median. c, Total gH2AX fluorescence intensity per blastomere in P1+/+ and P1K49A/K49A two-cell embryos. Embryos containing micronuclei or multiple nuclei were not included. Measurements were taken from a total of n = 38 blastomeres from WT embryos and a total of n = 10 blastomeres from mutant embryos. Statistical testing was done using an unpaired, two-sided t-test, P = 0.0023. Center line represents the median. d, Total EU fluorescence intensity per blastomere in P1+/+ and P1K49A/K49A two-cell embryos. Embryos containing micronuclei or multiple nuclei were not included. Measurements were taken from a total of n = 38 WT blastomeres and a total of n = 10 mutant blastomeres. Statistical testing was performed using an unpaired, two-sided t-test, P = 0.0003. The center line represents the median. e, Heatmap of the correlation matrix between our 27 two-cell embryos (11 WT and 16 K49A) (left to right) and an external dataset of 286 samples (top to bottom), covering multiple stages of mouse preimplantation development and showing a high degree of transcriptomic similarity of both WT and mutant embryos with previously published mid- and late-two-cell mouse embryos. Color bar represents Pearson correlation coefficient (r). Color range: blue-minimal correlation coefficient value of 0.141; red-maximal value of 0.701. f, Gene Ontology analysis of genes that are downregulated in mutant two-cell embryos compared with WT. gi, Violin plots of individual representative genes whose expression is either unchanged (g), upregulated (h), or downregulated (i) in mutant two-cell embryos compared with WT embryos. Data from n = 10 WT embryos and n = 13 mutant embryos are included.
Fig. 7 |
Fig. 7 |. Defects in P1K49A/K49A males are not driven simply by changes to protamine–DNA electrostatics.
a, Cartoon schematic of additional modifications made to mouse P1. b, Testes/body weight ratio, total sperm count, and progressive sperm motility for P1(K49R) and P1(Δ46–51) lines. For K49R phenotyping, data were collected from a total of n = 5 P1+/+ males, n = 3 P1K49R/+ males, and n = 4 P1K49R/K49R males. For P1Δ46–51 phenotyping, data were collected from n = 5 P1+/+ males, n = 7 P1Δ46–51/+ males, and n = 4 P1Δ46–51/Δ46–51 males. Each dot represents a measurement from a single animal. Statistical tests were performed using a one-way ANOVA and were adjusted for multiple comparisons. For P1(Δ46–51) testes to body weight ratio, P = 0.0014 between P1+/+ and P1Δ46–51/Δ46–51, P = 0.0182 between P1Δ46–51/+ and P1Δ46–51/Δ46–51; for P1(Δ46–51) sperm count, P = 0.0041 between P1+/+ and P1Δ46–51/Δ46–51; for P1 Δ46–51 progressive motility, P = 0.000000453 between P1+/+ and P1Δ46–51/Δ46–51 and P = 0.000000361 between P1+/+ and P1Δ46–51/+. For P1(K49R) progressive motility, P = 0.0014 between P1+/+ and P1K49R/K49R, P = 0.0178 between P1K49R/+ and P1K49R/K49R. For all plots, the center line represents the mean and error bars represent the s.d. c, Quantification of sperm morphological abnormalities observed in WT, homozygous P1(K49R), and homozygous P1 Δ46–51 males. A total of n = 585 WT, n = 239 P1K49R/K49R, and n = 246 P1Δ46–51/Δ46–51 sperm were assessed. d, Quantification of RNA expression in P1+/+, P1Δ46−51/+, and P1Δ46−51/Δ46−51 testes. Data were collected from n = 3 biologically independent samples, and each data point represents measurement from a single biological sample. A total of n = 3 technical replicates were performed from each biological sample and averaged for the final value. The center line represents the mean and error bars represent the s.d. Statistical tests were performed using a one-way ANOVA and were adjusted for multiple comparisons, P = 0.0066 between P1+/+ and P1Δ46−51/+, P = 0.0031 between P1+/+ and P1Δ46−51/Δ46–51. e, Acid urea gel electrophoresis of sperm basic proteins reveals lower efficiency of incorporation of the truncated P1 protein into sperm chromatin and an alteration in P1:P2 ratio in both P1Δ46−51/+ and P1Δ46−51/Δ46−51 sperm. Shown is a representative acid urea gel and immunoblot, and similar results were obtained from n = 3 independent males. f, Model of in vivo and in vitro consequences of the P1(K49A) substitution.

References

    1. Tachiwana H, Osakabe A, Kimura H. & Kurumizaka H. Nucleosome formation with the testis-specific histone H3 variant, H3t, by human nucleosome assembly proteins in vitro. Nucleic Acids Res. 36, 2208–2218 (2008). - PMC - PubMed
    1. Tachiwana H. et al. Structural basis of instability of the nucleosome containing a testis-specific histone variant, human H3T. Proc. Natl Acad. Sci. USA 107, 10454–10459 (2010). - PMC - PubMed
    1. Ueda J. et al. Testis-specific histone variant H3t gene is essential for entry into spermatogenesis. Cell Rep. 18, 593–600 (2017). - PubMed
    1. Barral S. et al. Histone variant H2A.L.2 guides transition protein-dependent protamine assembly in male germ cells. Mol. Cell 66, 89–101 (2017). - PubMed
    1. Yan W, Ma L, Burns KH & Matzuk MM HILS1 is a spermatid-specific linker histone H1-like protein implicated in chromatin remodeling during mammalian spermiogenesis. Proc. Natl. Acad. Sci. USA 100, 10546–10551 (2003). - PMC - PubMed

Publication types