

Development and characterization of a fecal-induced peritonitis model of murine sepsis: results from a multi-laboratory study and iterative modification of experimental conditions
- PMID: 37460911
- PMCID: PMC10352196
- DOI: 10.1186/s40635-023-00533-3
Development and characterization of a fecal-induced peritonitis model of murine sepsis: results from a multi-laboratory study and iterative modification of experimental conditions
Abstract
Background: Preclinical sepsis models have been criticized for their inability to recapitulate human sepsis and suffer from methodological shortcomings that limit external validity and reproducibility. The National Preclinical Sepsis Platform (NPSP) is a consortium of basic science researchers, veterinarians, and stakeholders in Canada undertaking standardized multi-laboratory sepsis research to increase the efficacy and efficiency of bench-to-bedside translation. In this study, we aimed to develop and characterize a 72-h fecal-induced peritonitis (FIP) model of murine sepsis conducted in two independent laboratories. The experimental protocol was optimized by sequentially modifying dose of fecal slurry and timing of antibiotics in an iterative fashion, and then repeating the experimental series at site 1 and site 2.
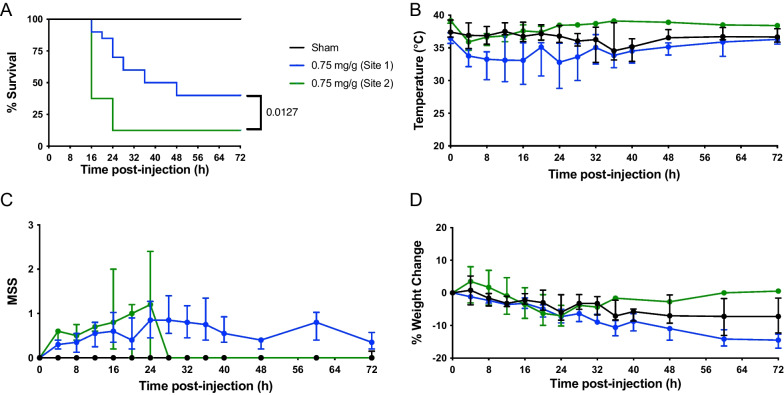
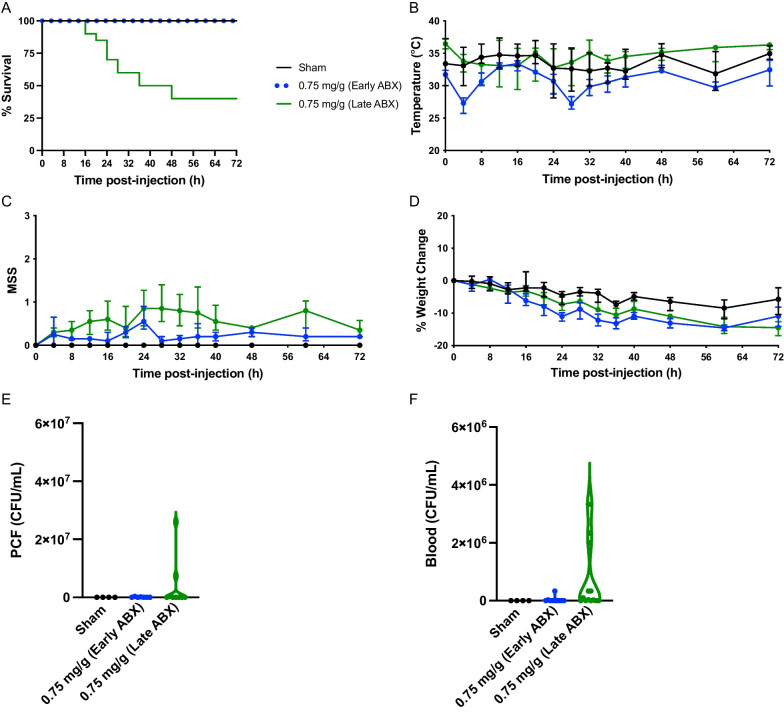
Results: Escalating doses of fecal slurry (0.5-2.5 mg/g) resulted in increased disease severity, as assessed by the modified Murine Sepsis Score (MSS). However, the MSS was poorly associated with progression to death during the experiments, and mice were found dead without elevated MSS scores. Administration of early antibiotics within 4 h of inoculation rescued the animals from sepsis compared with late administration of antibiotics after 12 h, as evidenced by 100% survival and reduced bacterial load in peritoneum and blood in the early antibiotic group. Site 1 and site 2 had statistically significant differences in mortality (60% vs 88%; p < 0.05) for the same dose of fecal slurry (0.75 mg/g) and marked differences in body temperature between groups.
Conclusions: We demonstrate a systematic approach to optimizing a 72-h FIP model of murine sepsis for use in multi-laboratory studies. Alterations to experimental conditions, such as dose of fecal slurry and timing of antibiotics, have clear impact on outcomes. Differences in mortality between sites despite rigorous standardization warrants further investigations to better understand inter-laboratory variation and methodological design in preclinical studies.
Keywords: Animal models of sepsis; Fecal-induced peritonitis; Multi-laboratory; National Preclinical Sepsis Platform; Preclinical reproducibility; Preclinical sepsis; Sepsis.
© 2023. The Author(s).
Conflict of interest statement
The authors declare that they have no competing interests.
Figures


Similar articles
-
Impact of age on the host response to sepsis in a murine model of fecal-induced peritonitis.Intensive Care Med Exp. 2024 Mar 8;12(1):28. doi: 10.1186/s40635-024-00609-8. Intensive Care Med Exp. 2024. PMID: 38457063 Free PMC article.
-
National Preclinical Sepsis Platform: developing a framework for accelerating innovation in Canadian sepsis research.Intensive Care Med Exp. 2021 Mar 19;9(1):14. doi: 10.1186/s40635-020-00366-4. Intensive Care Med Exp. 2021. PMID: 33738642 Free PMC article.
-
Prophylactic zinc supplementation reduces bacterial load and improves survival in a murine model of sepsis.Pediatr Crit Care Med. 2012 Sep;13(5):e323-9. doi: 10.1097/PCC.0b013e31824fbd90. Pediatr Crit Care Med. 2012. PMID: 22760431 Free PMC article.
-
Antibiotic induced endotoxin release and clinical sepsis: a review.J Chemother. 2001 Nov;13 Spec No 1(1):159-72. doi: 10.1179/joc.2001.13.Supplement-2.159. J Chemother. 2001. PMID: 11936361 Review.
-
Of mice and men: Laboratory murine models for recapitulating the immunosuppression of human sepsis.Front Immunol. 2022 Aug 5;13:956448. doi: 10.3389/fimmu.2022.956448. eCollection 2022. Front Immunol. 2022. PMID: 35990662 Free PMC article. Review.
Cited by
-
Probiotic bacteria-released extracellular vesicles enhance macrophage phagocytosis in polymicrobial sepsis by activating the FPR1/2 pathway.Mol Med. 2024 Nov 14;30(1):216. doi: 10.1186/s10020-024-00959-9. Mol Med. 2024. PMID: 39543493 Free PMC article.
-
Sepsis and obesity: a scoping review of diet-induced obesity murine models.Intensive Care Med Exp. 2024 Feb 23;12(1):15. doi: 10.1186/s40635-024-00603-0. Intensive Care Med Exp. 2024. PMID: 38388878 Free PMC article.
-
Red Blood Cell-Induced Bacterial Margination Improves Microbial Hemoadsorption on Engineered Cell-Depleted Thrombi, Restoring Severe Bacteremia in Rats.Adv Sci (Weinh). 2025 Aug;12(29):e2417498. doi: 10.1002/advs.202417498. Epub 2025 Apr 26. Adv Sci (Weinh). 2025. PMID: 40285645 Free PMC article.
-
Impact of age on the host response to sepsis in a murine model of fecal-induced peritonitis.Intensive Care Med Exp. 2024 Mar 8;12(1):28. doi: 10.1186/s40635-024-00609-8. Intensive Care Med Exp. 2024. PMID: 38457063 Free PMC article.
-
Metamizole outperforms meloxicam in sepsis: insights on analgesics, survival and immunomodulation in the peritoneal contamination and infection sepsis model.Front Immunol. 2024 Aug 30;15:1432307. doi: 10.3389/fimmu.2024.1432307. eCollection 2024. Front Immunol. 2024. PMID: 39281680 Free PMC article.
References
LinkOut - more resources
Full Text Sources
