. 2023 Jul 17;42(1):170.
doi: 10.1186/s13046-023-02754-6.

Interrogating colorectal cancer metastasis to liver: a search for clinically viable compounds and mechanistic insights in colorectal cancer Patient Derived Organoids

Affiliations

Interrogating colorectal cancer metastasis to liver: a search for clinically viable compounds and mechanistic insights in colorectal cancer Patient Derived Organoids

Mario Cioce et al. J Exp Clin Cancer Res. .

Abstract

Background: Approximately 20-50% of patients presenting with localized colorectal cancer progress to stage IV metastatic disease (mCRC) following initial treatment and this is a major prognostic determinant. Here, we have interrogated a heterogeneous set of primary colorectal cancer (CRC), liver CRC metastases and adjacent liver tissue to identify molecular determinants of the colon to liver spreading. Screening Food and Drug Administration (FDA) approved drugs for their ability to interfere with an identified colon to liver metastasis signature may help filling an unmet therapeutic need.

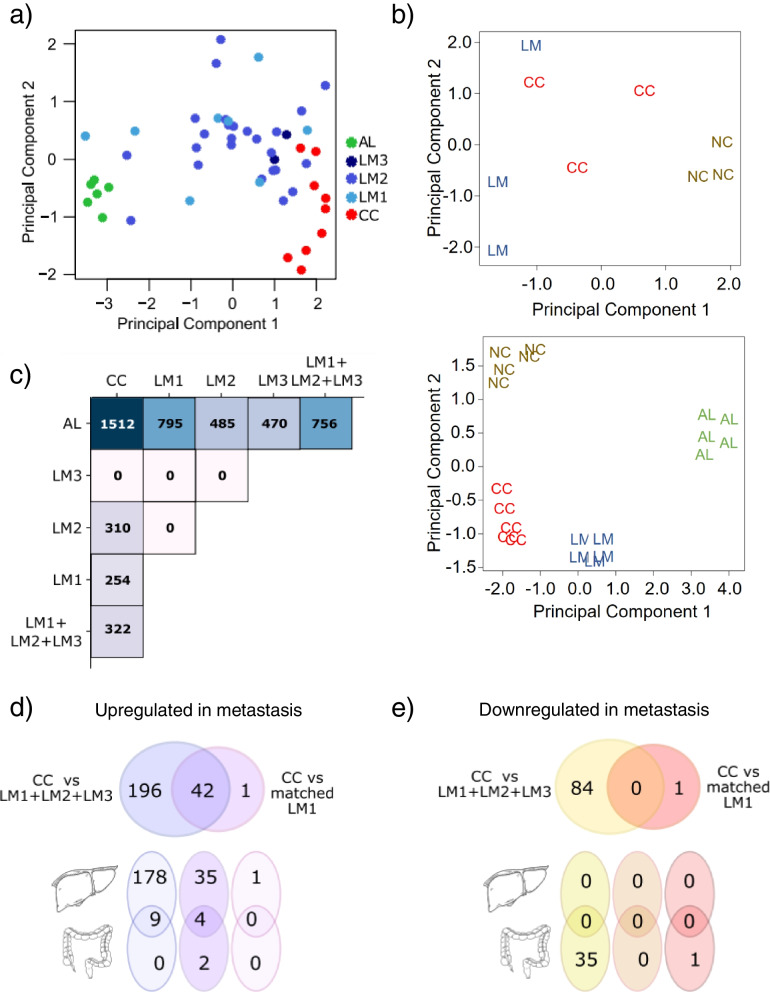
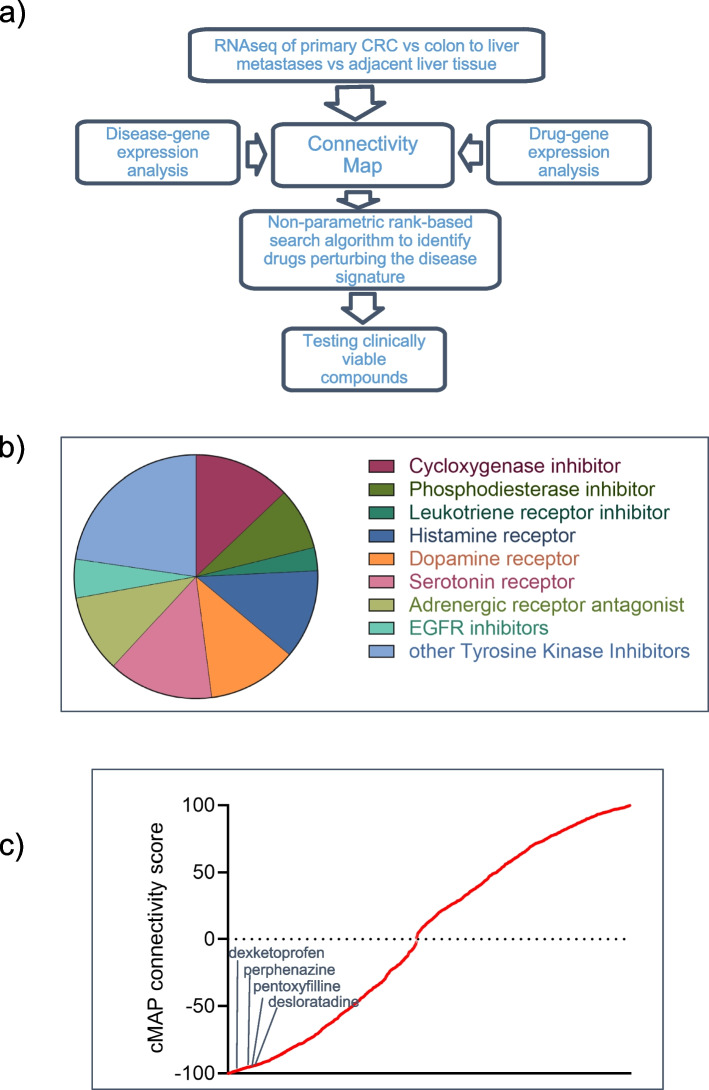
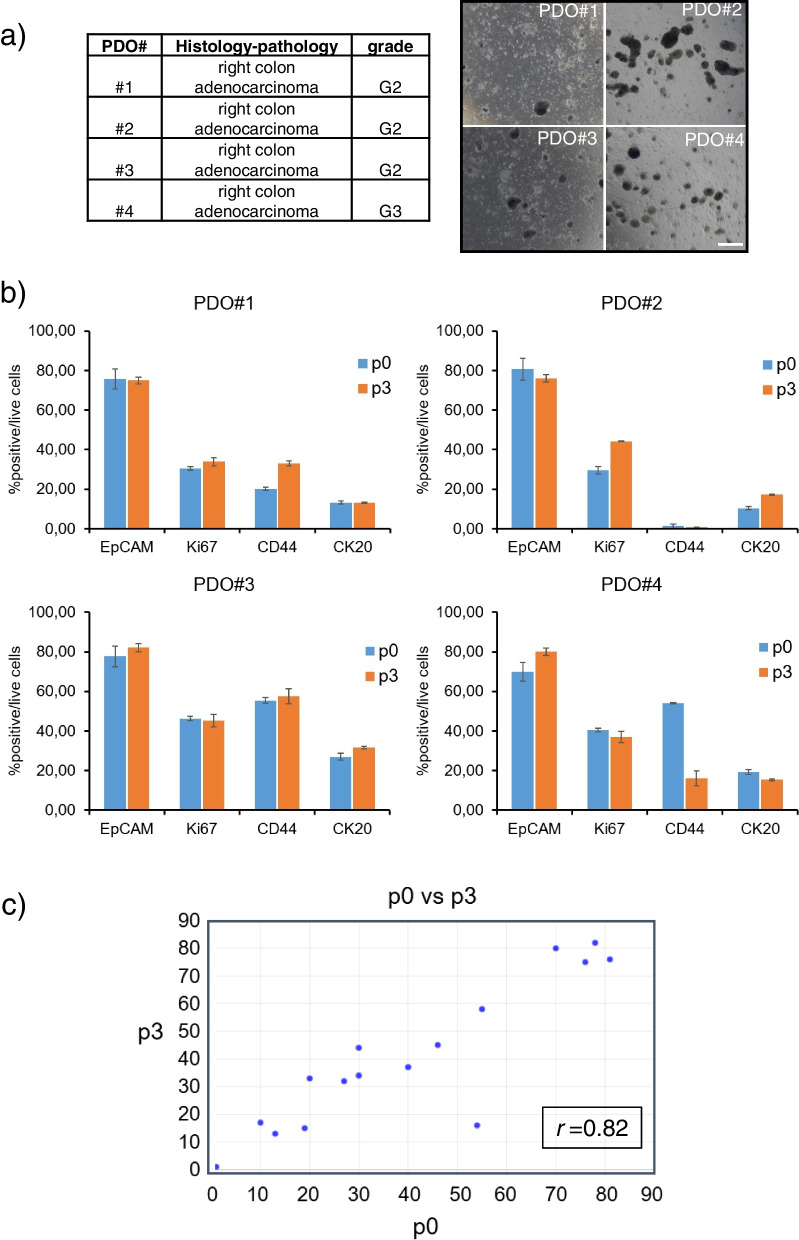
Methods: RNA sequencing of primary colorectal cancer specimens vs adjacent liver tissue vs synchronous and asynchronous liver metastases. Pathways enrichment analyses. The Library of Integrated Network-based Cellular Signatures (LINCS)-based and Connectivity Map (CMAP)-mediated identification of FDA-approved compounds capable to interfere with a 22 gene signature from primary CRC and liver metastases. Testing the identified compounds on CRC-Patient Derived Organoid (PDO) cultures. Microscopy and Fluorescence Activated Cell Sorting (FACS) based analysis of the treated PDOs.

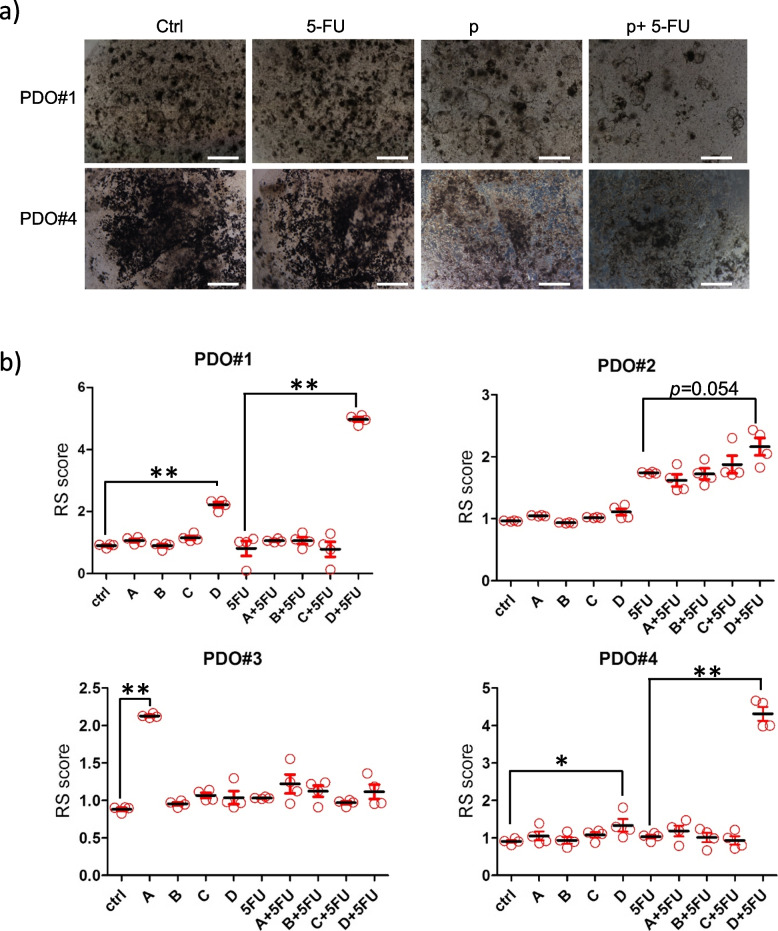
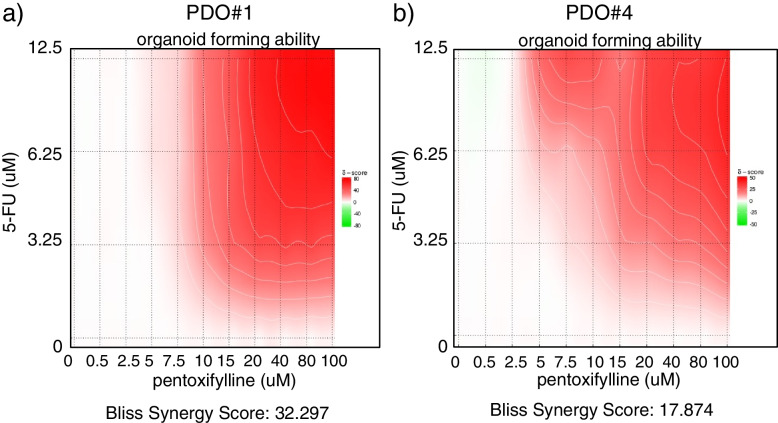
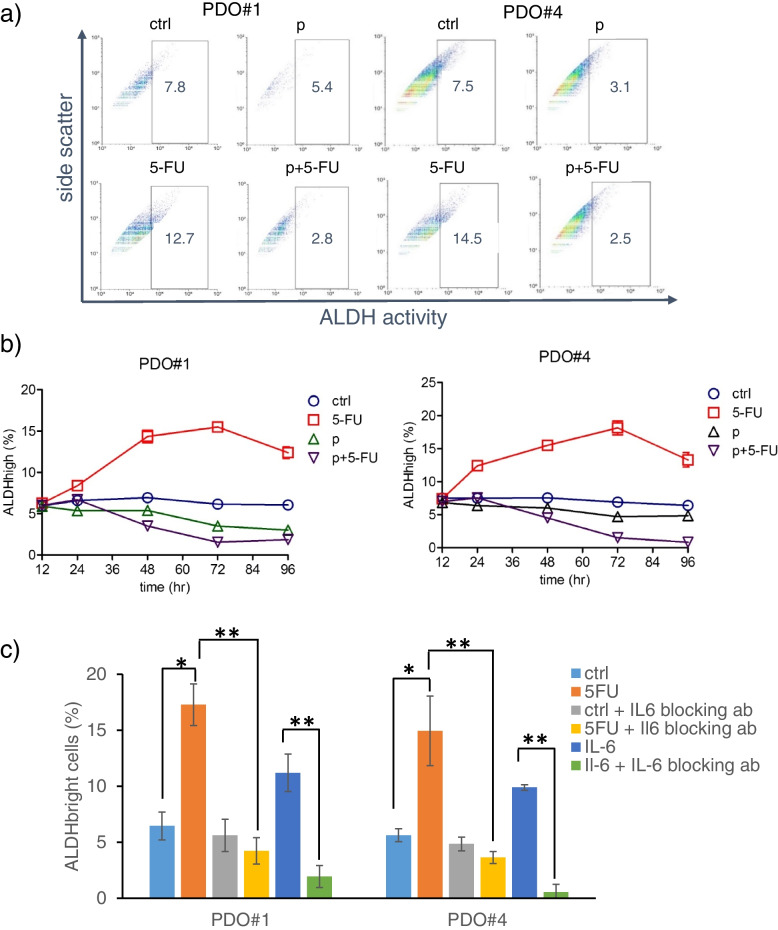
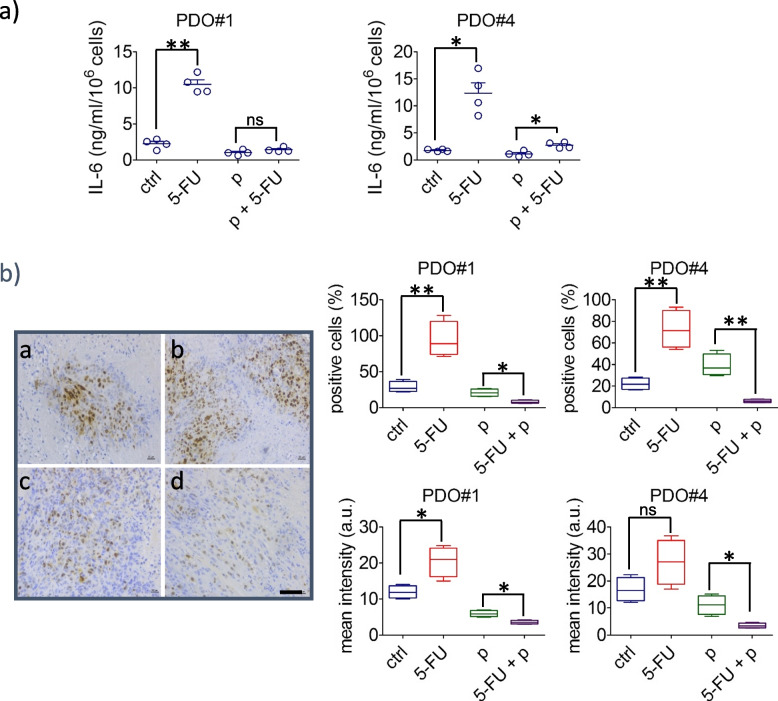
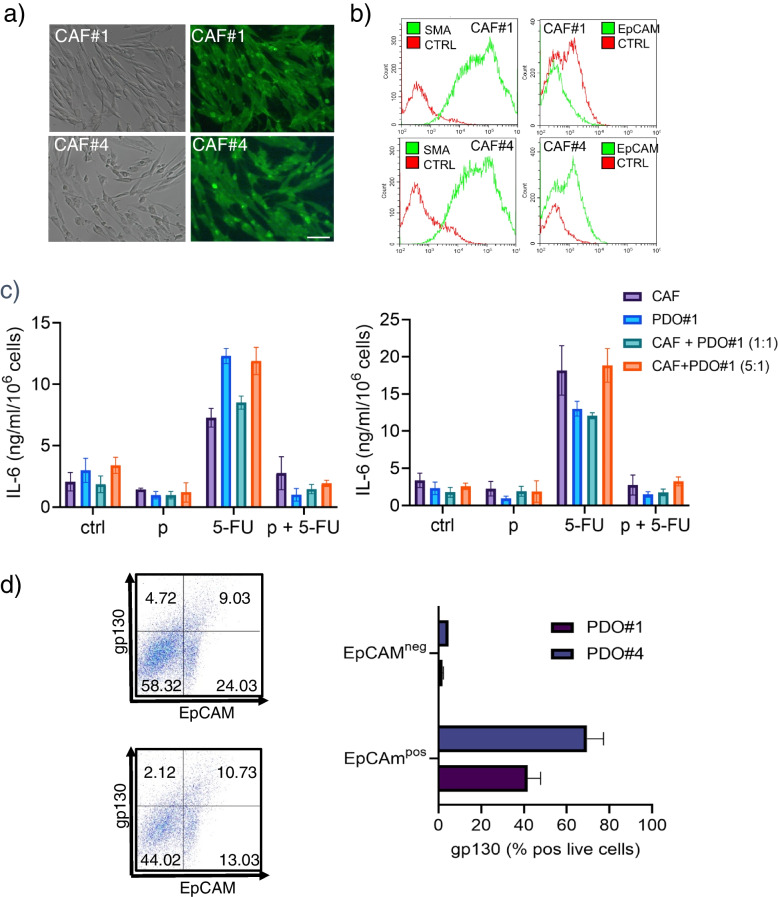
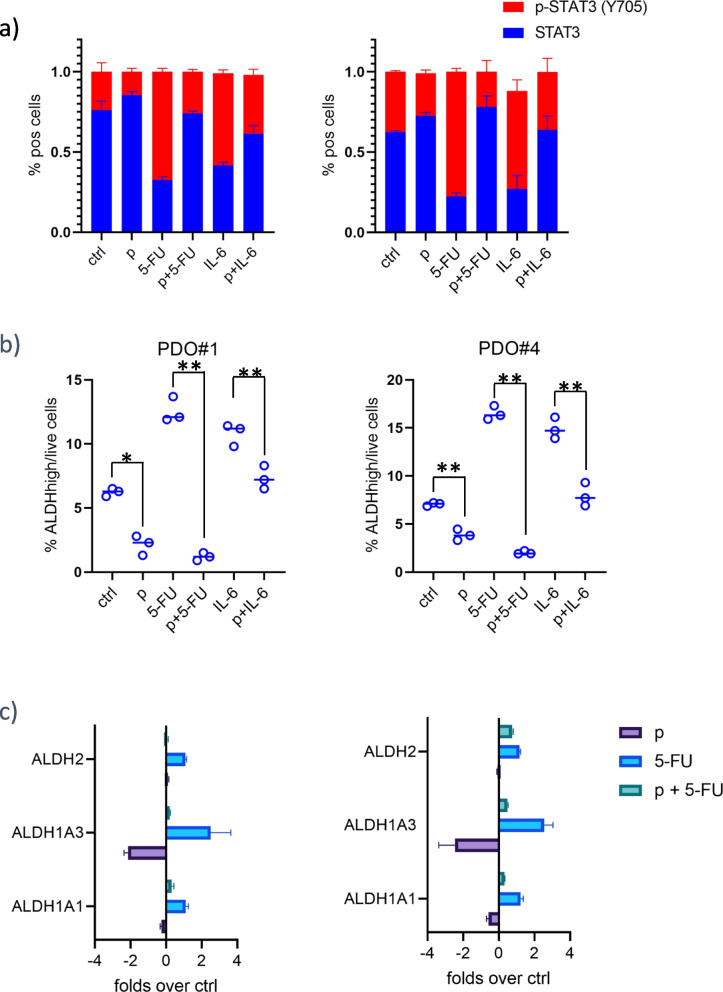
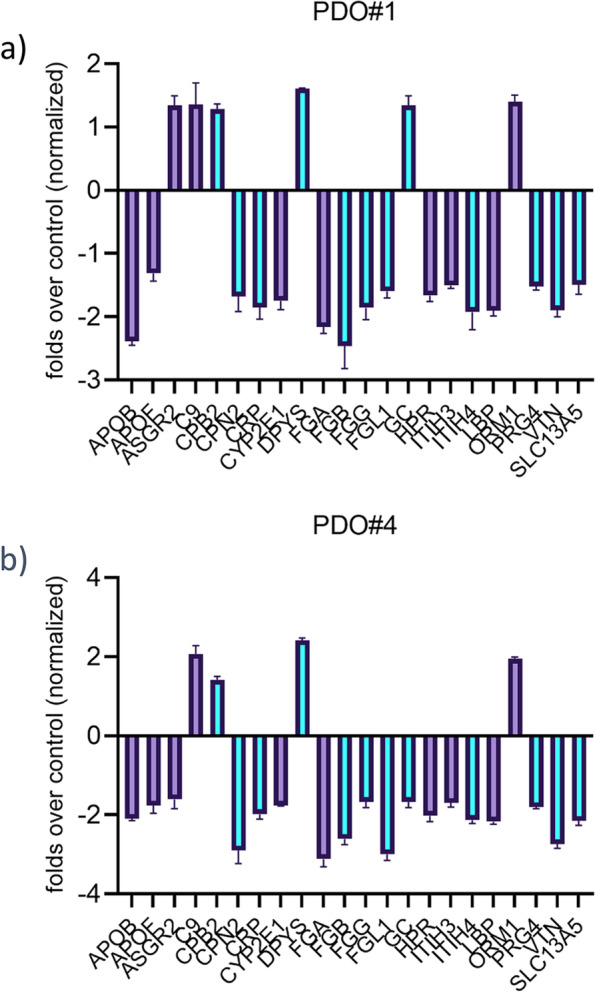
Results: We have found that liver metastases acquire features of the adjacent liver tissue while partially losing those of the primary tumors they derived from. We have identified a 22-gene signature differentially expressed among primary tumors and metastases and validated in public databases. A pharmacogenomic screening for FDA-approved compounds capable of interfering with this signature has been performed. We have validated some of the identified representative compounds in CRC-Patient Derived Organoid cultures (PDOs) and found that pentoxyfilline and, to a minor extent, dexketoprofen and desloratadine, can variably interfere with number, size and viability of the CRC -PDOs in a patient-specific way. We explored the pentoxifylline mechanism of action and found that pentoxifylline treatment attenuated the 5-FU elicited increase of ALDHhigh cells by attenuating the IL-6 mediated STAT3 (tyr705) phosphorylation.

Conclusions: Pentoxifylline synergizes with 5-Fluorouracil (5-FU) in attenuating organoid formation. It does so by interfering with an IL-6-STAT3 axis leading to the emergence of chemoresistant ALDHhigh cell subpopulations in 5-FU treated PDOs. A larger cohort of CRC-PDOs will be required to validate and expand on the findings of this proof-of-concept study.

Keywords: 5-FU; CMAP; CRC; Chemoresistance; Desloratadine; Dexketoprofen; IL-6; Liver metastases; Organoids; Pentoxifylline; STAT3.


Conflict of interest statement

The authors declare that they have no competing interests.

Figures

Fig. 1
Fig. 1
The colon to liver metastases are more similar to the adjacent liver tissue than the primary tumors. a Principal component analysis of all the samples in the study. (CC = Colon Cancer, red; LM1/LM2/LM3 = Colon-to-liver metastasis first/second/third wave, blue; AL = adjacent liver, green). b. Principal component analysis of two publicly available datasets of RNAseq of primary colon cancer (CC, red), liver metastases (LM, blue), adjacent liver (AL, green) and normal colon (NC, brown) samples. c Total number of differentially expressed genes between the various conditions (notation as in a). A large number of genes is deregulated between CC and AL, while it decreases in metastatic samples when considering each wave separately or merging metastatic samples together (LM1 + LM2 + LM3). d-e Number of up- and down-regulated genes in metastatic samples compared to primary tumors. We reported separately the number of DE genes for matched CC and LM1 samples (see Table S1) and over all the samples (left) as well as those in common between the two. The tables in the bottom report, for each subset, the number of genes annotated as liver-enriched, intestine enriched or both intestine and liver enriched according to Protein Atlas (see also Tab. S2-S3)
Fig. 2
Fig. 2
Identification of clinically viable compounds. a Schematic workflow of the in silico search for clinically viable drugs based on the identified DE genes. Briefly, the colon to metastasis disease gene signature (Table 1) was used to query the CMAP database, a collection of paired gene expression profiles from ctrl- and drug-treated cell lines. A positive correlation denotes the degree of similarity and a negative correlation emphasizes an inverse similarity between the query signature and the reference profile generated by the chemical perturbation. b Pie chart showing the distribution of the most represented class of compounds identified among those more negatively correlated with our bait signature (connectivity score between -100 and -50). c Representative histogram showing all the identified compounds ranked by the CMAP connectivity score. On y-axis is reported the connectivity score with negative values indicating negative-correlation and positive value indicating positive correlation. Lines indicate the approximate position of the four compounds selected for further testing
Fig. 3
Fig. 3
Characteristics of the CRC-derived PDOs. Patient-Derived-Organoids were obtained from four right colon adenocarcinoma specimens as described in methods. a Right panel: Clinico-pathological features of the obtained specimens. Left panel: representative micrographs of the four PDO cultures obtained from the specimens indicated in 3a, left. Size bar: 200 µm. b Validation of the PDO cultures. Upper panel: histograms showing the percentage of cells positive for EpCAM, Ki67, CD44 and CK20 in the CRC tissue immediately after the mechanical disaggregation (passage 0, p0). Lower panel: histograms showing the percentage of cells positive for the expression of the above antigens in PDO cultures disaggregated after three sequential passages (passage 3, p3). c High correlation between the number of positive cells within the p0) and the p3) specimens was shown (r = 0.8213, p < 0.01) suggesting a similar composition in cell subpopulations between the p0 and the p3 PDOs
Fig. 4
Fig. 4
Validation of the in silico screening with CRC PDOs. a Representative micrographs of two PDO cultures treated with 0.05% DMSO (ctrl)- or pentoxifylline(p) and subsequently with saline-(ctrl) or 5-FU. Micrographs taken at 72 h after treatment started. Scale bar: 200 µm. b Graphs showing the RS score for the PDOs treated with ctrl (DMSO 0.05%) or with the compound A (dexketoprofen), B (perphenazine), C (desloratadine) or D (pentoxifylline) and challenged 6.5 h later with ctrl (saline) or 5FU. The RS score was obtained according to the following formula: number of formed organoids x average max diameter at time 0 day / number of organoids x average max diameter after 72 h, as described in the methods section. Statistics: * p < 0.05; ** p < 0.01; no asterisk: not significant
Fig. 5
Fig. 5
Pentoxifylline exhibited synergistic activity with 5-FU toward the Organoid Forming Ability. Representative graphs of the effect of the combined pentoxifylline and 5-FU treatment on the organoid forming ability of PDO#1 (a) and PDO#4 (b). The Bliss synergy score calculated was > 32 and > 17 for PDO#1 and PDO#4, respectively, indicating synergistic effect of the two administered compounds. Details are available in the methods section
Fig. 6
Fig. 6
Pentoxifylline blunted the 5-FU-mediated increase of ALDHhigh cells in PDOs (a) 48 h after the indicated treatments, freshly disaggregated and filtered PDO-derived cells were analyzed for their ALDH activity by means of the ALDEFLUOR assay as described in the methods. Representative dot plots. b Graphs showing the percentage of ALDHhigh cells from quadruplicate experiments during a (12-96 h) time course. c A 5-FU- stimulated increase of IL-6 mediated the emergence of ALDHhigh cells. Representative histograms showing the levels of ALDHhigh cells in the PDO#1 and PDO#4 pretreated with a mock- or a IL-6-neutralizing antibody (100 ng/ml, 1 h) before being challenged with ctrl- or 5-FU as in (a). ELISA assay. Statistics: * p < 0.05; ** p < 0.01; ns: not significant
Fig. 7
Fig. 7
Treatment with pentoxifylline attenuated the release of IL-6 after 5-FU treatment. a Upper panel. Graph showing the levels of IL-6 quantified in the conditioned medium of the ctrl and 5-FU-treated PDOs. Results are expressed in nanograms per milliliter of IL-6, adjusted for 10^6 PDO-derived cells, after 48 h of medium conditioning and representative of three independent experiments. b Left panel: Representative immunocytochemistry of PDO#4-derived cells treated with ctrl (a), pentoxifylline (b), 5-FU (c) or pentoxifylline + 5-FU (d), cytospun and stained, after fixation, with an IL-6-antibody. Size bar, 100 µm. Right panel: Box plots showing the percentage of IL-6 positive cells (upper panels) and the mean intensity of the IL-6 signal (lower panel) in the PDO#1 and PDO#4 treated and stained as indicated in the left panel
Fig. 8
Fig. 8
Cancer Associated Fibroblast are the main source of IL-6 after 5-FU treatment and may signal to gp130pos;EpCAM.pos cells. CAFs were isolated as described in methods from the same specimens used for PDO generation and cocultured at different ratios with matched, early passage PDO#1 and PDO#4, to assess the levels of IL-6 released after ctrl, pentoxifylline, 5-FU or combined (pentoxifylline + 5-FU) treatment. a Representative micrographs of the CAF cultures derived from the same specimens of the PDO#1 (CAF#1) and PDO#4 (CAF#4). Left: bright field micrographs. Right: immunofluorescence staining with anti-SMA antibody. Size bar: 30 µm. b Overlay histogram plot of the CAF#1 and CAF#4 cultures stained with anti-SMA (Left) and with Anti-EpCAM (Right) antibodies and analyzed by flow cytometry. The background fluorescence from isotype-matched antibodies is also reported (c) Histograms showing the levels of IL-6 detected by an ELISA assay in the indicated samples. Results are expressed in nanograms per milliliter of IL-6, adjusted for 10^6 PDO-derived cells, after 48 h of medium conditioning and representative of three independent experiments. d Representative dot plots of the cocultures (1:1) stained with an anti-EpCAM antibody and with anti-gp130 antibody. Right panels. Quantitation of the results from the left panel for two independent experiments. Statistics: * p < 0.05; ** p < 0.01
Fig. 9
Fig. 9
Pentoxifylline attenuated the IL-6 mediated increase of phosphorylated STAT3 in 5-FU-treated PDOs. a Graphs showing the levels of total and phosphorylated pSTAT3 (tyr705) detected by ELISA as indicated in the methods, from PDO#1 and PDO#4 treated with ctrl or 5-FU. Average of four independent experiments. b,c STAT3 inhibition by pentoxifylline affected the ALDHhigh cell number and the expression of ALDH1A3. Lower panels. Histograms reporting the percentage of ALDHhigh cells as assessed by flow cytometry in the same samples treated as in figure b, upper panels. Statistics: * p < 0.05; ** p < 0.01; no asterisk: not significant. c QRT-PCR was performed to assess the mRNA levels of he indicated ALDH isoforms in PDO#1 and PDO#4 cultures treated as shown for 24 h. Histograms show the folds above ctrl. The average of two independent experiments is reported. Statistics: * p < 0.05; ** p < 0.01
Fig. 10
Fig. 10
Pentoxifylline treatment partially reverted the 22-gene signature and downregulated most of the STAT3 putative target genes within the signature. Gene expression levels were assessed for the 22 genes comprising the identified colon to liver metastasis signature (Table 1) in pentoxifylline-treated PDO#1 and PDO#4 cultures (8 h, 20uM). Average of two independent experiments. Marked in purple are the genes deemed as or demonstrated to be STAT3 targets from literature data and promoter analysis

Similar articles

Cited by

References

    1. Sung H, Ferlay J, Siegel RL, Laversanne M, Soerjomataram I, Jemal A, et al. Global Cancer Statistics 2020: GLOBOCAN Estimates of Incidence and Mortality Worldwide for 36 Cancers in 185 Countries. CA Cancer J Clin. 2021;71(3):209–249. doi: 10.3322/caac.21660. - DOI - PubMed
    1. Argiles G, Tabernero J, Labianca R, Hochhauser D, Salazar R, Iveson T, et al. Localised colon cancer: ESMO Clinical Practice Guidelines for diagnosis, treatment and follow-up. Ann Oncol. 2020;31(10):1291–1305. doi: 10.1016/j.annonc.2020.06.022. - DOI - PubMed
    1. Cervantes A, Adam R, Rosello S, Arnold D, Normanno N, Taieb J, et al. Metastatic colorectal cancer: ESMO Clinical Practice Guideline for diagnosis, treatment and follow-up. Ann Oncol. 2023;34(1):10–32. doi: 10.1016/j.annonc.2022.10.003. - DOI - PubMed
    1. Sato T, Stange DE, Ferrante M, Vries RG, Van Es JH, Van den Brink S, et al. Long-term expansion of epithelial organoids from human colon, adenoma, adenocarcinoma, and Barrett's epithelium. Gastroenterology. 2011;141(5):1762–1772. doi: 10.1053/j.gastro.2011.07.050. - DOI - PubMed
    1. Wang R, Mao Y, Wang W, Zhou X, Wang W, Gao S, et al. Systematic evaluation of colorectal cancer organoid system by single-cell RNA-Seq analysis. Genome Biol. 2022;23(1):106. doi: 10.1186/s13059-022-02673-3. - DOI - PMC - PubMed