

Association between natural hazards and postnatal care among the neonates in India: a step towards full coverage using geospatial approach
- PMID: 37460972
- PMCID: PMC10351138
- DOI: 10.1186/s12873-023-00844-4
Association between natural hazards and postnatal care among the neonates in India: a step towards full coverage using geospatial approach
Abstract
Background: Postnatal care is crucial to prevent the child mortality. Despite the improvement in the PNC coverage for the neonates, it is still far away from the universal health coverage. Along with, some specific regions mostly are natural hazard prone areas of India show very under coverage of PNC for the neonates. Considering the substantial spatial variation of PNC coverage and natural hazard prevalence, present study aimed to examine spatial variation of PNC coverage and its association with natural hazard at the district level.
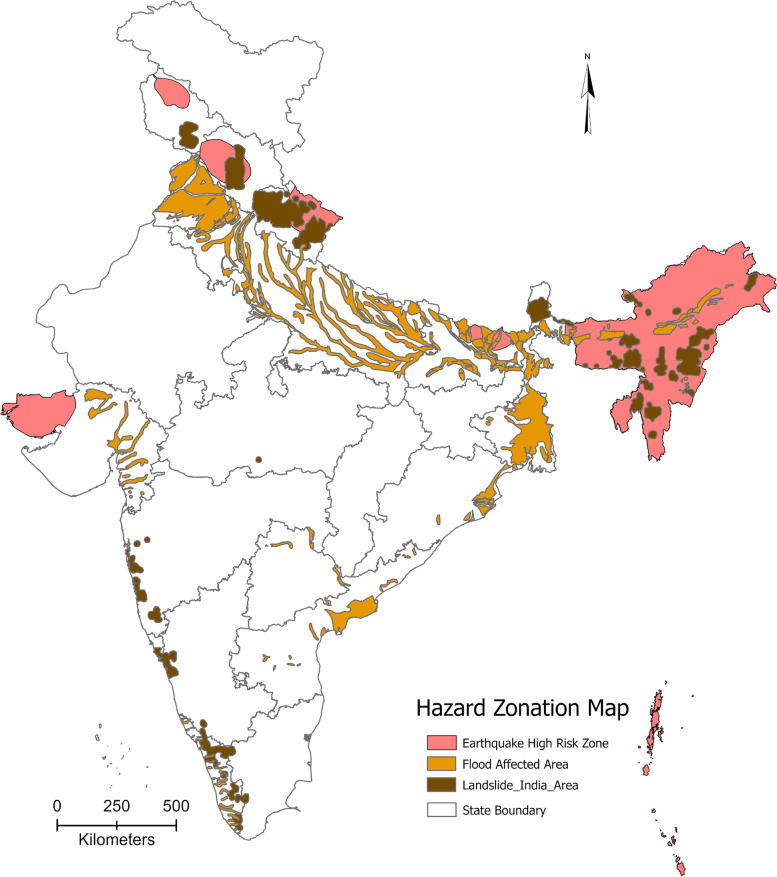
Methods: The cross-sectional exploratory study utilized National Family Health Survey, 2019-21, which included 1,76,843 children using multistage stratified sampling method to examine postnatal care within 42 days for neonates born within five years prior to the survey. Additionally, the study utilized Vulnerability Atlas of India,2019 maps to categorize regions into hazardous (flood, earthquake, and landslide) and non-hazardous areas. Spatial univariate and bivariate analyses, logistic and geographically weighted regressions were conducted using ArcGIS Pro, GeoDa, and Stata 16.0 software to identify associations between PNC coverage, hazard exposure, and spatial variation.
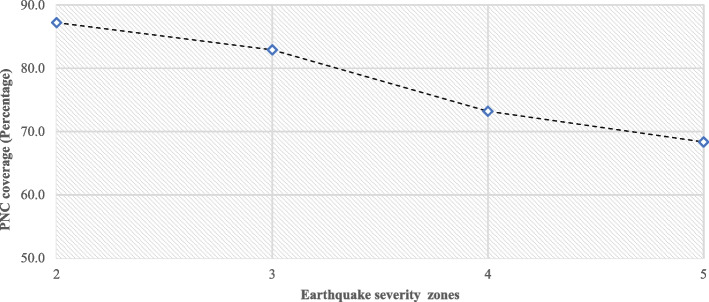
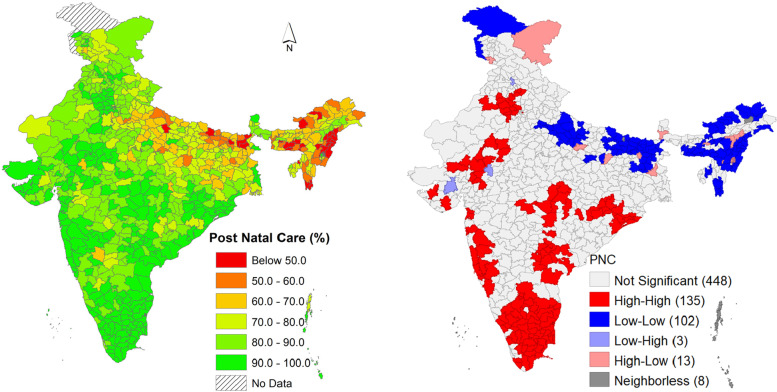
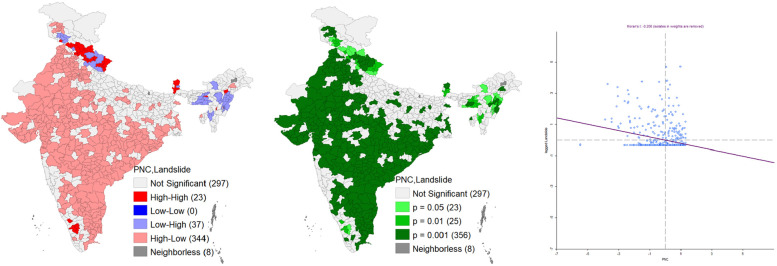
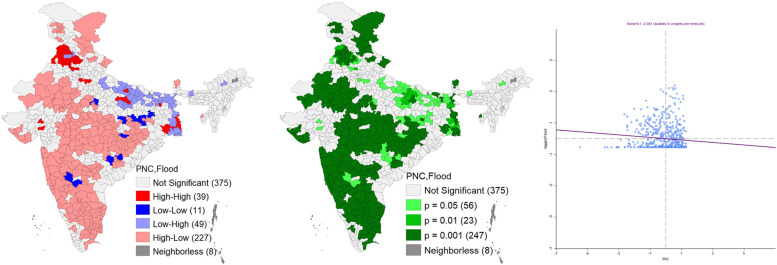
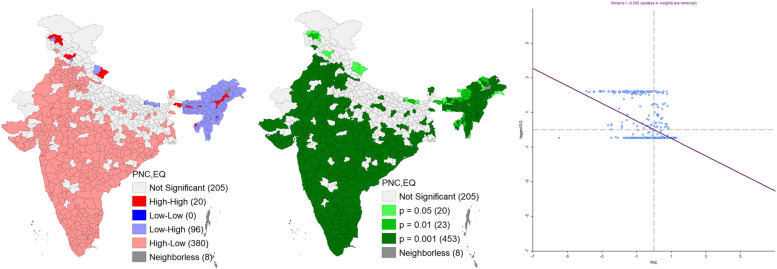
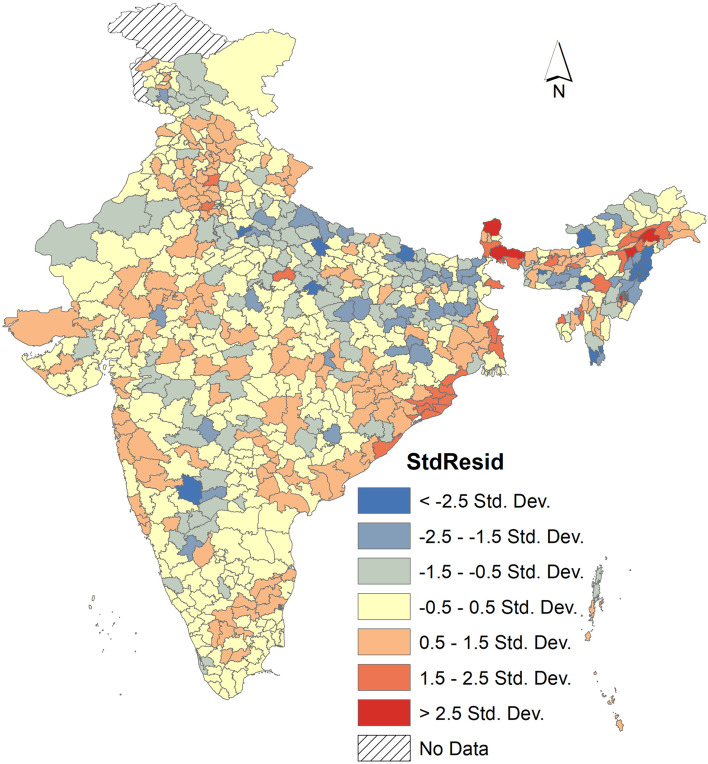
Results: The univariate spatial analysis showed some specific regions such as north, east, and north-east region of India had a high concentration of natural hazard and low access of PNC coverage. Bivariate analysis also showed that PNC coverage was low in flood (75.9%), earthquake (68.3%), and landslide (80.6%) effected areas. Compared to the national PNC coverage (81.1%), all these natural hazards effected areas showed low coverage. Further, logic regression showed that these hazard prone areas were less (OR:0.85 for flood, 0.77 for earthquake, and 0.77 for landslide) likely to get PNC coverage than their counterparts. LISA cluster maps significantly showed low PNC and high disaster concentration in these disaster-prone areas. Geographic weighted regression results also showed similar result.
Conclusions: The present study elucidates notable heterogeneity in the coverage of postnatal care (PNC) services, with lower concentrations observed in disaster-prone areas. In order to enhance the accessibility and quality of PNC services in these areas, targeted interventions such as the deployment of mobile health services and fortification of health systems are recommended.
Keywords: Healthcare accessibility; National Family Health Survey; Natural hazard; Postnatal care; Spatial analysis.
© 2023. The Author(s).
Conflict of interest statement
The authors declare no competing interests.
Figures
Similar articles
-
Investigating the association between floods and low birth weight in India: Using the geospatial approach.Sci Total Environ. 2024 Feb 20;912:169593. doi: 10.1016/j.scitotenv.2023.169593. Epub 2023 Dec 25. Sci Total Environ. 2024. PMID: 38151131
-
Multilevel analysis of determinants in postnatal care utilisation among mother-newborn pairs in India, 2019-21.J Glob Health. 2024 May 10;14:04085. doi: 10.7189/jogh.14.04085. J Glob Health. 2024. PMID: 38721673 Free PMC article.
-
High coverage but low quality of maternal and newborn health services in the coverage cascade: who is benefitted and left behind in accessing better quality health services in Nepal?Reprod Health. 2022 Jul 19;19(1):163. doi: 10.1186/s12978-022-01465-z. Reprod Health. 2022. PMID: 35854265 Free PMC article.
-
On the road to universal coverage of postnatal care: considerations for a targeted postnatal care approach for at-risk mother-baby dyads in low-income and middle-income countries informed by a consultation with global experts.BMJ Open. 2022 Jun 14;12(6):e058408. doi: 10.1136/bmjopen-2021-058408. BMJ Open. 2022. PMID: 35701048 Free PMC article. Review.
-
mHealth communication to strengthen postnatal care in rural areas: a systematic review.BMC Pregnancy Childbirth. 2019 Nov 6;19(1):406. doi: 10.1186/s12884-019-2531-0. BMC Pregnancy Childbirth. 2019. PMID: 31694578 Free PMC article.
Cited by
-
Climate change and sexual and reproductive health and rights research in low-income and middle-income countries: a scoping review.BMJ Public Health. 2024 Aug 24;2(2):e001090. doi: 10.1136/bmjph-2024-001090. eCollection 2024 Dec. BMJ Public Health. 2024. PMID: 40018556 Free PMC article.
-
Moderating role of functional/ mobility limitations in the association between sleep problems and hypertension among middle-aged and older adults in India.Prev Med Rep. 2024 Jan 4;38:102589. doi: 10.1016/j.pmedr.2024.102589. eCollection 2024 Feb. Prev Med Rep. 2024. PMID: 38283958 Free PMC article.
-
Spatial Distribution and Its Influencing Factors of Secondhand Smoke Exposure Among Adults - 31 PLADs, China, 2022.China CDC Wkly. 2025 May 30;7(22):771-776. doi: 10.46234/ccdcw2025.127. China CDC Wkly. 2025. PMID: 40621204 Free PMC article.
-
Drinking water supply for communities affected by natural disaster emergencies: a qualitative study.BMC Emerg Med. 2025 Apr 23;25(1):70. doi: 10.1186/s12873-025-01225-9. BMC Emerg Med. 2025. PMID: 40269736 Free PMC article.
-
Decomposing the rural-urban differences in depression among multimorbid older patients in India: evidence from a cross-sectional study.BMC Psychiatry. 2024 Jan 22;24(1):60. doi: 10.1186/s12888-023-05480-7. BMC Psychiatry. 2024. PMID: 38254089 Free PMC article.
References
-
- IPCC. Climate Change 2007: Impacts, Adaptation and Vulnerability. Cambridge University Press. Cambridge, UK; 2007. Available from: https://www.ipcc.ch/site/assets/uploads/2018/03/ar4_wg2_full_report.pdf.
-
- Keim ME. Building human resilience: the role of public health preparedness and response as an adaptation to climate change. Am J Prev Med. 2008;35(5):508–16. - PubMed
-
- Gupta A. Vulnerability and disaster management in India. Prehosp Disaster Med. 2000;15(S2):98.
-
- Mondal M, Biswas A, Haldar S, Mandal S, Mandal P, Bhattacharya S, Paul S. Climate change, multi-hazards and society: an empirical study on the coastal community of indian Sundarban. Nat Hazards Res. 2022;2(2):84–96.
MeSH terms
LinkOut - more resources
Full Text Sources
Medical
