. 2023 Jul 17;28(1):56.
doi: 10.1186/s11658-023-00473-6.

Talin2 and KANK2 functionally interact to regulate microtubule dynamics, paclitaxel sensitivity and cell migration in the MDA-MB-435S melanoma cell line

Affiliations

Talin2 and KANK2 functionally interact to regulate microtubule dynamics, paclitaxel sensitivity and cell migration in the MDA-MB-435S melanoma cell line

Marija Lončarić et al. Cell Mol Biol Lett. .

Abstract

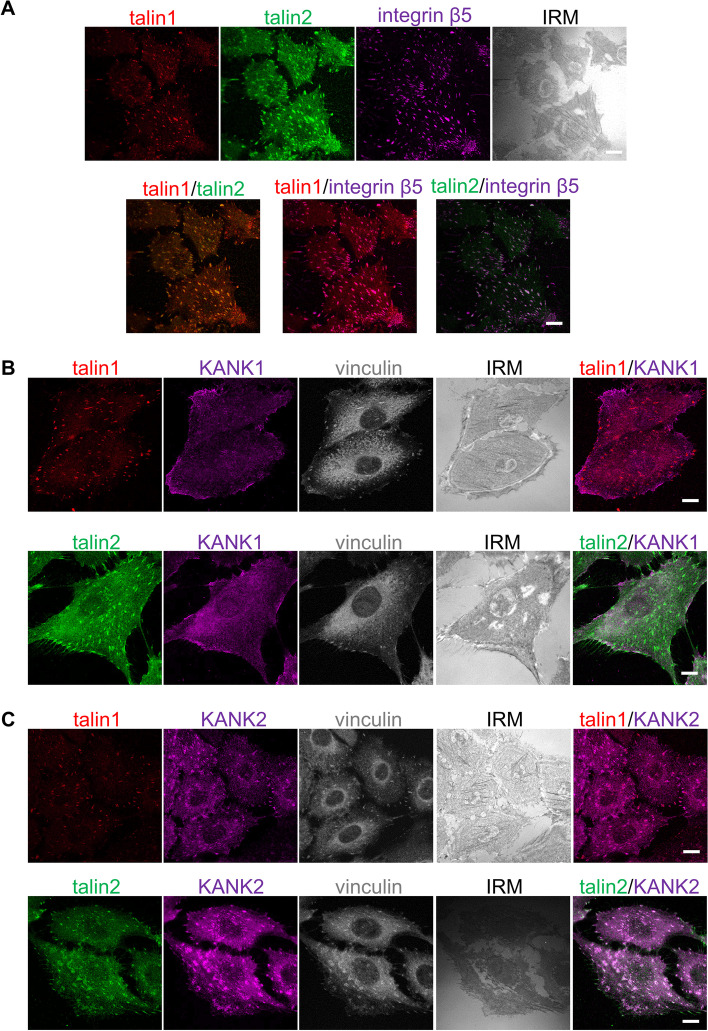
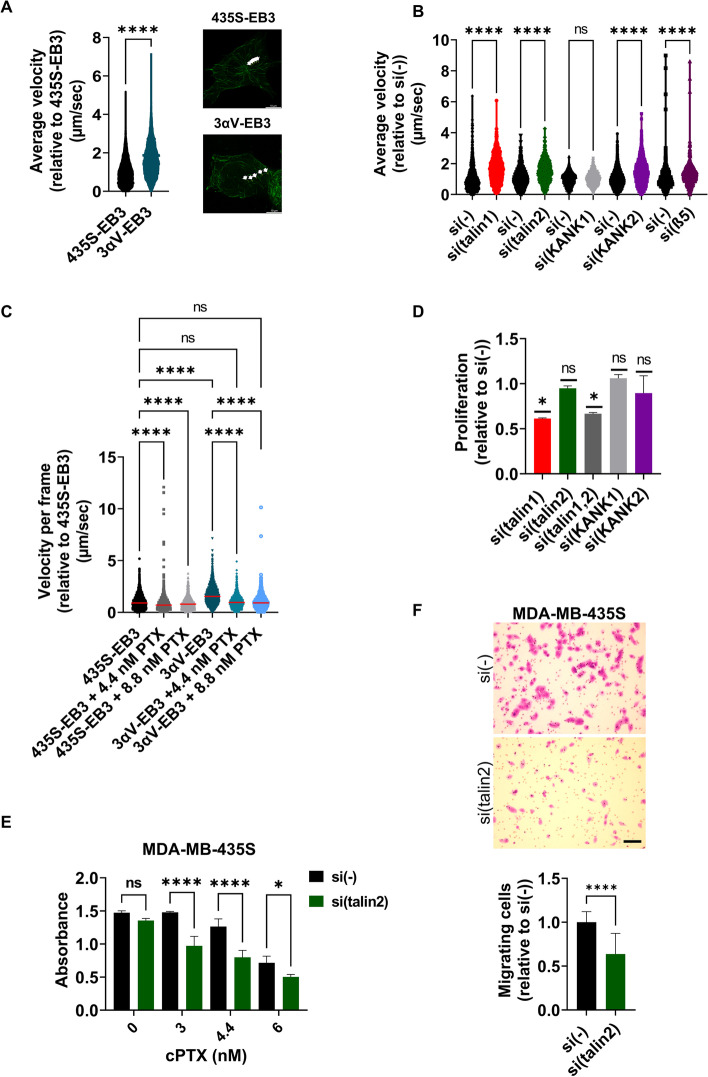
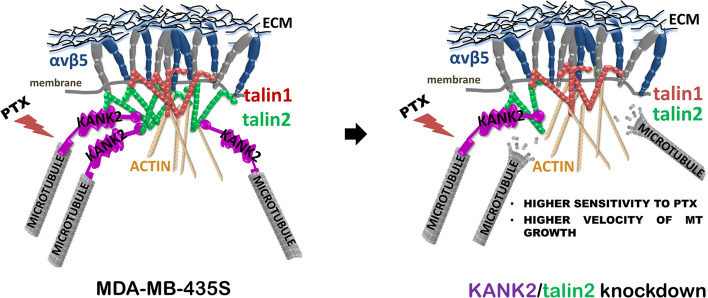
Background: Focal adhesions (FAs) are integrin-containing, multi-protein structures that link intracellular actin to the extracellular matrix and trigger multiple signaling pathways that control cell proliferation, differentiation, survival and motility. Microtubules (MTs) are stabilized in the vicinity of FAs through interaction with the components of the cortical microtubule stabilizing complex (CMSC). KANK (KN motif and ankyrin repeat domains) family proteins within the CMSC, KANK1 or KANK2, bind talin within FAs and thus mediate actin-MT crosstalk. We previously identified in MDA-MB-435S cells, which preferentially use integrin αVβ5 for adhesion, KANK2 as a key molecule enabling the actin-MT crosstalk. KANK2 knockdown also resulted in increased sensitivity to MT poisons, paclitaxel (PTX) and vincristine and reduced migration. Here, we aimed to analyze whether KANK1 has a similar role and to distinguish which talin isoform binds KANK2.

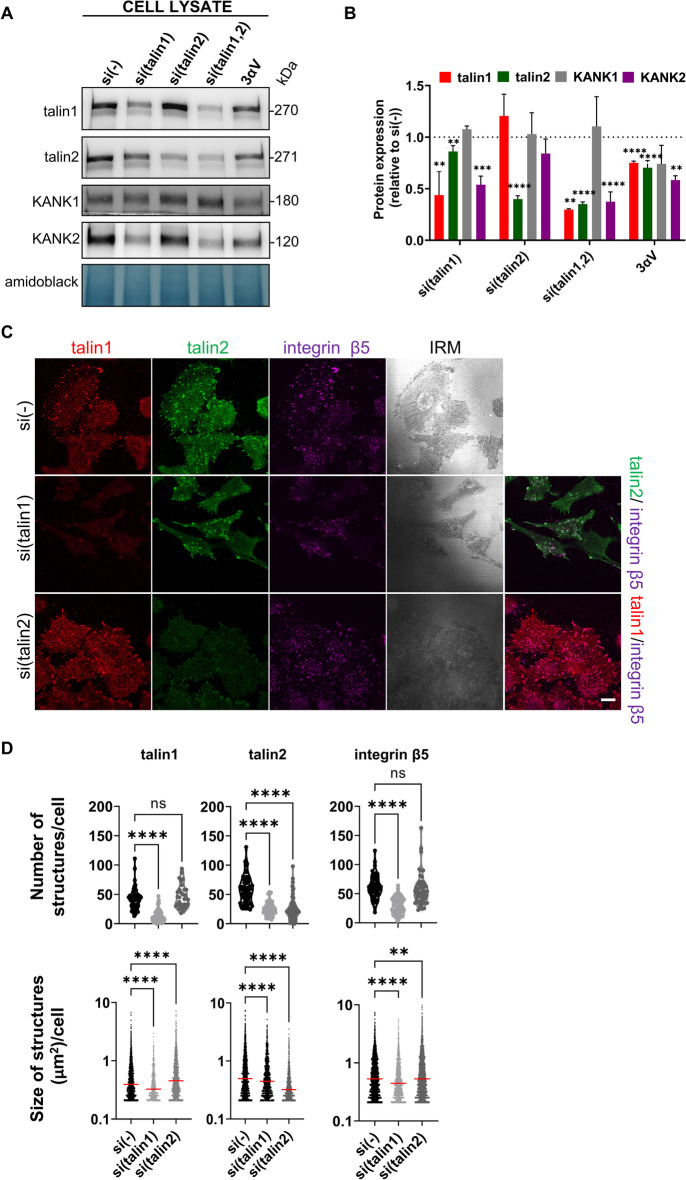
Methods: The cell model consisted of human melanoma cell line MDA-MB-435S and stably transfected clone with decreased expression of integrin αV (3αV). For transient knockdown of talin1, talin2, KANK1 or KANK2 we used gene-specific siRNAs transfection. Using previously standardized protocol we isolated integrin adhesion complexes. SDS-PAGE and Western blot was used for protein expression analysis. The immunofluorescence analysis and live cell imaging was done using confocal microscopy. Cell migration was analyzed with Transwell Cell Culture Inserts. Statistical analysis using GraphPad Software consisted of either one-way analysis of variance (ANOVA), unpaired Student's t-test or two-way ANOVA analysis.

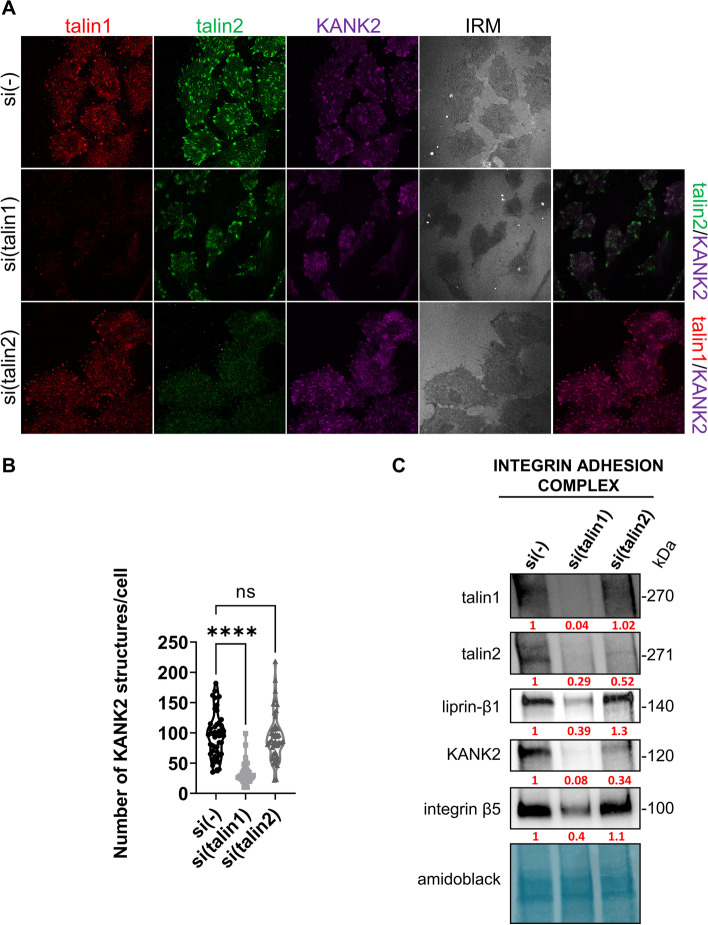
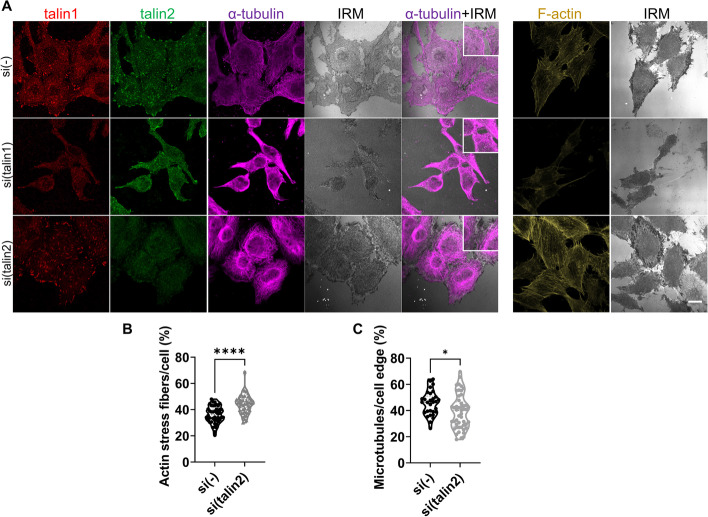
Results: We show that KANK1 is not a part of the CMSC associated with integrin αVβ5 FAs and its knockdown did not affect the velocity of MT growth or cell sensitivity to PTX. The talin2 knockdown mimicked KANK2 knockdown i.e. led to the perturbation of actin-MT crosstalk, which is indicated by the increased velocity of MT growth and increased sensitivity to PTX and also reduced migration.

Conclusion: We conclude that KANK2 functionally interacts with talin2 and that the mechanism of increased sensitivity to PTX involves changes in microtubule dynamics. These data elucidate a cell-type-specific role of talin2 and KANK2 isoforms and we propose that talin2 and KANK2 are therefore potential therapeutic targets for improved cancer therapy.

Keywords: Cortical microtubule stabilizing complex; Focal adhesion; KANK1; KANK2; Talin1; Talin2.


Conflict of interest statement

The authors have no relevant financial or non-financial interests to disclose.

Figures

Fig. 1
Fig. 1
KANK2, unlike KANK1, is localized within αVβ5 FAs. A Talin1 and talin2 are localized within integrin αVβ5 FAs. Forty-eight hours after seeding MDA-MB-435S cells were methanol fixed, and stained with anti-talin1 antibody followed by Alexa-Fluor IgG1 555-conjugated antibody (red), anti-talin2 antibody followed by Alexa-Fluor IgG2b 488-conjugated antibody (green) and anti-integrin β5 antibody followed by Alexa-Fluor 647-conjugated antibody (magenta) and interference reflection microscopy (IRM) images were taken. B, C KANK2, unlike KANK1, localizes in talin1 and talin2-positive FAs. Forty-eight hours after seeding MDA-MB-435S cells were methanol fixed and stained with anti-talin1 or anti-talin2 antibody followed by Alexa-Fluor 546-conjugated antibody (red) or Alexa-Fluor 488-conjugated antibody (green) and anti-KANK1 or anti-KANK2 antibody followed by Alexa-Fluor 555-conjugated antibody or Alexa-Fluor 488-conjugated antibody (shown in magenta). Vinculin was visualized using conjugated anti-vinculin Alexa Fluor 647 antibody (shown in grey) and IRM images were taken. Analysis was performed using TCS SP8 Leica. Scale bar = 10 µm
Fig. 2
Fig. 2
Talin1, unlike talin2, is necessary for formation of integrin αVβ5 FAs. A Talin1 knockdown, unlike talin2, reduces the level of KANK2 in whole cell lysates, while KANK1 level does not change upon either talin1 or talin2 knockdown. WB analysis of talin1, talin2, KANK1 or KANK2 in MDA-MB-435S cells transfected with either control, talin1, talin2 or a combination of talin1 and talin2-specific siRNAs and in the 3αV clone with decreased expression of integrin αV. Forty-eight hours after transfection total cell lysates were collected and WB analysis was performed. The results presented are representative of three independent experiments with similar results. B Quantification of data presented in (A). Histogram data are plotted as mean ± SD (n ≥ 3) relative to expression in MDA-MB-435S cells transfected with control siRNA that was set as 1 (indicated by a dotted line). Data were analyzed by one-way ANOVA with Dunnett’s multiple comparison. ns, not significant; * P < 0.05; ** P < 0.01; *** P < 0.001; **** P < 0.0001. C Knockdown of talin1 leads to disruption of αVβ5 FAs. Forty-eight hours after transfection with either control siRNA, talin1 or talin2-specific siRNA, MDA-MB-435S cells were methanol fixed, and stained with anti-talin1 antibody followed by Alexa-Fluor IgG1 555-conjugated antibody (red), anti-talin2 antibody followed by Alexa-Fluor IgG2b 488-conjugated antibody (green) and anti-β5 antibody followed by Alexa-Fluor 647-conjugated antibody (magenta) and IRM images were taken. Analysis was performed using TCS SP8 Leica. Scale bar = 10 µm. D Quantification of data presented in (C). Violin plots (number of structures/cell) and scatter plots with median marked in size (size of structures/cell) represents measurements of > 45 cells. Data were analyzed by one-way ANOVA with Dunnett’s multiple comparison. ns, not significant; * P < 0.05; ** P < 0.01; *** P < 0.001; **** P < 0.0001
Fig. 3
Fig. 3
Talin2 functionally interacts with KANK2. A Knockdown of talin1, unlike talin2, leads to changes in KANK2 localization. Forty-eight hours after transfection with either control siRNA, talin1 or talin2-specific siRNA, MDA-MB-435S cells were methanol fixed and stained with anti-talin1 antibody followed by Alexa-Fluor IgG1 555-conjugated antibody (red), anti-talin2 antibody followed by Alexa-Fluor IgG2b 488-conjugated antibody (green), anti-KANK2 antibody followed by Alexa-Fluor 647-conjugated antibody (magenta) and IRM images were taken. Analysis was performed using TCS SP8 Leica. Scale bar = 10 µm. B Quantification of data presented in (A). Violin plot represents measurements of > 30 cells. Data were analyzed by one-way ANOVA with Dunnett’s multiple comparison. ns, not significant; * P < 0.05; ** P < 0.01; *** P < 0.001; **** P < 0.0001. C WB analysis of talin1, talin2, liprin-β1, KANK2 or integrin β5 in IACs isolated from MDA-MB-435S cells transfected with either control siRNA, talin1 or talin2-specific siRNA. Forty-eight hours after transfection, IACs were isolated and WB analysis was performed. The results presented are representative of two independent experiments yielding similar results. Numbers below WB scan represent expression of target proteins after talin1 or talin2 knockdown as relative to expression of target proteins in cell transfected with control siRNA set as 1
Fig. 4
Fig. 4
Talin1 or talin2 knockdown affects actin and MT cytoskeleton. A Visualization of α-tubulin and F-actin upon knockdown of talin1 or talin2. Forty-eight hours after transfection with either control, talin1 or talin2-specific siRNA, MDA-MB-435S cells were fixed with methanol (for α-tubulin visualization) or PFA followed by permeabilization with Triton X-100 (for F-actin visualization), and stained with anti-talin1 antibody followed by Alexa-Fluor IgG1 555-conjugated antibody (red), anti-talin2 antibody followed by Alexa-Fluor IgG2b 488-conjugated antibody (green), anti-α-tubulin antibody followed by Alexa-Flour 647-conjugated antibody (magenta) and IRM images were taken. For F-actin visualization cells were incubated with Alexa-Flour 488 conjugated phalloidin (shown in gold). Analysis was performed using TCS SP8 Leica. Scale bar = 10 µm. B, C Quantification of data presented in (A). Violin plots represents measurements of > 30 cells. Data were analyzed by unpaired Student’s t-test. ns, not significant; *P < 0.05; **P < 0.01; ***P < 0.001; ****P < 0.0001
Fig. 5
Fig. 5
Disruption of crosstalk between CMSCs and FAs leads to increased velocity of microtubule growth and increased sensitivity to PTX. A Knockdown of αV integrin subunit increases velocity of microtubule growth. Quantification of time-lapse live cell microscopy data of 435S-EB3 cells and 3αV-EB3 cell clone with decreased expression of integrin αV. Violin plot represents measurements of > 450 analyzed microtubules, (n = 3) relative to velocity of MT growth in MDA-MB-435S cells that was set as 1. Data were analyzed by unpaired Student’s t-test. ns, not significant; *P < 0.05; **P < 0.01; ***P < 0.001; ****P < 0.0001. Still images of Additional file 2 : Movie S1 and Additional file 3: S2 represent tracking of one microtubule tip in 104 s through five frames. (B) 435S-EB3 cells transfected with either talin1, talin2, KANK2 or β5-specific siRNA, but not KANK1 siRNA, showed a significant increase in velocity of MT growth compared to cells transfected with control siRNA. Quantification of time-lapse live cell microscopy data. Violin plot represents measurement of > 250 analyzed microtubules, (n ≥ 2) relative to velocity of MT growth in MDA-MB-435S cells transfected with control siRNA that was set as 1. Data were analyzed by one-way ANOVA with Šídák’s multiple comparisons test. ns, not significant; *P < 0.05; **P < 0.01; ***P < 0.001; ****P < 0.0001. C PTX treatment decreases MT growth velocity much stronger in 3αV-EB3 cells compared to 435S-EB3 cells. Quantification of time-lapse live cell microscopy data of 435S-EB3 cells and 3αV-EB3 clone upon treatment with equitoxic and equimolar concentrations of PTX. Scatter plot with median marked in red represents measurements of > 200 analyzed microtubules, (n = 3) relative to velocity of MT growth in MDA-MB-435S cells that was set as 1. Data were analyzed by one-way ANOVA with Šídák’s multiple comparisons test. ns, not significant; *P < 0.05; **P < 0.01; ***P < 0.001; ****P < 0.0001. D Cell proliferation decreases upon knockdown of talin1, but not talin2, KANK1 or KANK2. Cell proliferation was measured using ClickIT EdU assay upon transfection with either control, talin1, talin2, combination of talin1 and talin2, KANK1 or KANK2-specific siRNA. Histogram represents measurements of > 30 cells, plotted as mean ± SD (n = 2). Data were analyzed by one-way ANOVA with Dunnett’s multiple comparison. ns, not significant; *P < 0.05; **P < 0.01; ***P < 0.001; ****P < 0.0001. E Talin2 knockdown increases sensitivity to PTX in MDA-MB-435S cells. Twenty-four hours upon transfection, cells were seeded in 96-well plates and 24 h later treated with different concentrations of PTX. Cytotoxicity was measured by MTT assay. Data were analyzed by two-way analysis of variance (ANOVA) with Šídák’s multiple comparisons test, with a single pooled variance. ns, not significant; *P < 0.05; **P < 0.01; ***P < 0.001; ****P < 0.0001. (n = 3). F Talin2 knockdown decreases migration in MDA-MB-435S cells. Serum starved (24 h) cells, transfected previously with either control or talin2-specific siRNA were seeded in Transwell cell culture inserts and left to migrate for 22 h toward serum. Cells on the underside of the inserts were stained with crystal violet, photographed, and counted. Scale bar = 100 µm. F Histogram data represents averages of five microscope fields of three independently performed experiments, plotted as mean ± SD. Data were analyzed by unpaired Student’s t-test. ns, not significant; *P < 0.05; **P < 0.01; ***P < 0.001; ****P < 0.0001
Fig. 6
Fig. 6
Schematic representation of the functional link between talin2 from αVβ5 FAs and KANK2 from CMSC. Disruption of the link, either by KANK2 or talin2 knockdown, results in increased velocity of MT growth, increased sensitivity to PTX and decreased migration of MDA-MB-435S cells

Similar articles

Cited by

References

    1. Hynes RO. Integrins: bidirectional, allosteric signaling machines. Cell. 2002;110(6):673–687. doi: 10.1016/S0092-8674(02)00971-6. - DOI - PubMed
    1. Green HJ, Brown NH. Integrin intracellular machinery in action. Exp Cell Res. 2019;378(2):226–231. doi: 10.1016/j.yexcr.2019.03.011. - DOI - PubMed
    1. Burridge K, Guilluy C. Focal adhesions, stress fibers and mechanical tension. Exp Cell Res. 2016;343(1):14–20. doi: 10.1016/j.yexcr.2015.10.029. - DOI - PMC - PubMed
    1. Walko G, Castanon MJ, Wiche G. Molecular architecture and function of the hemidesmosome. Cell Tissue Res. 2015;360(3):529–544. doi: 10.1007/s00441-015-2216-6. - DOI - PMC - PubMed
    1. Lock JG, Jones MC, Askari JA, Gong XW, Oddone A, Olofsson H, et al. Reticular adhesions are a distinct class of cell-matrix adhesions that mediate attachment during mitosis. Nat Cell Biol. 2018;20(11):1290–1302. doi: 10.1038/s41556-018-0220-2. - DOI - PubMed