Meta-Analysis
. 2023 Jul 18:12:e86514.
doi: 10.7554/eLife.86514.

Genetic insights into ossification of the posterior longitudinal ligament of the spine

Collaborators, Affiliations
Meta-Analysis

Genetic insights into ossification of the posterior longitudinal ligament of the spine

Yoshinao Koike et al. Elife. .

Abstract

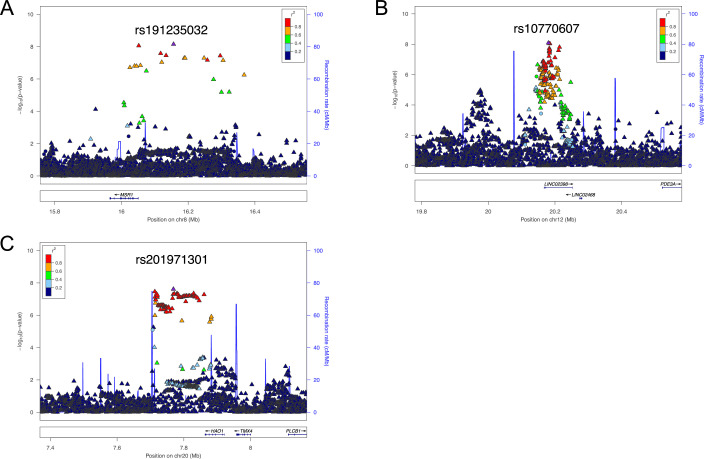
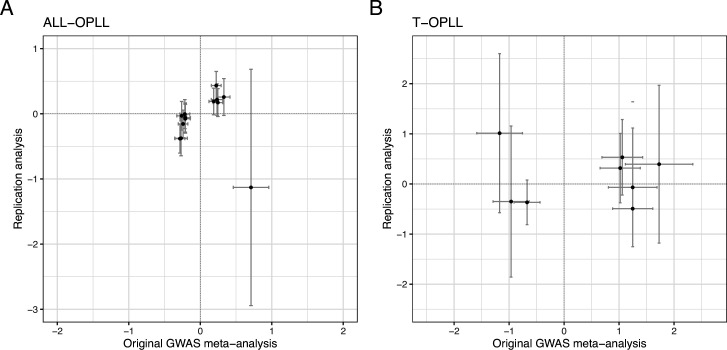
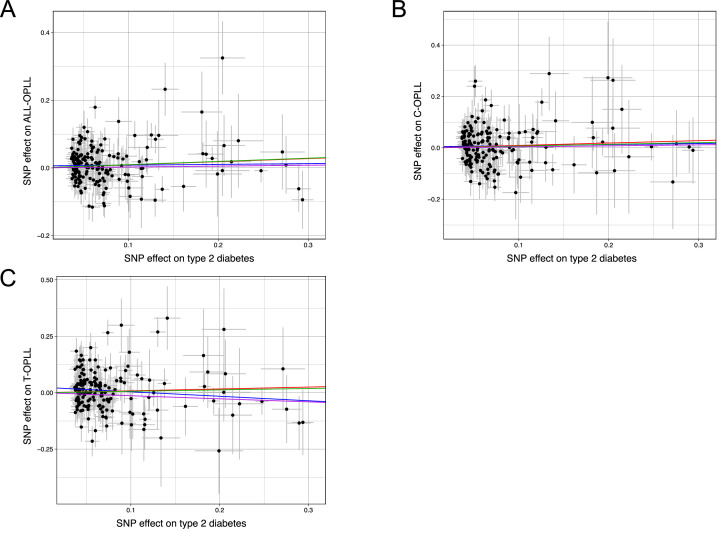
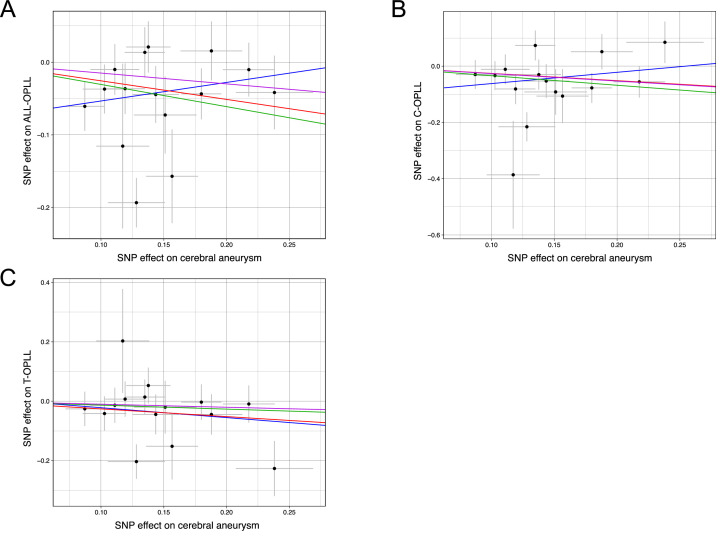
Ossification of the posterior longitudinal ligament of the spine (OPLL) is an intractable disease leading to severe neurological deficits. Its etiology and pathogenesis are primarily unknown. The relationship between OPLL and comorbidities, especially type 2 diabetes (T2D) and high body mass index (BMI), has been the focus of attention; however, no trait has been proven to have a causal relationship. We conducted a meta-analysis of genome-wide association studies (GWASs) using 22,016 Japanese individuals and identified 14 significant loci, 8 of which were previously unreported. We then conducted a gene-based association analysis and a transcriptome-wide Mendelian randomization approach and identified three candidate genes for each. Partitioning heritability enrichment analyses observed significant enrichment of the polygenic signals in the active enhancers of the connective/bone cell group, especially H3K27ac in chondrogenic differentiation cells, as well as the immune/hematopoietic cell group. Single-cell RNA sequencing of Achilles tendon cells from a mouse Achilles tendon ossification model confirmed the expression of genes in GWAS and post-GWAS analyses in mesenchymal and immune cells. Genetic correlations with 96 complex traits showed positive correlations with T2D and BMI and a negative correlation with cerebral aneurysm. Mendelian randomization analysis demonstrated a significant causal effect of increased BMI and high bone mineral density on OPLL. We evaluated the clinical images in detail and classified OPLL into cervical, thoracic, and the other types. GWAS subanalyses identified subtype-specific signals. A polygenic risk score for BMI demonstrated that the effect of BMI was particularly strong in thoracic OPLL. Our study provides genetic insight into the etiology and pathogenesis of OPLL and is expected to serve as a basis for future treatment development.

Keywords: Mendelian randomization; bone mineral density; genetics; genome-wide association study; genomics; human; obesity; ossification of the posterior longitudinal ligament of the spine; polygenic risk score.


Conflict of interest statement

YK, MT, MN, NO, HS, XL, TE, SI, KK, TK, SK, MK, HS, TT, TM, HI, TY, MK, HN, KA, YT, KT, SI, KT, KH, YI, YK, SM, HN, KM, AS, SF, TK, KW, TT, KK, SK, MT, KY, HT, HL, SN, KO, YM, AO, MM, NI, CT, SI No competing interests declared, YK Consulting fees from Medacta International, MY representatives of Japanese Organization of the Study for Ossification of Spinal Ligament

Figures

Figure 1.
Figure 1.. Meta-analysis of genome-wide association studies (GWAS) identified 14 significant loci in ossification of the posterior longitudinal ligament of the spine (OPLL).
Manhattan plot showing the -log10 p-value for each single-nucleotide polymorphism (SNP) in the meta-analysis. The values were plotted against the respective chromosomal positions. The horizontal red line represents the genome-wide significance threshold (p=5.0 × 10⁻⁸). Red and blue points represent the SNPs in the new and known loci, respectively.
Figure 1—figure supplement 1.
Figure 1—figure supplement 1.. The overview of the genome-wide association study meta-analysis.
Figure 1—figure supplement 2.
Figure 1—figure supplement 2.. A quantile–quantile plot of meta-analysis of genome-wide association studies.
Horizontal and vertical lines represent the expected p-value under a null distribution and the observed p-value, respectively.
Figure 1—figure supplement 3.
Figure 1—figure supplement 3.. Regional association plots for 14 susceptibility loci for ossification of the posterior longitudinal ligament of the spine (OPLL).
Each plot shows –log10 p-values against the chromosomal position of variants in specific regions. (A) 2p23.3. (B) 6p21.1. (C) 8q23.1. (D) 8q23.3. (E) 11q14.2. (F) 12p12.3. (G) 12p12.2. (H) 12p11.22. (I) 12p11.22. (J) 14q21.3. (K) 14q23.2. (L) 15q25.3. (M) 16q22.1. (N) 20p12.3. The variant with the highest association signal in each locus is represented in purple; the other variants are colored according to the extent of linkage disequilibrium (LD) with this variant. The imputed single-nucleotide polymorphisms (SNPs) are represented by triangles and genotyped SNPs by circles, respectively. The estimated recombination rates from hg19/1000 Genomes Nov 2014 East Asian are shown as light blue lines.
Figure 1—figure supplement 4.
Figure 1—figure supplement 4.. Statistical power analysis.
X- and Y-axes represent minor allele frequencies (MAFs) and odds ratios (ORs), respectively. Alpha-error rate and statistical power are set to 5e-8 and 0.8 (red line) or 0.5 (blue line), respectively. Dots represent ORs of 14 ossification of the posterior longitudinal ligament of the spine (OPLL)-associated variants in genome-wide association studies (GWAS) meta-analysis for ALL-OPLL.
Figure 1—figure supplement 5.
Figure 1—figure supplement 5.. Summary-data-based Mendelian randomization.
(A) In the top plot, gray dots represent p-values for single-nucleotide polymorphisms (SNPs) from the genome-wide association studies (GWAS) meta-analysis for ossification of the posterior longitudinal ligament of the spine (OPLL), and diamonds represent p-values for probes from the summary data-based Mendelian randomization (SMR). In the bottom plot, each red ‘X’ represents the expression quantitative trait loci (eQTL) p-value of SNPs from GTEx v7 for PLEC in fibroblast. GTEx, Genotype-Tissue Expression. (B) Effect sizes of SNPs from GWAS plotted against those for SNPs from the fibroblast eQTL study. Orange dashed line represents the estimate of the effect size of the SMR at the top cis-eQTL. Error bars are standard errors of SNP effects.
Figure 1—figure supplement 6.
Figure 1—figure supplement 6.. Ossification of the posterior longitudinal ligament of the spine (OPLL)-subtype stratification identified subtype-specific loci.
Manhattan plot showing the -log10 p-value for each single-nucleotide polymorphism (SNP) in the genome-wide association studies (GWAS) meta-analysis. (A) Cervical OPLL. (B) Thoracic OPLL. The values were plotted against the respective chromosomal positions. The horizontal red line represents the genome-wide significance threshold (p=5.0 × 10⁻⁸). Red and blue points represent the SNPs in the new and known loci, respectively.
Figure 1—figure supplement 7.
Figure 1—figure supplement 7.. A quantile–quantile plot of meta-analysis of subtype stratified genome-wide association studies.
Horizontal and vertical lines represent the expected p-value under a null distribution and the observed p-value, respectively. (A) Cervical ossification of the posterior longitudinal ligament of the spine (OPLL). (B) Thoracic OPLL.
Figure 1—figure supplement 8.
Figure 1—figure supplement 8.. Regional association plots for three susceptibility loci for cervical ossification of the posterior longitudinal ligament of the spine (OPLL).
Each plot shows –log10 p-values against the chromosomal position of variants in a specific region. (A) 8p22. (B) 12p12.2. (C) 20p12.3. The variant with the highest association signal in each locus is represented in purple; the other variants are colored according to the extent of linkage disequilibrium (LD) with this variant. The imputed single-nucleotide polymorphisms (SNPs) are represented by triangles and genotyped SNPs by circles, respectively. The estimated recombination rates from hg19/1000 Genomes Nov 2014 East Asian are shown as light blue lines.
Figure 1—figure supplement 9.
Figure 1—figure supplement 9.. Regional association plots for eight susceptibility loci for thoracic ossification of the posterior longitudinal ligament of the spine (OPLL).
Each plot shows –log10 p-values against the chromosomal position of variants in a specific region. (A) 1p36.21. (B) 1p36.12. (C) 8q11.21. (D) 12p13.1. (E) 19p13.2. (F) 19p12. (G) 23q23.31. (H) 23q27.3. (I) 23q28. The variant with the highest association signal in each locus is represented in purple; the other variants are colored according to the extent of linkage disequilibrium (LD) with this variant. The imputed single-nucleotide polymorphisms (SNPs) are represented by triangles and genotyped SNPs by circles, respectively. The estimated recombination rates from hg19/1000 Genomes Nov 2014 East Asian are shown as light blue lines.
Figure 1—figure supplement 10.
Figure 1—figure supplement 10.. Expression levels of candidate genes in spinal ligament tissue in patients with cervical spondylotic myelopathy (CSM) and ossification of the posterior longitudinal ligament of the spine (OPLL).
Bar plot showing expression levels of candidate genes identified in (A) ALL-, (B) C-, and (C) T-OPLL genome-wide association studies (GWAS) meta-analyses, and (D) gene-based analysis and summary data-based Mendelian randomization (SMR). Red and blue bars represent expression levels in patients with CSM and OPLL, respectively. Error bars represent 95% confidence intervals. (E) Distribution of the T statistic calculated by t-test (CSM versus OPLL). Genes with p<0.05 are indicated by gene name.
Figure 1—figure supplement 11.
Figure 1—figure supplement 11.. Expression levels of candidate genes in chondrogenic differentiated human ligament cells.
Bar plot showing expression levels of candidate genes identified in (A) ALL-, (B) C-, and (C) T-OPLL genome-wide association studies (GWAS) meta-analyses, and (D) gene-based analysis and summary data-based Mendelian randomization (SMR). Red and blue bars represent expression levels in control (Ctrl) and chondrogenic differentiated human ligament cells (Diff), respectively. Error bars represent 95% confidence intervals. (E) Distribution of the T statistic calculated by t-test (chondrogenic differentiated human ligament cells versus control). Genes with p<0.05 are indicated by gene name.
Figure 1—figure supplement 12.
Figure 1—figure supplement 12.. Analyses of scRNA-seq GSE126060 data.
(A) The Uniform Manifold Approximation and Projection (UMAP) shows 13 clusters. (B) Violin plots of marker genes for each cell type.
Figure 1—figure supplement 13.
Figure 1—figure supplement 13.. Gene expression in each cluster at scRNA-seq GSE126060.
Expression levels of candidate genes found in genome-wide association studies (GWAS) meta-analysis for (A) ALL-, (B) C-, and (C) T-OPLL, and (D) gene-based association analysis and summary data-based Mendelian randomization.
Figure 1—figure supplement 14.
Figure 1—figure supplement 14.. Analyses of scRNA-seq GSE188758 data.
(A) The Uniform Manifold Approximation and Projection (UMAP) shows nine clusters. (B) Violin plots of marker genes for each cell type.
Figure 1—figure supplement 15.
Figure 1—figure supplement 15.. Gene expression in each cluster at scRNA-seq GSE188758.
Expression levels of candidate genes found in genome-wide association studies (GWAS) meta-analysis for (A) ALL-, (B) C-, and (C) T-OPLL, and (D) gene-based association analysis and summary data-based Mendelian randomization.
Figure 1—figure supplement 16.
Figure 1—figure supplement 16.. Comparison of effect sizes of the genome-wide association studies (GWAS) lead single-nucleotide polymorphisms (SNPs) between the original GWAS meta-analysis and replication analysis.
(A) ALL-OPLL and (B) T-OPLL. Each dot represents the effect size of each SNP on ossification of the posterior longitudinal ligament of the spine (OPLL) in the original GWAS meta-analysis (x-axis) and replication analysis (y-axis), respectively. Error bars represent 95% confidence intervals. The numbers in the upper right of each figure are Pearson’s correlation coefficient (r) and p-value.
Figure 1—figure supplement 17.
Figure 1—figure supplement 17.. Comparison of effect sizes between ossification of the posterior longitudinal ligament of the spine (OPLL) and ankylosing spondylitis (AS) genome-wide association studies (GWASs) for AS-associated single-nucleotide polymorphisms (SNPs).
(A) ALL-OPLL, (B) C-OPLL, and (C) T-OPLL. Each dot represents the AS-associated SNP plotted along with effect size estimates on OPLL (x-axis) and AS (y-axis). Error bars represent 95% confidence intervals. The numbers in the upper right of each figure are Pearson's correlation coefficient (r) and p-value.
Figure 2.
Figure 2.. Gene-based association analysis identified five significantly associated genes in ossification of the posterior longitudinal ligament of the spine (OPLL).
Manhattan plot showing the -log10 p-value for each gene in the analysis. The values were plotted against the respective chromosomal positions. The horizontal red lines represent significance threshold (p=5.0 × 10⁻⁸).
Figure 3.
Figure 3.. Genetic correlation between ossification of the posterior longitudinal ligament of the spine (OPLL) and other complex traits.
Significant positive correlations with body mass index (BMI) and type 2 diabetes, and negative correlations with cerebral aneurysm were observed. Error bars indicate 95% confidence intervals. Red color gradations represent the level of p-value. Noted by asterisk is the significant correlation (false discovery rate [FDR] < 0.05).
Figure 4.
Figure 4.. Causal effect of body mass index, type 2 diabetes, cerebral aneurysm, and bone mineral density on ossification of the posterior longitudinal ligament of the spine (OPLL).
Causal effects were estimated using two-sample Mendelian randomization (MR) methods. Error bars indicate 95% confidence intervals. Significant (p<0.05) results are shown as red and blue dots for positive and negative causal effects, respectively. Noted by asterisk are the items that meet strict threshold (p<0.05/48=1.04 × 10–3). IVW, inverse variance weighted.
Figure 4—figure supplement 1.
Figure 4—figure supplement 1.. Selection of single-nucleotide polymorphisms (SNPs) to be used as instrumental variables in Mendelian randomization.
BMI, body mass index; BMD, bone mineral density; UKBB, UK Biobank; GIANT, The Genetic Investigation of ANthropometric Traits consortium; WHR, waist-to-hip ratio; WHRadjBMI, WHR adjusted for BMI, 1KGP3, the 1000 Genomes Project Phase 3; EAS, East Asian; EUR, European.
Figure 4—figure supplement 2.
Figure 4—figure supplement 2.. Scatter plots for the Mendelian randomization (MR) of the causal effect of body mass index (BMI) on ossification of the posterior longitudinal ligament of the spine (OPLL).
Each dot represents the BMI-associated single-nucleotide polymorphism (SNP) plotted along with the effect size estimates on BMI (x-axis) and OPLL (y-axis). Error bars represent 95% confidence intervals. The slopes of the lines represent the causal association evaluated by four MR methods: red, inverse variance weighted (IVW); blue, MR-Egger, green, simple median; purple, weighted median.
Figure 4—figure supplement 3.
Figure 4—figure supplement 3.. Sensitivity analysis of the Mendelian randomization (MR) of body mass index (BMI) causality on ossification of the posterior longitudinal ligament of the spine (OPLL).
(A) Forest plot. Each black point represents an effect size for BMI on OPLL, produced using significant single-nucleotide polymorphisms (SNPs) in BMI genome-wide association studies (GWAS) as separate instruments. The black point in the bottom row shows the combined causal estimate using all SNPs together in a single instrument using two methods of MR: inverse variance weighted (IVW) and MR-Egger. Horizontal lines are 95% confidence intervals. (B) Leave-one-out analysis. Each row represents an MR result (IVW) of BMI on ALL-OPLL after discarding the SNP listed on the y-axis. The point represents the effect size, and the horizontal line represents the 95% confidence interval. (C) Funnel plot. On the y-axis, 1/SEIV represents the inverse standard error of the estimated causal effect for each single SNPs (instrumental variables). On the x-axis, βIV represents the effect size of each SNP. Colored lines represent the effect sizes of the different MR analyses: red, IVW; blue, MR-Egger.
Figure 4—figure supplement 4.
Figure 4—figure supplement 4.. Scatter plots for the Mendelian randomization (MR) of the causal effect of type 2 diabetes on ossification of the posterior longitudinal ligament of the spine (OPLL).
(A) OPLL. (B) Cervical OPLL. (C) Thoracic OPLL. Each dot represents the type 2 diabetes-associated single-nucleotide polymorphism (SNP) plotted along with effect size estimates on type 2 diabetes (x-axis) and OPLL (y-axis). Error bars represent 95% confidence intervals. The slopes of the line represent the causal association evaluated by four MR methods: red, inverse variance weighted (IVW); blue, MR-Egger; green, simple median; purple, weighted median.
Figure 4—figure supplement 5.
Figure 4—figure supplement 5.. Scatter plots for the Mendelian randomization (MR) of the causal effect of bone mineral density on ossification of the posterior longitudinal ligament of the spine (OPLL).
(A) OPLL. (B) Cervical OPLL. (C) Thoracic OPLL. Each dot represents the bone mineral density-associated single-nucleotide polymorphism (SNP) plotted along with effect size estimates on bone mineral density (x-axis) and OPLL (y-axis). Error bars represent 95% confidence intervals. The line slopes represent the causal association evaluated by four MR methods: red, inverse variance weighted (IVW); blue, MR-Egger; green, simple median; purple, weighted median.
Figure 4—figure supplement 6.
Figure 4—figure supplement 6.. Scatter plots for the Mendelian randomization (MR) of the causal effect of cerebral aneurysm on ossification of the posterior longitudinal ligament of the spine (OPLL).
(A) OPLL. (B) Cervical OPLL. (C) thoracic OPLL. Each dot represents the cerebral aneurysm-associated single-nucleotide polymorphism (SNP) plotted along with effect size estimates on cerebral aneurysm (x-axis) and OPLL (y-axis). Error bars represent 95% confidence intervals. The line slopes represent the causal association evaluated by four MR methods: red, inverse variance weighted (IVW); blue, MR-Egger; green, simple median; purple, weighted median.
Figure 4—figure supplement 7.
Figure 4—figure supplement 7.. Scatter plots for the Mendelian randomization (MR) of the causal effect of ossification of the posterior longitudinal ligament of the spine (OPLL) on body mass index (BMI), type 2 diabetes, cerebral aneurysm, and bone mineral density.
Each dot represents the OPLL-associated single-nucleotide polymorphism (SNP) plotted along with its effect on OPLL (x-axis) and (A) BMI, (B) type 2 diabetes, (C) cerebral aneurysm, and (D) bone mineral density (y-axis). Error bars represent 95% confidence intervals. The line slopes represent the causal association evaluated by four MR methods: red, inverse variance weighted (IVW); blue, MR-Egger; green, simple median; purple, weighted median.
Figure 4—figure supplement 8.
Figure 4—figure supplement 8.. Scatter plots for the Mendelian randomization (MR) of the causal effect of body mass index (BMI) on ossification of the posterior longitudinal ligament of the spine (OPLL) subtypes.
Each dot represents the BMI-associated single-nucleotide polymorphism (SNP) plotted along with the effect size estimates on BMI (x-axis) and OPLL subtype (y-axis). (A) Cervical OPLL. (B) Thoracic OPLL. Error bars represent 95% confidence intervals. The line slopes represent the causal association evaluated by four MR methods: red, inverse variance weighted (IVW); blue, MR-Egger; green, simple median; purple, weighted median.
Figure 4—figure supplement 9.
Figure 4—figure supplement 9.. Sensitivity analysis of the Mendelian randomization (MR) of body mass index (BMI) causality on ossification of the posterior longitudinal ligament of the spine (OPLL) subtypes.
(A, D) Forest plot. Each black point represents an effect size for BMI on (A) cervical and (D) thoracic OPLL, produced using significant single-nucleotide polymorphisms (SNPs) in BMI genome-wide association studies (GWAS) as separate instruments. The black point in the bottom row shows the combined causal estimate using all SNPs together in a single instrument, using two methods of MR: inverse variance weighted (IVW) and MR-Egger. Horizontal lines are 95% confidence intervals. (B, E) Leave-one-out analysis. Each row represents an MR result (IVW) of BMI on (B) cervical OPLL and (E) thoracic OPLL after discarding the SNP listed on the y-axis. The point represents the effect size, and the horizontal line represents 95% confidence intervals. (C, F) Funnel plot. On the y-axis, 1/SEIV represents the inverse standard error of the estimated causal effect for each of the single SNPs (instrumental variables) ((C) cervical OPLL, (F) thoracic OPLL). On the x-axis, βIV represents the effect size of each SNP. Colored lines represent the effect sizes of the different MR analyses: red, IVW; blue, MR-Egger.
Figure 4—figure supplement 10.
Figure 4—figure supplement 10.. Mendelian randomization (MR) for obesity-related traits on ossification of the posterior longitudinal ligament of the spine (OPLL).
Causal effects were estimated using two-sample MR methods. Error bars indicate 95% confidence intervals. Significant (p<0.05) results are shown as red and blue dots for positive and negative causal effects, respectively. Noted by asterisk are the items that meet strict threshold (p<0.05/36=1.39 × 10–3). The light colors indicate the original MR analysis results. IVW, inverse variance weighted.
Figure 4—figure supplement 11.
Figure 4—figure supplement 11.. Correlation of the effect sizes of the genome-wide single-nucleotide polymorphisms (SNPs) of ossification of the posterior longitudinal ligament of the spine (OPLL) and body mass index (BMI).
(A) ALL-OPLL and BMI, (B) C-OPLL and BMI, and (C) T-OPLL and BMI. Correlations were evaluated for sets of SNPs stratified by the thresholds based on the genome-wide association studies (GWAS) p-values in each trait. Noted by asterisk is the significant correlation (p<0.05/8). The x-axis shows the p-value of the SNPs, and the y-axis shows the correlation coefficient of the effect size.
Figure 4—figure supplement 12.
Figure 4—figure supplement 12.. Replication of Mendelian randomization (MR) for body mass index, type 2 diabetes, cerebral aneurysm, and bone mineral density on ossification of the posterior longitudinal ligament of the spine (OPLL).
Causal effects were estimated using two-sample MR methods. Error bars indicate 95% confidence intervals. Significant (p<0.05) results are shown as red and blue dots for positive and negative causal effects, respectively. Noted by asterisk are the items that meet strict threshold (p<0.05/48=1.04 × 10–3). The light colors indicate the original MR analysis results. IVW, inverse variance weighted.
Figure 4—figure supplement 13.
Figure 4—figure supplement 13.. Replication of Mendelian randomization (MR) for obesity-related traits on ossification of the posterior longitudinal ligament of the spine (OPLL).
Causal effects were estimated using two-sample MR methods. Error bars indicate 95% confidence intervals. Significant (p<0.05) results are shown as red and blue dots for positive and negative causal effects, respectively. Noted by asterisk are the items that meet strict threshold (p<0.05/36=1.39 × 10–3). The light colors indicate the original MR analysis results. IVW, inverse variance weighted.
Figure 5.
Figure 5.. Body mass index (BMI) polygenic risk score predicts ossification of the posterior longitudinal ligament of the spine (OPLL).
Vertical columns represent effect sizes of BMI polygenic risk score (PRS) on three types of OPLL: cervical (C-) OPLL, thoracic (T-) OPLL, and ALL-OPLL (C-OPLL, T-OPLL, and others). The BMI PRS could predict OPLL, especially T-OPLL. Error bars represent the 95% confidence intervals of the effects.
Figure 5—figure supplement 1.
Figure 5—figure supplement 1.. Body mass index (BMI) polygenic risk score analysis for ossification of the posterior longitudinal ligament of the spine (OPLL).
Overview of the analysis using BMI polygenic risk score for OPLL and its subtypes 1KGP3EAS, the 1000 Genomes Project Phase 3 East Asian; JEWEL_ 3K, 3,256 in-house Japanese whole-genome sequence data. IVW, inverse variance weighted.
Figure 5—figure supplement 2.
Figure 5—figure supplement 2.. Determination of the best parameter for body mass index (BMI) polygenic risk score.
The horizontal line represents the Spearman’s rho between the BMI and the BMI polygenic risk score. The vertical line represents the P-value thresholds in clumping. Each color represents the r-square used as a clumping parameter.
Author response image 1.
Author response image 1.. Statistical power analysis.
X- and Y-axes represent minor allele frequencies and ORs, respectively. Α-error rate and statistical power are set to 5e-8 and 0.8 (red line) or 0.5 (blue line), respectively. Dots represent ORs of 14 OPLL-associated variants in GWAS meta-analysis for ALL-OPLL. We conducted analyses on each dataset and on the meta-analysis data: (a) Set 1, (b) Set 2, (c) Set 3.

Update of

  • doi: 10.1101/2022.06.16.22276152

References

    1. Akiyama M, Okada Y, Kanai M, Takahashi A, Momozawa Y, Ikeda M, Iwata N, Ikegawa S, Hirata M, Matsuda K, Iwasaki M, Yamaji T, Sawada N, Hachiya T, Tanno K, Shimizu A, Hozawa A, Minegishi N, Tsugane S, Yamamoto M, Kubo M, Kamatani Y. Genome-wide Association study identifies 112 new Loci for body mass index in the Japanese population. Nature Genetics. 2017;49:1458–1467. doi: 10.1038/ng.3951. - DOI - PubMed
    1. Akiyama M, Ishigaki K, Sakaue S, Momozawa Y, Horikoshi M, Hirata M, Matsuda K, Ikegawa S, Takahashi A, Kanai M, Suzuki S, Matsui D, Naito M, Yamaji T, Iwasaki M, Sawada N, Tanno K, Sasaki M, Hozawa A, Minegishi N, Wakai K, Tsugane S, Shimizu A, Yamamoto M, Okada Y, Murakami Y, Kubo M, Kamatani Y. Characterizing rare and low-frequency height-associated variants in the Japanese population. Nature Communications. 2019;10:4393. doi: 10.1038/s41467-019-12276-5. - DOI - PMC - PubMed
    1. Akune T, Ogata N, Seichi A, Ohnishi I, Nakamura K, Kawaguchi H. Insulin Secretory response is positively associated with the extent of ossification of the posterior longitudinal ligament of the spine. The Journal of Bone and Joint Surgery. American Volume. 2001;83:1537–1544. doi: 10.2106/00004623-200110000-00013. - DOI - PubMed
    1. Bakker MK, van der Spek RAA, van Rheenen W, Morel S, Bourcier R, Hostettler IC, Alg VS, van Eijk KR, Koido M, Akiyama M, Terao C, Matsuda K, Walters RG, Lin K, Li L, Millwood IY, Chen Z, Rouleau GA, Zhou S, Rannikmäe K, Sudlow CLM, Houlden H, van den Berg LH, Dina C, Naggara O, Gentric J-C, Shotar E, Eugène F, Desal H, Winsvold BS, Børte S, Johnsen MB, Brumpton BM, Sandvei MS, Willer CJ, Hveem K, Zwart J-A, Verschuren WMM, Friedrich CM, Hirsch S, Schilling S, Dauvillier J, Martin O, Jones GT, Bown MJ, Ko NU, Kim H, Coleman JRI, Breen G, Zaroff JG, Klijn CJM, Malik R, Dichgans M, Sargurupremraj M, Tatlisumak T, Amouyel P, Debette S, Rinkel GJE, Worrall BB, Pera J, Slowik A, Gaál-Paavola EI, Niemelä M, Jääskeläinen JE, von Und Zu Fraunberg M, Lindgren A, Broderick JP, Werring DJ, Woo D, Redon R, Bijlenga P, Kamatani Y, Veldink JH, Ruigrok YM, HUNT All-In Stroke. China Kadoorie Biobank Collaborative Group. BioBank Japan Project Consortium. ICAN Study Group. CADISP Group. Genetics and Observational Subarachnoid Haemorrhage Study investigators. International Stroke Genetics Consortium Genome-wide Association study of intracranial aneurysms identifies 17 risk Loci and genetic overlap with clinical risk factors. Nature Genetics. 2020;52:1303–1313. doi: 10.1038/s41588-020-00725-7. - DOI - PMC - PubMed
    1. Benner C, Spencer CCA, Havulinna AS, Salomaa V, Ripatti S, Pirinen M. FINEMAP: efficient variable selection using summary data from genome-wide Association studies. Bioinformatics. 2016;32:1493–1501. doi: 10.1093/bioinformatics/btw018. - DOI - PMC - PubMed

Publication types

MeSH terms

Supplementary concepts

Associated data