[Preprint]. 2023 Jul 5:2023.07.04.547734.
doi: 10.1101/2023.07.04.547734.

The neural basis of defensive behaviour evolution in Peromyscus mice

Affiliations

The neural basis of defensive behaviour evolution in Peromyscus mice

Felix Baier et al. bioRxiv. .

Update in

Abstract

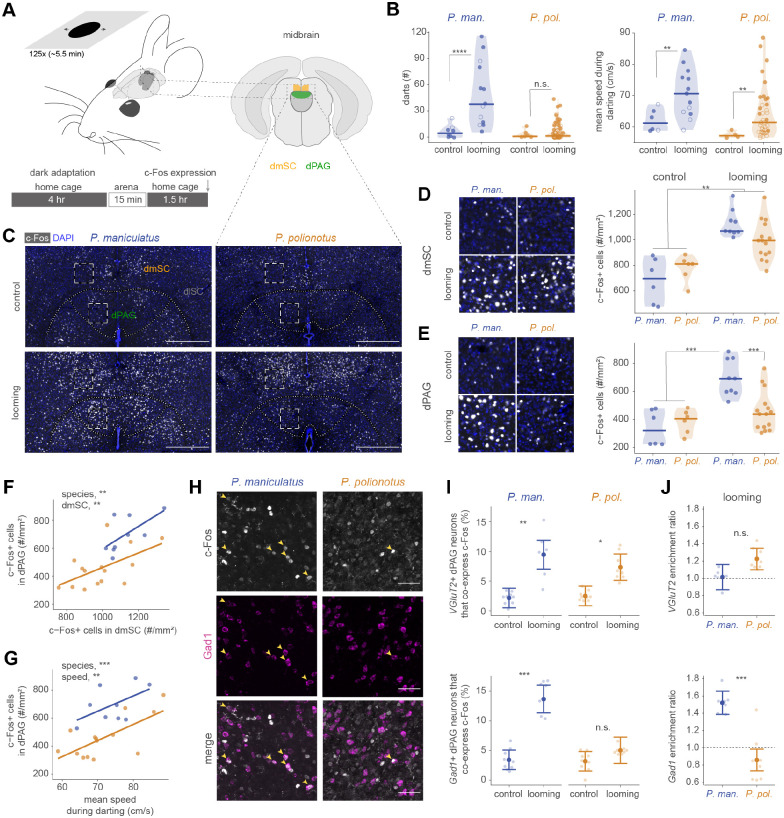
Evading imminent predator threat is critical for survival. Effective defensive strategies can vary, even between closely related species. However, the neural basis of such species-specific behaviours is still poorly understood. Here we find that two sister species of deer mice (genus Peromyscus) show different responses to the same looming stimulus: P. maniculatus, which occupy densely vegetated habitats, predominantly dart to escape, while the open field specialist, P. polionotus, pause their movement. This difference arises from species-specific escape thresholds, is largely context-independent, and can be triggered by both visual and auditory threat stimuli. Using immunohistochemistry and electrophysiological recordings, we find that although visual threat activates the superior colliculus in both species, the role of the dorsal periaqueductal gray (dPAG) in driving behaviour differs. While dPAG activity scales with running speed and involves both excitatory and inhibitory neurons in P. maniculatus, the dPAG is largely silent in P. polionotus, even when darting is triggered. Moreover, optogenetic activation of excitatory dPAG neurons reliably elicits darting behaviour in P. maniculatus but not P. polionotus. Together, we trace the evolution of species-specific escape thresholds to a central circuit node, downstream of peripheral sensory neurons, localizing an ecologically relevant behavioural difference to a specific region of the complex mammalian brain.


Conflict of interest statement

COMPETING INTERESTS The authors declare no competing interests.

Figures

Figure 1.
Figure 1.. Evolution of defensive behaviour in ecologically distinct Peromyscus species.
(A) Phylogenetic relationship of three focal Peromyscus species with representative photos of their natural habitat. (B) Movement trajectories of individual mice of P. polionotus (n=26), P. maniculatus (n=29) and P. leucopus (n=28) during 0.4 s before stimulus onset (left), sweeping (middle), and looming (right). Speed is indicated by a color gradient. (C) Raster plot of mouse speed during the sweep-looming stimulus (100% contrast). Rows represent individual mice. Trials are sorted by escape onset during the looming stimulus, with earliest on top. Speed color gradient is the same as in (B), with grey indicating the mouse is in the hut. Three grey bars above each raster plot indicate the time period of the trajectories shown in (B), and for looming are centered on the peak mean speed of each species. Line plots represent mean speed ± 95% confidence limit; horizontal shaded lines represent the 95% confidence interval of mean speed averaged across the 60 s before stimulus onset. Sample sizes are the same as (B).
Figure 2.
Figure 2.. Escape threshold differences underlie species-specific behaviour.
(A) Behavioural response to visual threat of varying intensity (looming contrast: 32%, 72%, 100%). Rows represent individual mice of P. polionotus (left) and P. maniculatus (right). Trials are sorted by latency to darting threshold. Proportion of individual mice of P. polionotus (gold) and P. maniculatus (blue) showing darting (top) and pausing (bottom) across these and additional contrast levels (far right). (B) Cumulative proportion of individual mice showing darting during 100% contrast looming stimulus. (C) Normalized peak firing rates of sSC neurons in head-fixed mice exposed to looming stimulus at different contrasts (n=3 animals for each species). Medians and 25–75% quantile ranges are indicated for each species. Firing rates are normalized to 0 for background firing and 1 for maximal response. (D-F) Raster plots and cumulative proportion of individual mice showing darting and pausing during a single looming stimulus (100% contrast) in the presence of hut (D), in the absence of hut (E), and during a sound frequency upsweep (F). Chi-Squared test (proportion, cumulative proportion), Kolmogorov-Smirnov test (darting onset distribution), Wilcoxon rank-sum test (firing rate). n.s. not significant; * P < 0.05; ** P < 0.01; *** P < 0.001; **** P < 0.0001.
Figure 3.
Figure 3.. Differential activation of dPAG neurons during escape behaviour.
(A) Behavioural setup and schematic of assay to measure neural activation during escape. Two focal midbrain regions are shown: dmSC (orange) and dPAG (green). (B) Number of darts (left) and mean speed during darting (right) of P. maniculatus (blue) and P. polionotus (gold). Data from mice that were included in the c-Fos experiment are indicated with filled circles (looming, P. maniculatus, n=9; P. polionotus, n=15; control, n=6 for both species). (C) Representative images of c-Fos expression in dmSC and dPAG. Scale bar, 500 μm. Dashed white boxes indicate regions that are enlarged in (D-E). (D-E) Images (left) and quantification (right) of c-Fos+ cells in the dmSC (D) and dPAG (E) of control and looming-exposed mice. Sample sizes are reported in (B). (F) Quantification of c-Fos+ cells in dPAG as a function of number of c-Fos+ cells in dmSC of looming-exposed mice. (G) Number of c-Fos+ cells in dPAG as a function of mean speed during darting in looming-exposed mice. (H) Representative images of c-Fos (top), Gad1 (middle) and merged (bottom) staining in the dPAG. Yellow arrows indicate positively (or double) stained cells. Scale bar, 50 μm. (I) Proportion of c-Fos+ excitatory (VGluT2; top) and inhibitory (Gad1; bottom) dPAG neurons in control and strongly escaping mice. Model fit and 95% confidence interval are shown. Points represent tissue sections (n=6–9 sections from 3 mice per species). (J) Enrichment index [proportion of excitatory/inhibitory neurons that co-express c-Fos divided by the overall proportion of c-Fos+ neurons] for excitatory (top) and inhibitory (bottom) neurons in dPAG of strongly escaping mice. Statistical significance evaluated with mixed effects models. n.s. not significant; * P < 0.05; ** P < 0.01; *** P < 0.001; **** P < 0.0001.
Figure 4.
Figure 4.. Species-specific encoding of locomotion in the dPAG.
(A) Schematic of setup to record neural activity and running speed. Mice were head-fixed on a floating ball and presented with looming/dimming stimuli. (B) Representative responses to dimming (left) and looming (right) stimuli of one cell in the dPAG for P. maniculatus (blue) and P. polionotus (gold). (C) Looming selectivity of neurons in the SC and PAG for looming and dimming stimuli. Indices for sSC, dSC and dPAG are similar for both species (P > 0.1 for each, two-sample Kolmogorov-Smirnov test). Bottom: Distributions indicate looming selectivity indices for each tested mouse (P. maniculatus, n=4; P. polionotus, n=3). Dashed vertical line represents selectivity index = 0. (D) Speed and neural activity during onset of running. Mean ± STD of running speed (top row) around running onset (n=3 animals for each species). Raster plot (middle row) and mean ± STD (bottom row) of an example neuron in the dPAG. Scale bar: 10 spks/s. (E) Mean z-score of all dPAG neurons in all mice (P. maniculatus, blue; P. polionotus, gold), overlayed with the speed trace (black). Scale bar: 0.1. Inset shows neural activation precedes behaviour. (F) Correlation coefficient of speed with z-score of mean neural activity in the dPAG. Mean (horizontal line) and estimated 95% confidence intervals (vertical line) are shown relative to zero (dashed line) (see also Fig. S10C). (G) Difference in z-score in 600 ms before running onset. Mean (horizontal line) and estimated 95% confidence intervals (vertical line) are shown relative to zero (dashed line) (see also Fig. S10D). * P < 0.05 unpaired median difference Gardner-Altman estimation.
Figure 5.
Figure 5.. Optogenetic activation of excitatory dPAG neurons recapitulates species differences.
(A) Experimental paradigm for optogenetic activation of the dPAG. (B) YFP-ChR2+ neurons (green) and optic fiber tract (blue) in the dPAG. Scale bar: 400 μm (top image), 200 μm (bottom image). (C) Example trajectories of individual mice showing forward movement (i and ii; see Suppl. Movie 8 and 9) and slowing (iii and iv; see Suppl. Movie 10 and 11). Color indicates time before (greens) and during (reds) laser stimulation. (D) Speed traces of mice corresponding to example trajectories in C. (E) Raster plot of normalized speed of all trials classified as ‘forward movement’ (left) or ‘slowing’ (right). Speed was normalized to the 0.37 s before laser stimulation (‘pre’) and is indicated by a color gradient. (F-G) Percentage of trials with forward movement (F) and slowing (G) behaviour for P. maniculatus (left; triggered, n = 7; control, n = 6) and P. polionotus (right; triggered, n = 8; control, n = 5). Means (horizontal lines) for control and triggered mice and estimation statistics (unpaired mean difference Gardner-Altman estimation) are shown; distribution represents 5000 bootstrapped samples. Mean difference (black dot) and confidence intervals (vertical black line) are provided. (H) Cumulative distribution of speed index (SI; see Suppl. Fig. 13) for SI>0 (left) and SI<0 (right) for P. maniculatus (blue; triggered: n = 706 trials [n = 7 mice], control: n = 138 [n = 6]) and P. polionotus (gold; triggered: n = 568 trials [n = 8 mice], control: n = 215 [n = 5]). Individual mice are shown as thin lines; cumulative distributions of all trials as thick lines (triggered) or thick dashed lines (control). (I) Cumulative distribution of maximum speeds for trials with SI>0 at three different ranges of laser power (0–4, 4–10, 10–25 mW) for P. maniculatus (blue) and P. polionotus (gold), separately. (J) Cumulative distribution of minimum speeds for trials with SI<0. * P < 0.05, ** P < 0.01, **** P < 0.0001, two-sample Kolmogorov-Smirnov test.

References

REFERENCES (for Main Document)

    1. Abrams P. A., 2000. The evolution of predator-prey interactions: Theory and evidence. Annual Review of Ecology and Systematics 31: 79–105.
    1. Auer T. O., Khallaf M. A., Silbering A. F., Zappia G., Ellis K. et al. , 2020. Olfactory receptor and circuit evolution promote host specialization. Nature 579: 402–408. - PMC - PubMed
    1. Baldwin M. W., Toda Y., Nakagita T., O’Connell M. J., Klasing K. C. et al. , 2014. Evolution of sweet taste perception in hummingbirds by transformation of the ancestral umami receptor. Science 345: 929–933. - PMC - PubMed
    1. Ball W., and Tronick E., 1971. Infant responses to impending collision: Optical and real. Science 171: 818–820. - PubMed
    1. Basso M. A., and May P. J., 2017. Circuits for action and cognition: A view from the superior colliculus. Annual Review of Vision Science 3: 197–226. - PMC - PubMed

REFERENCES (for Materials and Methods)

    1. Brainard D. H., 1997. The psychophysics toolbox. Spatial Vision 10: 433–436. - PubMed
    1. Cardona A., Saalfeld S., Schindelin J., Arganda-Carreras I., Preibisch S. et al. , 2012. TrakEM2 software for neural circuit reconstruction. PLoS ONE 7: e38011. - PMC - PubMed
    1. De Franceschi G., Vivattanasarn T., Saleem Aman B. and Solomon Samuel G., 2016. Vision guides selection of freeze or flight defense strategies in mice. Current Biology 26: 2150–2154. - PubMed
    1. Evans D. A., Stempel A. V., Vale R., Ruehle S., Lefler Y. et al. , 2018. A synaptic threshold mechanism for computing escape decisions. Nature 558: 590–594. - PMC - PubMed
    1. Ho J., Tumkaya T., Aryal S., Choi H. and Claridge-Chang A., 2019. Moving beyond P values: data analysis with estimation graphics. Nature Methods 16: 565–566. - PubMed

Publication types