

This is a preprint.
High resolution imaging and five-year tuberculosis contact outcomes
- PMID: 37461515
- PMCID: PMC10350144
- DOI: 10.1101/2023.07.03.23292111
High resolution imaging and five-year tuberculosis contact outcomes
Abstract
Background: The evolution of tuberculosis (TB) disease during the clinical latency period remains incompletely understood.
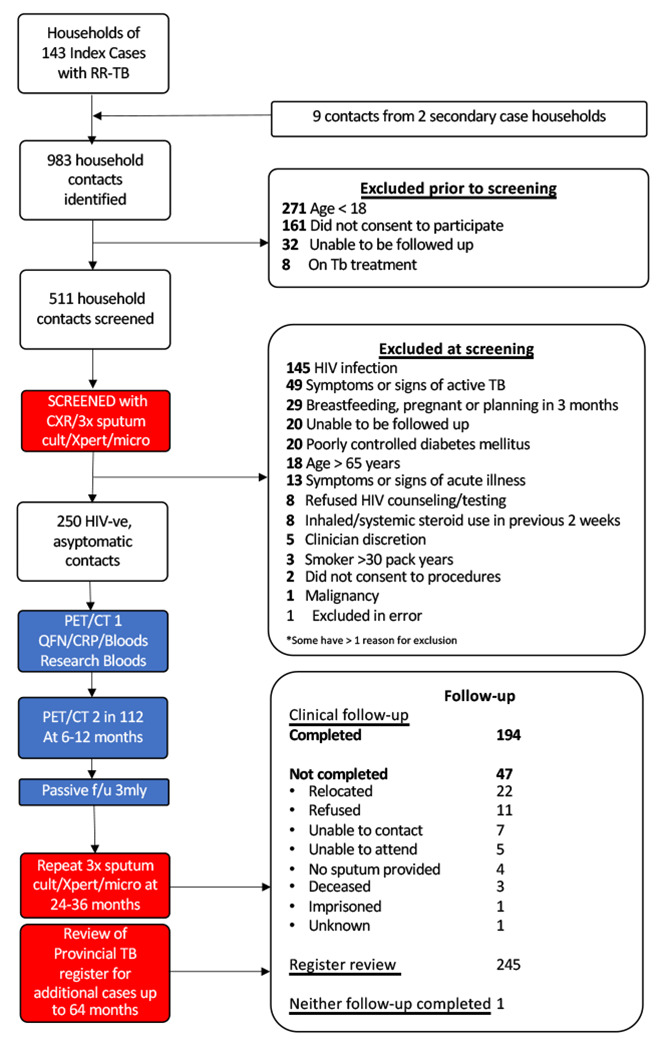
Methods: 250 HIV-uninfected, adult household contacts of rifampicin-resistant TB with a negative symptom screen underwent baseline 18F-Fluorodeoxyglucose positron emission and computed tomography (PET/CT), repeated in 112 after 5-15 months. Following South African and WHO guidelines, participants did not receive preventive therapy. All participants had intensive baseline screening with spontaneous, followed by induced, sputum sampling and were then observed for an average of 4.7 years for culture-positive disease. Baseline PET/CT abnormalities were evaluated in relation to culture-positive disease.
Results: At baseline, 59 (23.6%) participants had lung PET/CT findings consistent with TB of which 29 (11.6%) were defined as Subclinical TB, and 30 (12%) Subclinical TB-inactive. A further 83 (33.2%) had other lung parenchymal abnormalities and 108 (43.2%) had normal lungs. Over 1107-person years of follow-up 14 cases of culture-positive TB were diagnosed. Six cases were detected by intensive baseline screening, all would have been missed by the South African symptom-based screening strategy and only one detected by a WHO-recommended chest X-Ray screening strategy. Those with baseline Subclinical TB lesions on PET/CT were significantly more likely to be diagnosed with culture-positive TB over the study period, compared to those with normal lung parenchyma (10/29 [34.5%] vs 2/108 [1.9%], Hazard Ratio 22.37 [4.89-102.47, p<0.001]).
Conclusions: These findings challenge the latent/active TB paradigm demonstrating that subclinical disease exists up to 4 years prior to microbiological detection and/or symptom onset. There are important implications for screening and management of TB.
Figures


References
-
- Ferebee SH. Controlled chemoprophylaxis trials in tuberculosis. A general review. Bibl Tuberc. 1970;26:28–106. - PubMed
-
- Borgdorff MW, Sebek M, Geskus RB, Kremer K, Kalisvaart N, van Soolingen D. The incubation period distribution of tuberculosis estimated with a molecular epidemiological approach. Int J Epidemiol. 2011;40(4):964–970. - PubMed
-
- Centre for Disease Control and Prevention. Basic TB Facts: Latent TB Infections and TB Disease. https://www.cdc.gov/tb/topic/basics/tbinfectiondisease.htm. Accessed 29th August, 2021.
Publication types
Grants and funding
LinkOut - more resources
Full Text Sources