[Preprint]. 2023 Jul 6:2023.07.05.547902.
doi: 10.1101/2023.07.05.547902.

SARS-CoV-2 Nsp1 regulates translation start site fidelity to promote infection

Affiliations

SARS-CoV-2 Nsp1 regulates translation start site fidelity to promote infection

Ranen Aviner et al. bioRxiv. .

Abstract

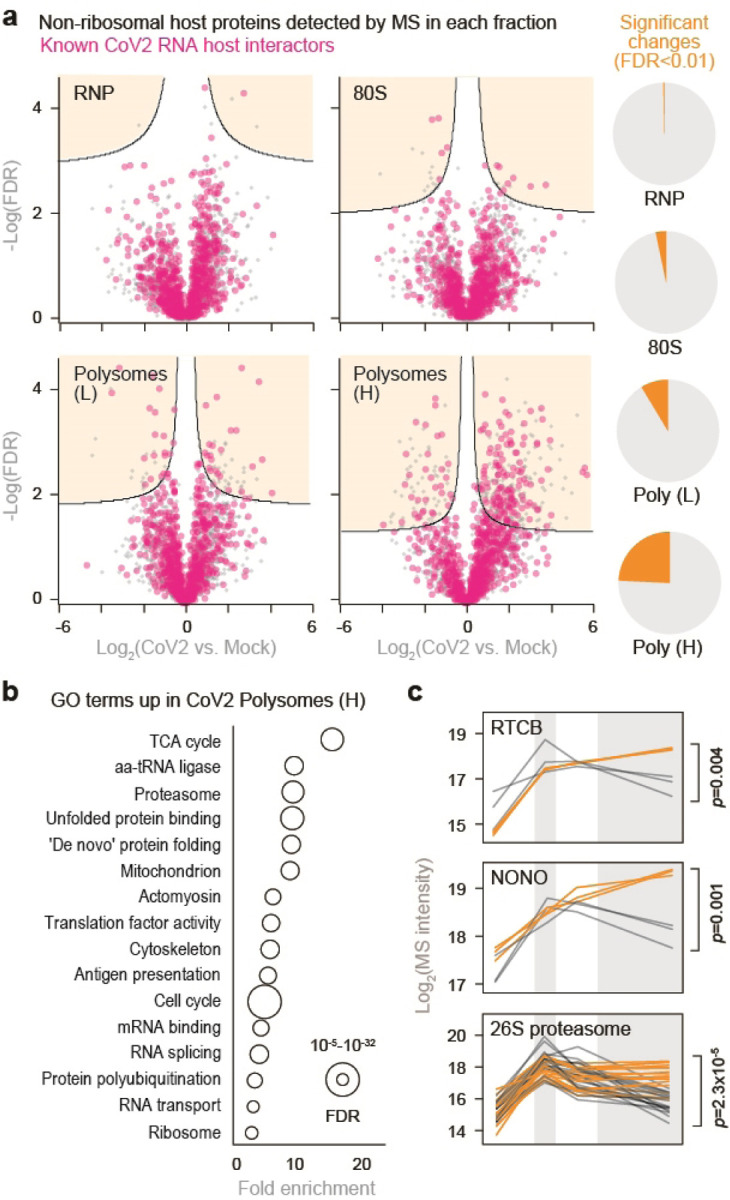
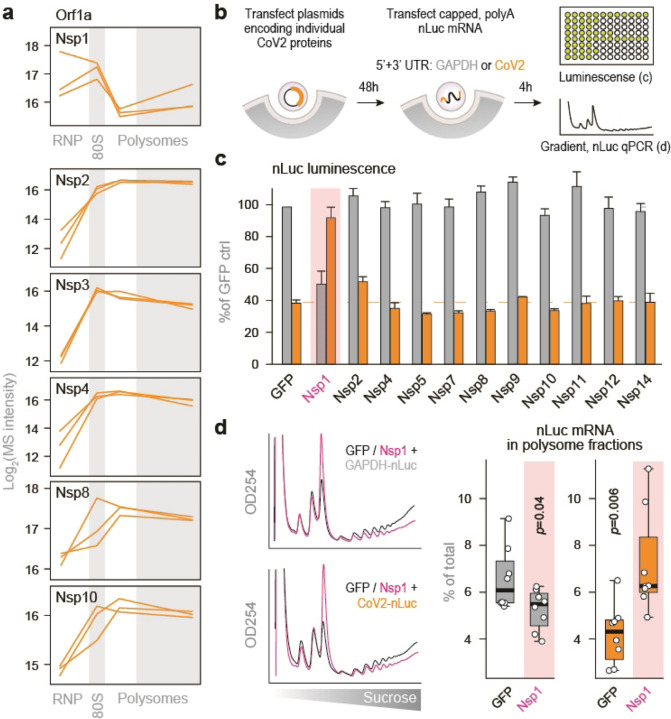
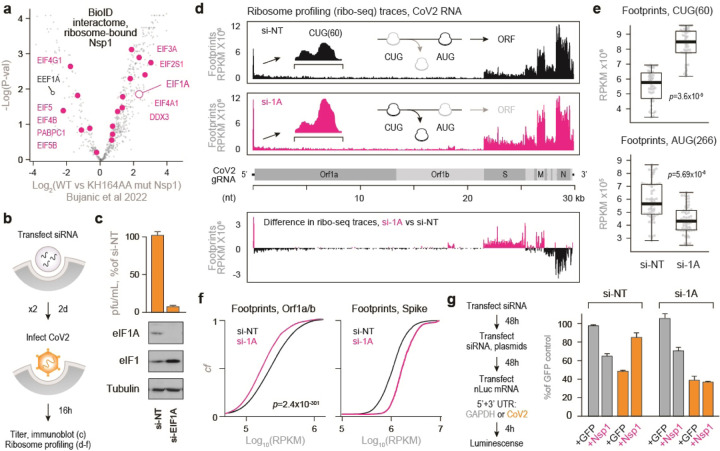
A better mechanistic understanding of virus-host interactions can help reveal vulnerabilities and identify opportunities for therapeutic interventions. Of particular interest are essential interactions that enable production of viral proteins, as those could target an early step in the virus lifecycle. Here, we use subcellular proteomics, ribosome profiling analyses and reporter assays to detect changes in polysome composition and protein synthesis during SARS-CoV-2 (CoV2) infection. We identify specific translation factors and molecular chaperones whose inhibition impairs infectious particle production without major toxicity to the host. We find that CoV2 non-structural protein Nsp1 selectively enhances virus translation through functional interactions with initiation factor EIF1A. When EIF1A is depleted, more ribosomes initiate translation from an upstream CUG start codon, inhibiting translation of non-structural genes and reducing viral titers. Together, our work describes multiple dependencies of CoV2 on host biosynthetic networks and identifies druggable targets for potential antiviral development.

Keywords: Coronavirus; Nsp1; SARS-CoV-2; proteomics; proteostasis; ribosomes; translation.


Conflict of interest statement

Declaration of interests All authors declare no competing interests.

Figures

Extended Data Fig. 1.
Extended Data Fig. 1.. Subcellular proteomics of CoV2 infected cells.
(a) Calu3 cells were infected with SARS-CoV-2 USA/WA1/2020 at MOI=5, lysed, fixed with formaldehyde and fractionated on 10–50% sucrose gradients with continuous monitoring of rRNA absorbance. Each line reflects a single replicate, and bar graphs show the ratio of polysomes to sub-polysomes, calculated as the area under the curve (AUC) of relevant fractions. Shown are means±SD of 4 independent replicates. (b) Timecourse of CoV2 RNA translation and intracellular viral protein accumulation, from. Shown are means±SD of 3 independent replicates. (c) Total protein extracted from pooled fractions of infected and uninfected cells, quantified by bicinchoninic acid (BCA) assays. Each line reflects a single replicate. (d) Boxplots of all cytosolic ribosomal proteins quantified by MS in each pooled fraction from all 3 replicates. (e) Line plots of RPS6 and CoV2 Nsp12 (RdRp) quantified by MS in each pooled fraction. Each line represents a single replicate.
Extended Data Fig. 2.
Extended Data Fig. 2.. Proteostasis factors recruited to heavy polysome fractions upon CoV2 infection.
Line plots of individual ribosomal proteins quantified by MS in each pooled fraction. Each line represents a single replicate. P, two-tailed Student’s t-test p-value of differences in indicated protein abundance in heavy polysome fractions.
Extended Data Fig. 3.
Extended Data Fig. 3.. Toxicity and antiviral effects of proteostasis modulators.
(a-b) Vero cells were infected with CoV2 at MOI=0.5. Single drugs (a) or drug combinations (b) were added at the start of infection, and titers were determined by plaque assays at 16 hours post-infection. Toxicity was determined using CellTiter-Glo at 24h of drug treatment, in the absence of CoV2 infection. Shown are means±SD of 3 independent replicates, normalized to DMSO controls.
Extended Data Fig. 4.
Extended Data Fig. 4.. Inefficient translation initiation on CoV2 gRNA.
(a) Change in abundance of individual translation initiation factors upon CoV2 infection, in each fraction. (b) Line plots of individual translation factors quantified by MS in each fraction. Each line represents a single replicate. P, two-tailed Student’s t-test p-value. (c) CoV2 RNA interactome is enriched for translation initiation factors during infection. Shown are pairwise comparisons of individual host protein abundance, quantified by MS, that specifically interact with either genomic or subgenomic CoV2 RNA. Inset, cumulative distribution plots of 40S and 60S ribosomal protein interaction with CoV2 RNA. (d) rRNA absorbance profiles showing lower abundance of free 40S subunits during CoV2 infection. Sum of four replicates.
Extended Data Fig. 5.
Extended Data Fig. 5.. Sucrose sedimentation patterns for individual CoV2 proteins.
(a) Line plots of individual viral proteins quantified by MS in each fraction. Each line represents a single replicate. (b) Related to Fig. 5d: Cells transfected with either GFP or Nsp1 followed by GAPDH-nLuc or CoV2-nLuc mRNA were lysed and fractionated on 10–50% sucrose gradients with continuous monitoring of rRNA. The content of nLuc mRNA in each fraction was determined by qPCR. Line plots show the proportion of nLuc mRNA in each fraction of a single gradient. Shown are means±SD of 2 independent replicates.
Figure 1.
Figure 1.. Subcellular proteomics of CoV2 infected cells.
(a) To identify CoV2-mediated remodeling of host biosynthetic networks, we infected Vero E6 cells with SARS-CoV-2 USA/WA1/2020 at MOI=5, lysed them, fixed the clarified lysates with formaldehyde and fractionated on 10–50% sucrose gradients. Crosslinking was reversed and protein content was analyzed by liquid chromatography tandem mass-spectrometry (LC-MS/MS). (b-c) Global protein synthesis is persistently attenuated during infection. Cells infected as above were lysed, fixed with formaldehyde and fractionated on 10–50% sucrose gradients with continuous monitoring of rRNA absorbance (b). Ratio of polysomes to sub-polysomes, calculated as the area under the curve (AUC) of relevant fractions. Shown are means±SD of 3 independent replicates (c). (d) Cells were infected and fractionated as above, in triplicates, and protein content was extracted from fractions containing free small (40S) and large (60S) ribosomal subunits (free RNP); 80S monosomes; and two polysome fractions (“Light” and “Heavy”). Each line reflects a single replicate, and fractions pooled for MS are indicated at bottom. (e) Correlation matrix of all host proteins identified by MS in each of the pooled fractions from either CoV2-infected or control cells. (f) Median and interquartile range (IQR) of all cytosolic ribosomal proteins quantified by MS in each pooled fraction from all 3 replicates. (g) Line plots of individual ribosomal proteins quantified by MS in each pooled fraction. Each line represents a single replicate. P, two-tailed Student’s t-test p-value of differences in indicated protein abundance in heavy polysome fractions.
Figure 2.
Figure 2.. CoV2 infection remodels host biosynthetic complexes.
(a) Pairwise comparisons of differences in individual protein abundance upon CoV2 infection of Vero E6 cells, per pooled fraction, as quantified by MS. Right, proportion of proteins showing statistically significant differences (FDR<0.05, S0=0.1) between infected and control cells. (b) Gene Ontology terms enriched in heavy polysome fractions from infected versus control cells. (c) Line plots of individual proteins quantified by MS in each fraction. Each line represents a single replicate. P, two-tailed Student’s t-test p-value.
Figure 3.
Figure 3.. Remodeling of biosynthetic complexes reveals druggable host targets for antiviral therapies.
(a) Line plots of individual proteostasis factors quantified by MS in each fraction. Each line represents a single replicate. P, two-tailed Student’s t-test p-value. (b) Cells were infected with CoV2 at MOI=0.5. Drugs were added at the start of infection, and titers were determined by plaque assays at 16 hours post-infection. Shown are means±SD of 3 independent replicates. Remdesivir, 5 µM; Juglone, 4 µM; 16F16, 2 µM; JG40, 5 µM; JG345, 5 µM; Nimbolide, 1 µM. (c) Cells were infected as above and treated with the indicated drug combinations. JG40, 0, 2.5, 5 µM; Remdesivir, 0, 2.5, 5, 10 µM; Juglone, 0, 0.25, 0.5, 1 µM; Nimbolide, 0, 0.25, 0.5, 1 µM; 16F16 0, 1, 2, 4 µM. Shown are means of 3 independent replicates. (d) Bliss synergy score for combined treatment with 16F16 and either JG40 or remdesivir. Higher values indicate synergistic effects.
Figure 4.
Figure 4.. Inefficient translation initiation on CoV2 gRNA.
(a) Pairwise comparisons of individual protein abundance in the heavy polysome fractions. Ribosomal proteins in blue, translation initiation factors in pink, and translation elongation factors in white circles. (b) Line plots of individual translation initiation factors quantified by MS in each fraction. Each line represents a single replicate. P, two-tailed Student’s t-test p-value. (c) CoV2 RNA interactome is enriched for translation initiation factors during infection. Shown are pairwise comparisons of individual host protein abundance, quantified by MS, that specifically interact with either genomic or subgenomic CoV2 RNA. Inset, cumulative distribution plots of 40S and 60S ribosomal protein interaction with CoV2 RNA. P, Mann-Whitney p-value. (d) rRNA absorbance profiles from Fig. 1D, showing lower abundance of free 40S subunits during CoV2 infection. (e) Heavy polysome fractions contain more 40S ribosomal proteins in infected cells. Shown are cumulative distribution plots of 40S and 60S ribosomal proteins in heavy polysome fractions from infected and uninfected cells, across three replicates. P, Mann-Whitney p-value. (f) Translation initiation from CoV2 5’ untranslated region (UTR) is less efficient than GAPDH 5’UTR. mRNA encoding for nano-luciferase (nLuc) flanked by 5’ and 3’UTRs of either CoV2 or GAPDH was transcribed in vitro, capped/polyadenylated, and transfected into Vero E6 cells. At 4 hours post-transfection, luminescence was measured in parallel with qPCR using oligonucleotides specific to nLuc. Shown are means±SD of 3 independent replicates.
Figure 5.
Figure 5.. Nsp1 promotes translation initiation on CoV2 gRNA.
(a) Line plots of individual viral proteins quantified by MS in each fraction. Each line represents a single replicate. (b) Vero E6 cells were transfected with plasmids encoding for individual CoV2 proteins. At 48 hours post-transfection, cells were transfected with nLuc mRNA flanked by either CoV2 or GAPDH UTRs. At 4 hours post-second transfection, cells were subjected to either luminescence measurements or sucrose gradients coupled to qPCR of nLuc mRNA. (c) nLuc luminescence. Shown are means±SD of 3 independent replicates. (d) Cells transfected as above, with either GFP or Nsp1 followed by GAPDH-nLuc or CoV2-nLuc mRNA, were lysed and fractionated on 10–50% sucrose gradients with continuous monitoring of rRNA. The content of nLuc mRNA in each fraction was determined by qPCR. Left, rRNA absorbance profiles. Right, percent of GAPDH-nLuc or CoV2-nLuc mRNA found in polysome fractions of sucrose gradients. Shown are qPCR measurements of 4 polysome fractions from 2 independent gradients. P, two-tailed Student’s t-test p-value.
Figure 6.
Figure 6.. Nsp1 promotes accurate start codon usage through eIF1A.
(a) Nsp1 interacts with translation initiation complexes enriched for specific initiation factors. Pairwise comparisons of individual protein abundance that, as quantified by MS, specifically interact with Nsp1 using a bioID proximity labeling approach. (b) Vero E6 cells were transfected with either non-targeting or eIF1A and eIF1-targeting siRNA. At 48h the same transfection was repeated. At 48h after the second transfection, cells were infected with CoV2 at MOI of either 0.1 (c) or 5 (d-f). Titer was determined by plaque assays. (c) Shown are means±SD of 3 independent replicates. Bottom, immunoblot of whole cell lysates transfected with the indicates siRNAs. (d) Infected cells were subjected to ribosome profiling analysis. Top, ribosome footprints on CoV2 vRNA. Insets, ribosome footprints on nucleotides 20–80 of the genomic vRNA. Representative of 2 independent replicates. Bottom, difference in ribosome occupancy at each codon between cells pre-transfected with either si-eIF1A or si-NT. (e) Ribosome occupancy at nucleotides 48–78 (top, upstream CUG codon) and 254–284 (bottom, main AUG). Summary of two independent replicates. P, Wilcoxon ranked-sum p-value. (f) Cumulative fraction plots of ribosome footprints on Orf1a/b (left) and Spike (right) vRNA. Summary of two independent replicates. P, Wilcoxon ranked-sum p-value. (g) Vero E6 cells were transfected with either si-eIF1A or si-NT. At 48h, cells were retransfected with same siRNA and plasmids encoding for either GFP or Nsp1. 48h later, cells were transfected again with nLuc mRNA flanked with either CoV2 or GAPDH UTRs. Luminescence was measured at 4h. Shown are means±SD of 3 independent replicates.

References

    1. Kumar N. et al. Host-Directed Antiviral Therapy. Clin Microbiol Rev 33, (2020). - PMC - PubMed
    1. Rozman B., Fisher T. & Stern-Ginossar N. Translation—A tug of war during viral infection. Mol Cell (2022) doi:10.1016/j.molcel.2022.10.012. - DOI - PubMed
    1. Aviner R. & Frydman J. Proteostasis in Viral Infection: Unfolding the Complex Virus–Chaperone Interplay. Cold Spring Harb Perspect Biol 12, a034090 (2020). - PMC - PubMed
    1. Gordon D. E. et al. A SARS-CoV-2 protein interaction map reveals targets for drug repurposing. Nature 583, 459–468 (2020). - PMC - PubMed
    1. White K. M. et al. Plitidepsin has potent preclinical efficacy against SARS-CoV-2 by targeting the host protein eEF1A. Science (1979) 371, 926–931 (2021). - PMC - PubMed

Publication types