[Preprint]. 2023 Jul 3:2023.07.03.547560.
doi: 10.1101/2023.07.03.547560.

Movement-related modulation in mouse auditory cortex is widespread yet locally diverse

Affiliations

Movement-related modulation in mouse auditory cortex is widespread yet locally diverse

Karin Morandell et al. bioRxiv. .

Update in

Abstract

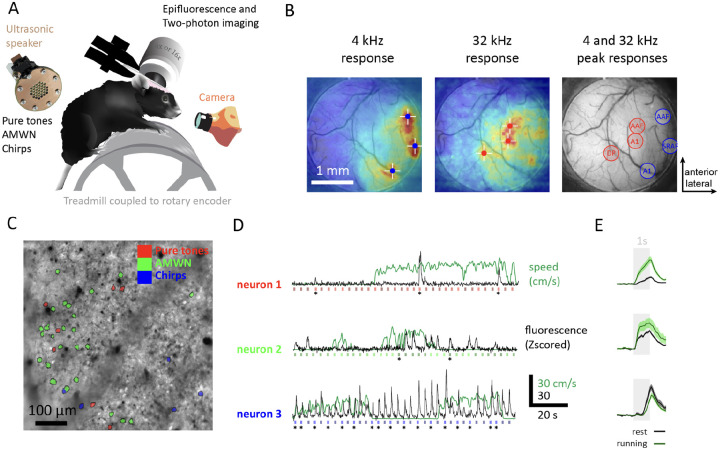
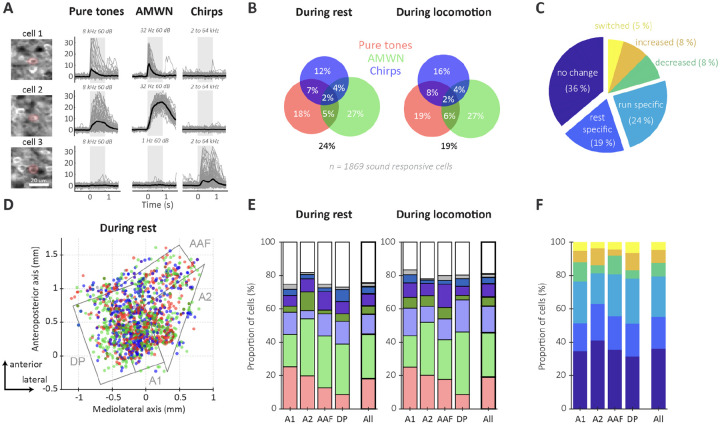
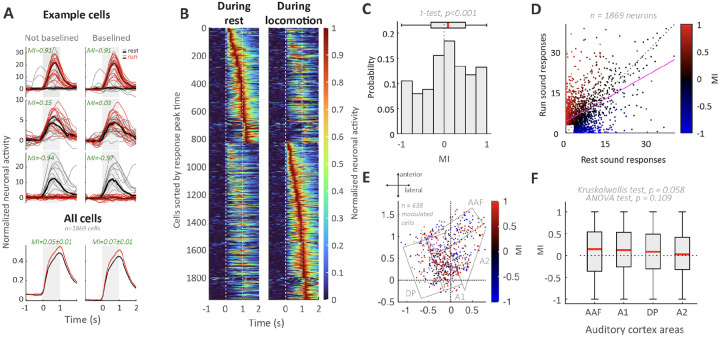
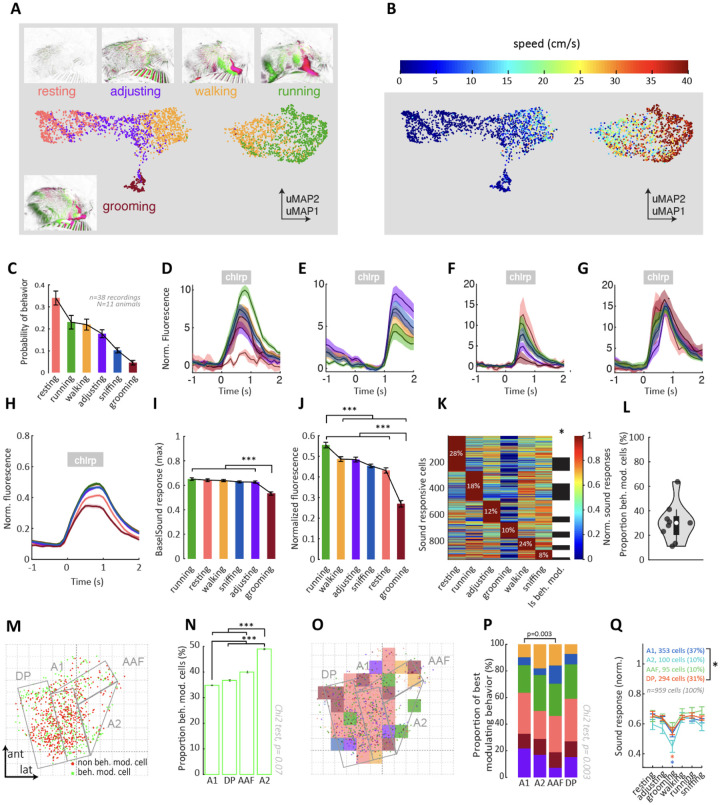
Neurons in the mouse auditory cortex are strongly influenced by behavior, including both suppression and enhancement of sound-evoked responses during movement. The mouse auditory cortex comprises multiple fields with different roles in sound processing and distinct connectivity to movement-related centers of the brain. Here, we asked whether movement-related modulation might differ across auditory cortical fields, thereby contributing to the heterogeneity of movement-related modulation at the single-cell level. We used wide-field calcium imaging to identify distinct cortical fields followed by cellular-resolution two-photon calcium imaging to visualize the activity of layer 2/3 excitatory neurons within each field. We measured each neuron's responses to three sound categories (pure tones, chirps, and amplitude modulated white noise) as mice rested and ran on a non-motorized treadmill. We found that individual neurons in each cortical field typically respond to just one sound category. Some neurons are only active during rest and others during locomotion, and those that are responsive across conditions retain their sound-category tuning. The effects of locomotion on sound-evoked responses vary at the single-cell level, with both suppression and enhancement of neural responses, and the net modulatory effect of locomotion is largely conserved across cortical fields. Movement-related modulation in auditory cortex also reflects more complex behavioral patterns, including instantaneous running speed and non-locomotor movements such as grooming and postural adjustments, with similar patterns seen across all auditory cortical fields. Our findings underscore the complexity of movement-related modulation throughout the mouse auditory cortex and indicate that movement-related modulation is a widespread phenomenon.


Figures

Fig.1:
Fig.1:. Mapping AC areas and cellular imaging of AC neurons during rest and locomotion across sound types
A. Schematic of the experimental setup used to map auditory cortex (AC) areas and conduct cellular imaging of AC neurons during rest and locomotion across different sound types. The setup involves a headfixed mouse running on a treadmill while sounds, such as pure tones, amplitude-modulated white noise (AMWN), and chirps, are delivered through an ultrasonic speaker. High-speed videos are recorded using a camera, and speed is measured through a rotary encoder attached to the treadmill. Auditory cortex images are acquired either through a 4X objective for epifluorescence AC mapping or a 16X objective for two-photon imaging through a 3 mm glass window. B. Epifluorescence auditory cortex mapping. Left and center, example epifluorence average sound responses to 4 and 32 kHz pure tones. White crossed show peaks. Right, peak 4 kHz and 32 kHz responses are represented by blue and red circles, respectively. C. Example two-photon field of view enhanced image, with sound responsive neurons being highlighted. The preferred sound type of each neuron is represented by colors in the legend. D. Example neuronal calcium and speed signals of 3 neurons. Calcium normalized fluorescence traces are represented in black and sound type, time and duration are represented by colored rectangles. Asterix represents preferred sound stimulus. Green line represents speed in cm/s. E. Peri-stimulus time histogram (PSTH) showcasing the example neurons individual preferred average and standard error sound responses during rest (black line) and running (green line) conditions. Sound timing is represented by a gray rectangle.
Fig.2:
Fig.2:. L2/3 neurons preferably respond to one type of sound and behavioral state but their preferences do not cluster spatially.
A. Example sound responses. Left, Highlighted imaged layer 2/3 cells. Right, Fluorescence responses to sound (gray shade). Pure tone, amplitude modulated white noise (AMWN) and chirp responses are represented in consecutive columns. Black traces represent the average. Gray lines represent individual trials. B. Venn diagrams illustrating the proportions of neurons that respond to sounds during rest and locomotion for different sound types. C. Pie chart summarizing sound-type specificity changes between rest and locomotion states. The chart categorizes the neurons into four groups based on their responsiveness: those that show no difference in responsiveness, those that are exclusively responsive during rest or running conditions, and those that change their responsiveness during locomotion. The neurons in the last category can either increase or decrease the number of sound types they respond to or switch their selectivity to another sound type. D. Map of auditory cortex cells sound class preference shown as colored dots. The color of the dots uses the same color code as in B. Auditory fields are delineated in gray. The map is aligned to the 4 kHz A1 epifluorescence sound response. E. Sound type preference broken down by area. Color code is the same as in B. Chi-Square test revealed that the proportions of sound class preferences were significantly different during rest (p < 0.001), but not during locomotion (p > 0.05). F. Specificity change broken down by area. Color code is the same as in C.
Fig.3:
Fig.3:. Running increases auditory cortex sound responses similarly across areas.
A. Example (top rows) and average (bottom) sound responses in resting and running condition. Running modulation indexes (MI) are reported in green. Each sound lasted 1 second and is represented by a gray shade. B. Heatmap illustrating individual normalized sound responses during rest (left) and locomotion (right). Start and end times of sound are delineated by the white dotted lines. C. Distribution of modulation indexes with boxplot and red line indicating the median and quartiles of the distribution. T-test significance indicates a slightly positive population modulation index. D. Neuronal sound responses under rest and running conditions, with each dot representing a neuron and the color indicating its modulation index (MI). Small sound responses were excluded (see Methods). The dotted line represents the unity line, while the pink line shows the linear regression fit. E. Spatial organization of running modulated cells illustrated as MI map with each dot representing a significantly modulated cell. Significance was determined as sound responses in rest and running being significantly different. Grey lines delineate auditory cortex areas. F. Area-specific modulation indexes reported by boxplot (median and quartiles). Significance test reported in gray.
Fig.4:
Fig.4:. Auditory cortex contains speed-modulated neurons.
A. Average trial speed relationship to modulation index (MI) shown as boxplots for various trial speed bins. Significance test reported in gray. B. Influence of recording variables on neuronal modulation index, as computed by the effect size (ω2,see Methods). Error bars represent 95% confidence intervals of the effect size. C. Running speed decoding accuracy map of the auditory cortex. Circles represent neurons and their colors, how accurate speed decoding was for that recording session, as shown in the color bar. The black edge on the circle indicates that decoding of the speed of this recording was significant (SVM permutation test, see Methods). Gray lines delineated auditory cortex areas. D. Bar plot of average speed decoding accuracy for individual areas of the auditory cortex. E. Example cells’ sound responses modulated diversely by speed. The top row shows sound responses, with each line representing a trial and the color representing the trial speed. Gray background box represents sound timing. The bottom row shows the relationship between speed and sound response size. Data are fitted by functions denoted in the legend. F. Scatter plot of all neurons (dots) showing the goodness of the fit (measured by R2), the fitting p-value, and the best fit shown by the color of the dots (legend in E). Significance alpha is symbolized by a dotted line at p=0.05. Black dots represent neurons with no significant fit. G. Bar plot quantifying the proportions of neurons’ best fits among linear, exponential (exp), step-function (step), and logarithmic (log). The pie chart summarizes the proportion of speed-modulated cells. H. Bar plot showing the proportion of speed-modulated cells across individual areas of the auditory cortex.
Fig.5:
Fig.5:. Auditory cortex sound response modulation depends on the type of movement.
A. Example labeled session presented as a uMAP plot, where motion-frames are dots and color-coded based on behavioral labels, such as resting, grooming, adjusting, walking, and running. Example motion-frames highlight motion in the previous frame in magenta and the next frame in green (see Methods). B. Similar to A, the uMAP plot displays motion-frames colored by running speed. C. Bar plot representing behavioral occurrences measured as the proportion of labeled frames. D to G. Example sound responses of neurons that are modulated differently by behaviors. H. Population average sound responses across different behaviors. I. Bar plot illustrating the size of sound responses (baseline subtracted) across different behaviors. Two-way analysis of variance revealed a significant main effect of areas (ANOVA, p<0.001) J. Bar plot depicting neuronal activity across different behaviors (sound responses non baseline subtracted), including both the baseline activity and the activity during sound responses. Two-way analysis of variance revealed a significant main effect of areas (ANOVA, p<0.001) K. Heat map displaying the activity of auditory cortex neurons under different conditions. Neurons are sorted based on their maximum sound response size, and the percentage of neurons with maximum responses is indicated in white. The last column of the heat map indicates whether neurons are differentially modulated by behaviors. The color represents the normalized neuronal response, as shown in the color bar. The color represents the normalized neuronal response, as shown in the color bar. The last column of the heat map indicates whether neurons are differentially modulated by behaviors (white = yes). L. Violin plot showing the proportion of behaviorally modulated neurons across multiple mice. M. Spatial distribution of cells that are differentially modulated by behaviors (green dots) compared to cells that are not influenced differentially by behaviors (red dots). The dashed lines indicate the reference point of A1 at 4 kHz, against which the maps are aligned. N. Bar plot quantifying the proportion of behaviorally modulated cells in each auditory cortex area. Bootstrapping analysis shows that the proportion of behaviorally modulated cells in A1 and A2 significantly differ from other areas (ANOVA, p<0.001, post hoc Tukey-Kramer with Bonferroni correction). Error bars represent 99% confidence intervals of bootstrapping distributions. O. Spatial distribution of behaviorally modulated cells depicted by dots. Dot colors represent the best sound response conditions. In the background, a density plot shows the most common best sound response condition in a square of 200 μm. Gray lines delineate the limits of the areas of the auditory cortex. P. Bar plot presenting the proportions of preferred behavioral conditions in each auditory cortex area. Significant difference between proportion of favorite modulation between areas was revealed by performing a Chi-Square test (p = 0.003). Q. Error bar plot showing normalized sound responses across different behaviors and auditory cortex areas. Two-way analysis of variance revealed a significant main effect of behaviors and areas (ANOVA, post hoc Tukey’s HSD with Bonferroni correction, pAreas<0.001, pBehaviors<0.001, pInteraction>0.05).

References

    1. Audette Nicholas J., Zhou Wenxi, La Chioma Alessandro, and Schneider David M.. 2022. “Precise Movement-Based Predictions in the Mouse Auditory Cortex.” Current Biology: CB 32 (22): 4925–40.e6. - PMC - PubMed
    1. Bigelow James, Morrill Ryan J., Dekloe Jefferson, and Hasenstaub Andrea R.. 2019. “Movement and VIP Interneuron Activation Differentially Modulate Encoding in Mouse Auditory Cortex.” eNeuro 6 (5). 10.1523/ENEURO.0164-19.2019. - DOI - PMC - PubMed
    1. Brainard D. H. 1997. “The Psychophysics Toolbox.” Spatial Vision 10 (4): 433–36. - PubMed
    1. Gămănuţ Răzvan, Kennedy Henry, Toroczkai Zoltán, Mária Ercsey-Ravasz David C. Van Essen, Knoblauch Kenneth, and Burkhalter Andreas. 2018. “The Mouse Cortical Connectome, Characterized by an Ultra-Dense Cortical Graph, Maintains Specificity by Distinct Connectivity Profiles.” Neuron 97 (3): 698–715.e10. - PMC - PubMed
    1. Henschke Julia U., Price Alan T., and Pakan Janelle M. P.. 2021. “Enhanced Modulation of Cell-Type Specific Neuronal Responses in Mouse Dorsal Auditory Field during Locomotion.” Cell Calcium 96 (June): 102390. - PubMed

Publication types