[Preprint]. 2023 Jul 7:2023.07.05.547814.
doi: 10.1101/2023.07.05.547814.

Microglia-derived TGF-β1 ligand maintains microglia homeostasis via autocrine mechanism and is critical for normal cognitive function in adult mouse brain

Affiliations

Microglia-derived TGF-β1 ligand maintains microglia homeostasis via autocrine mechanism and is critical for normal cognitive function in adult mouse brain

Alicia Bedolla et al. bioRxiv. .

Update in

Abstract

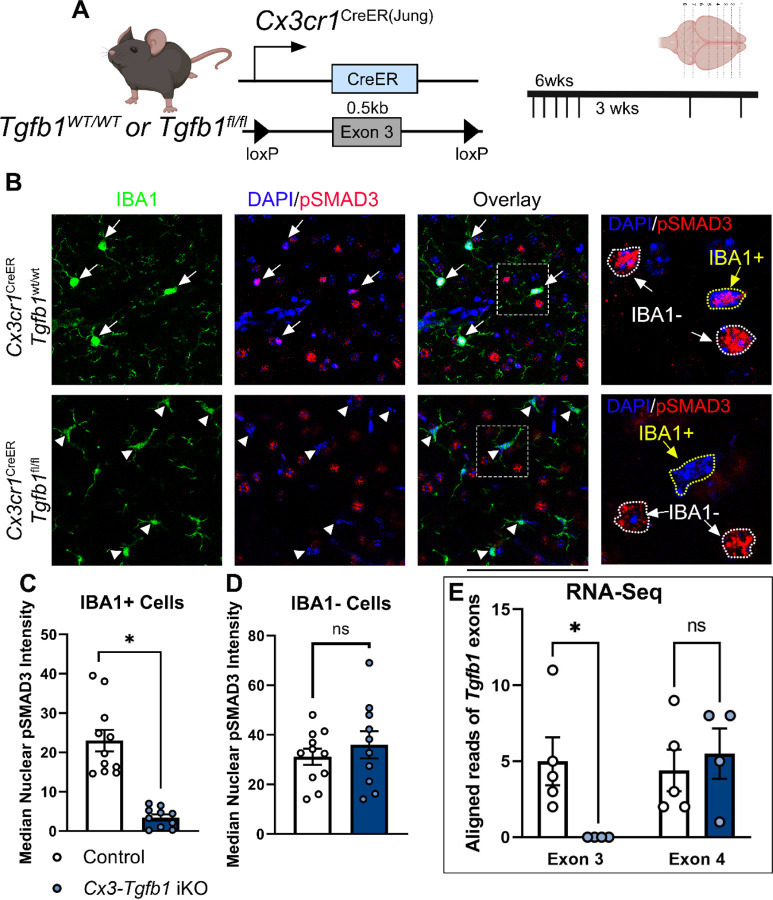
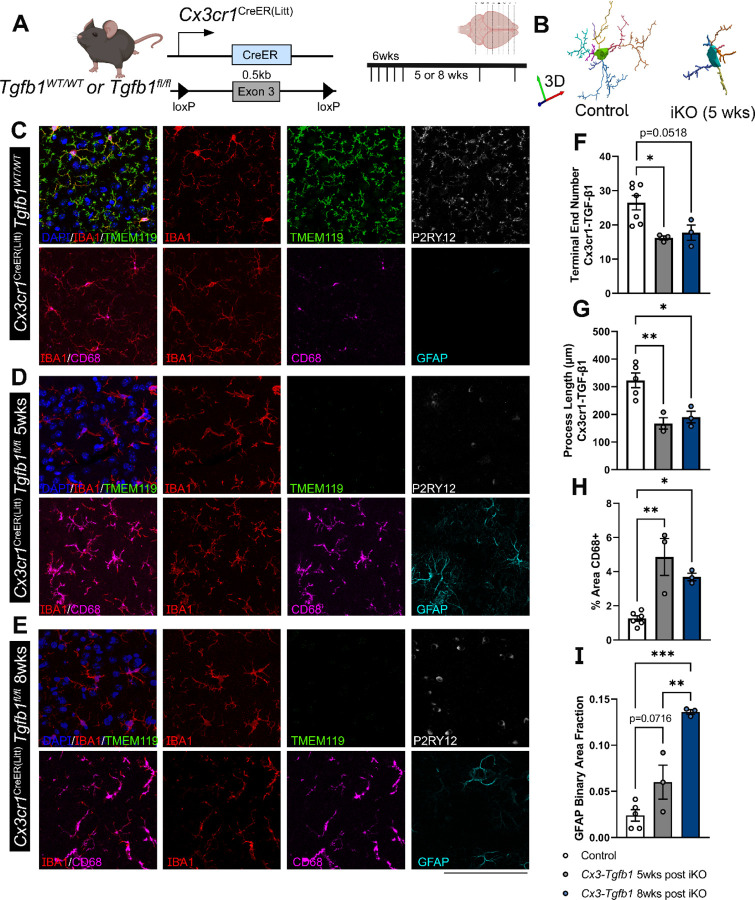
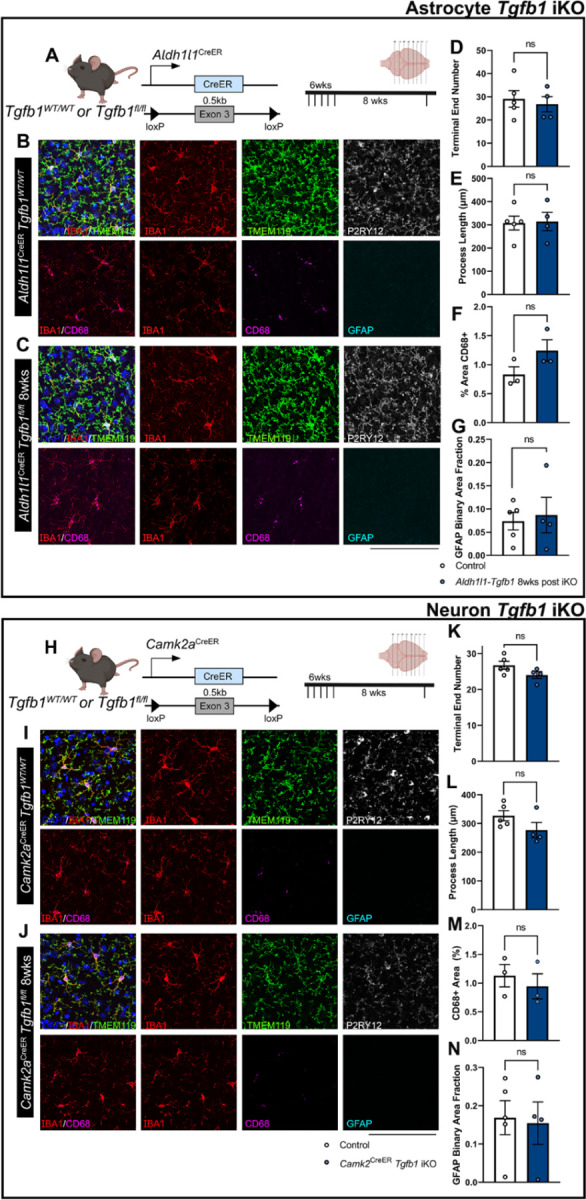
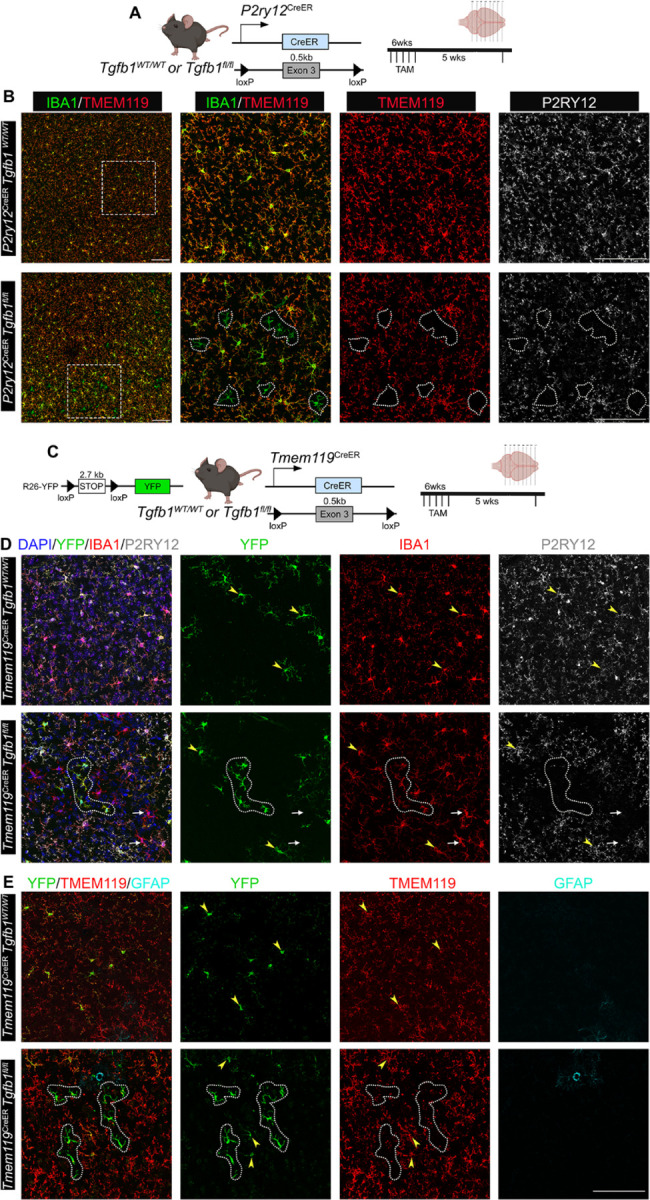
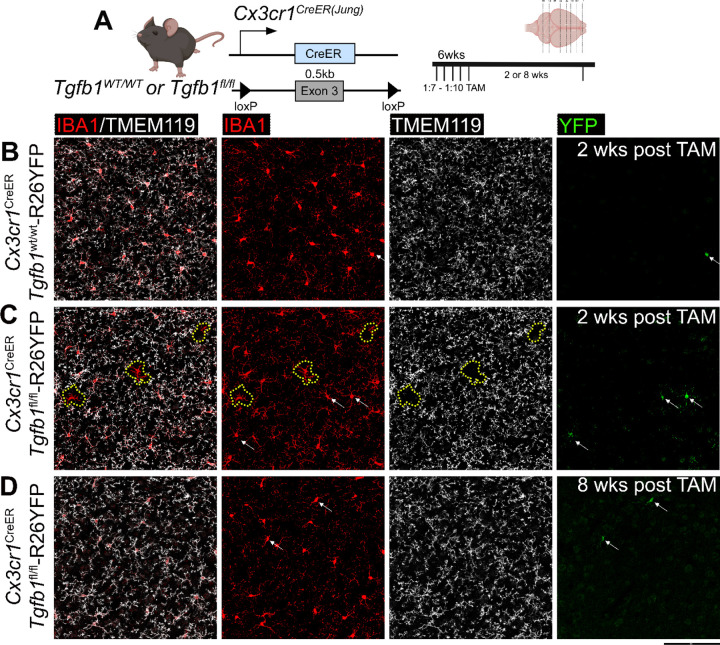
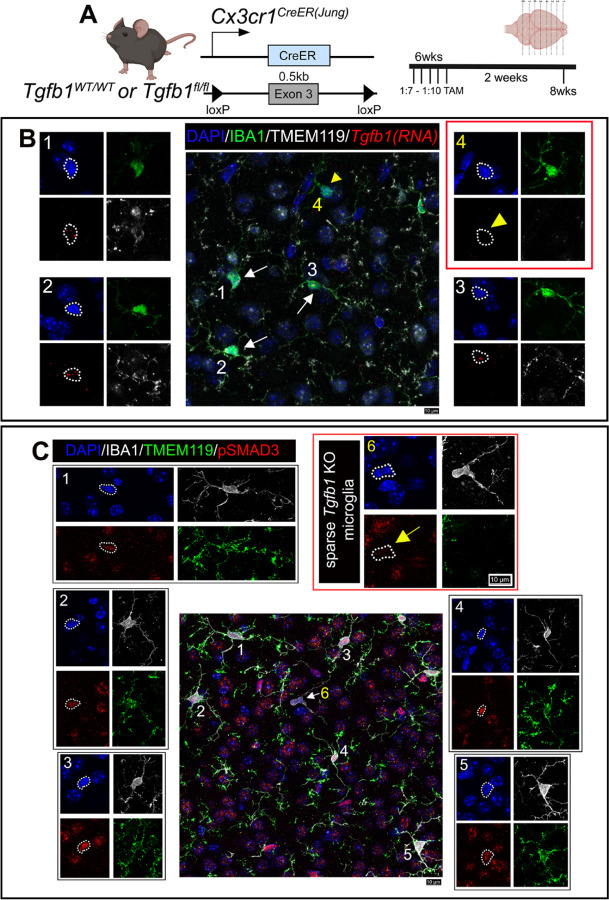
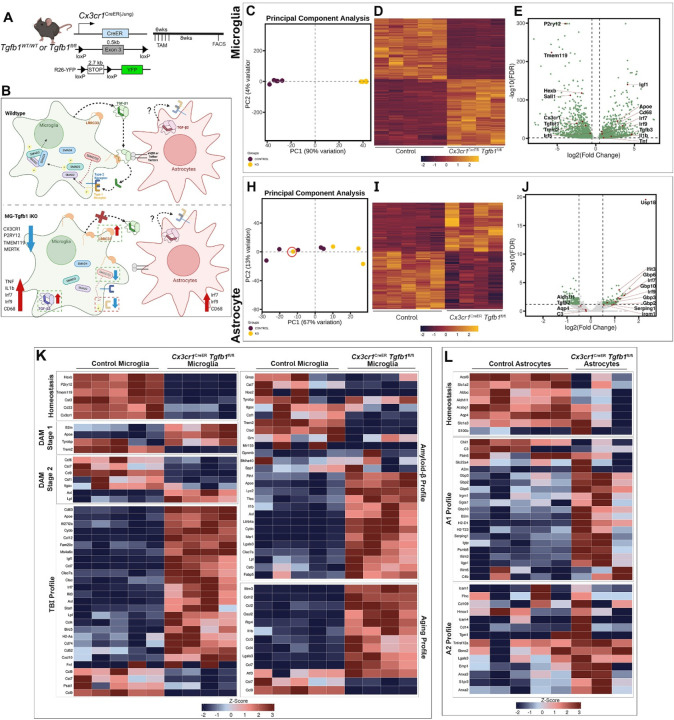
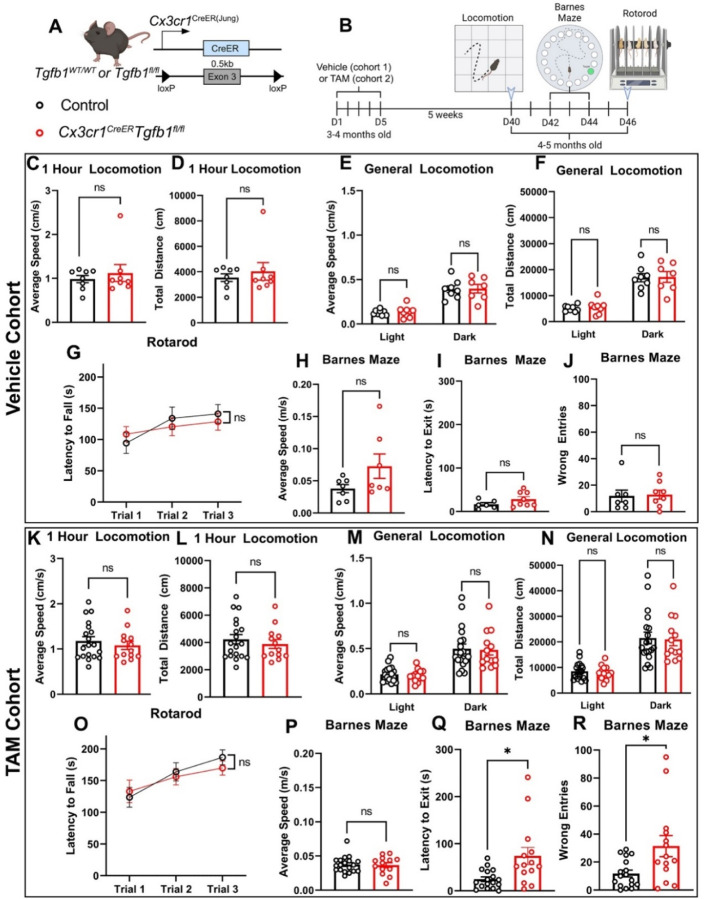
While TGF-β signaling is essential for microglial function, the cellular source of TGF-β ligand and its spatial regulation remains unclear in the adult CNS. Our data support that microglia, not astrocytes or neurons, are the primary producers of TGF-β1 ligands needed for microglial homeostasis. Microglia (MG)-Tgfb1 inducible knockout (iKO) leads to the activation of microglia featuring a dyshomeostatic transcriptomic profile that resembles disease-associated microglia (DAMs), injury-associated microglia, and aged microglia, suggesting that microglial self-produced TGF-β1 ligands are important in the adult CNS. Interestingly, astrocytes in MG-Tgfb1 iKO mice show a transcriptome profile that closely aligns with A1-like astrocytes. Additionally, using sparse mosaic single-cell microglia iKO of TGF-β1 ligand, we established an autocrine mechanism for TGF-β signaling. Importantly MG-Tgfb1 iKO mice show cognitive deficits, supporting that precise spatial regulation of TGF-β1 ligand derived from microglia is critical for the maintenance of brain homeostasis and normal cognitive function in the adult brain.

Keywords: DAMs; Microglia; TGF-beta; aging; astrocytes; cognitive deficit.


Conflict of interest statement

Declaration of interests The authors declare no competing interests.

Figures

Figure 1.
Figure 1.. Validation of loss of Tgfb1 loxP-flanked exon 3 in microglial mRNA and the TGF-β downstream signaling effector (pSMAD3) in Cx3cr1CreER(Jung)Tgfb1fl/fl iKO mice following tamoxifen administration.
(A) Mouse model used and experimental timeline. (B) Representative IHC showing pSMAD3, IBA1, and DAPI in control animals and iKO animals. (C,D) Quantification of pSMAD3 nuclear immunoreactivity median intensity in both IBA1+ cells (C) and IBA1− cells (D). (E) Based on RNAseq analysis of sorted MG from Control or Cx3cr1CreER(Jung)Tgfb1fl/fl iKO mice, aligned reads that matched to exon3 (the loxP-flanked exon) or exon4 (the exon downstream of the floxed exon) show that exon 3 is significantly lower in MG-Tgfb1 iKO microglia compared to control microglia while exon 4 is unaffected. Mean±SE, * = p<0.05. Student’s t-test. Scale bar = 100µm. SMAD3 bar graphs show individual image averages, however statistics were carried out using the average cell intensity for a single animal (control n=4, iKO n=3). RNA-seq graph shows a single data point per animal.
Figure 2.
Figure 2.. Microglia-specific Tgfb1 gene deletion results in loss of homeostasis of microglia and in increased reactive astrocytes in cortex of the adult mouse brain.
(A) Mouse model for targeting microglial Tgfb1 and timeline. (B) 3D reconstruction of control and iKO microglia. Representative immunohistochemistry images of IBA1, TMEM119, P2RY12, CD68, and GFAP in the cortex of (C) Control animals, (D) Cx3cr1CreER(Litt)Tgfb1fl/fl knockouts 5 weeks after tamoxifen administration, and (E) Cx3cr1CreER (Litt)Tgfb1fl/fl knockouts 8 weeks after tamoxifen administration. Quantification of (F) total microglial process length, (G) microglial process terminal end numbers, (H) % of CD68 immunoreactive positive area, and (I) GFAP immunoreactive positive area fraction. Mean±SE, * = p<0.05, ** = p<0.01, *** = P<0.001. Student’s t-test. ( > 40 microglia were quantified for each animal and the average from one mouse was plotted as a single data point in the figure panel and treated as n=1 for statistical analysis). Scale bar = 100µm.
Figure 3.
Figure 3.. Astrocyte-specific or forebrain neuronal specific Tgfb1 gene deletion in the Aldh1l1CreER or Camk2aCreER drivers does not affect the homeostasis of microglia or GFAP expression in astrocytes in adult mouse brain (cortex).
(A) Astrocyte iKO mouse model and experimental timeline. (B, C) Representative immunohistochemistry images of cortex from TAM treated (8 weeks post) control (B) Aldh1l1CreERTgfb1wt/wt and (C) iKO Aldh1l1CreER Tgfb1fl/fl tissue showing IBA1, TMEM119, P2RY12, CD68, and GFAP immunostaining. Quantification of microglia ramification via (D) process terminal end numbers, (E) total process length, and (H) % of CD68+ immunoreactive area. (G) quantification of astrocyte reactivity using GFAP immunoreactive positive area fraction. (H) Neuronal iKO mouse model and experimental timeline. (I, J) Representative images of TAM treated (8 Weeks post) control Camk2aCreERTgfb1wt/wt (I) and iKO Camk2CreER Tgfb1fl/fl tissue showing IBA1, TMEM119, P2RY12, CD68, and GFAP immunoreactivity. Quantification of microglia ramification via (K) process terminal end number, (L) total process length, and (M) CD68+ immunoreactive % area. (N) Quantification of astrocyte reactivity using GFAP+ immunoreactive area fraction. Mean±SE ( > 40 microglia were quantified for each animal and the average from one mouse was plotted as a single data point in the figure panel and treated as n=1 for statistical analysis). ns=not significant., Scale bar = 100µm.
Figure 4.
Figure 4.. Mosaic deletion of Tgfb1 gene in subsets of parenchyma microglia in the P2ry12creER Tgfb1 fl/fl or the Tmem119CreERTgfb1fl/fl iKO mice leads to distinct patches of dyshomeostatic microglia in the adult mouse brain.
(A) P2ry12CreER mouse driver to induce Tgfb1 KO in P2RY12+ microglia and experimental timeline. We recently showed that these lines have a 50% decrease in exon3 of Tgfb1 mRNA in reporter positive microglia. (B) TAM treated (5 weeks post) Control and P2ry12CreERTgfb1 fl/fl iKO representative images showing immunohistochemistry for IBA1, TMEM119, and P2RY12. (C) Tmem119CreER mouse driver to induce tgfb1 KO in TMEM119+ microglia and experimental timeline. (D) TAM treated (5 weeks post) Control and Tmem119creERTgfb1 fl/fl iKO representative images showing immunohistochemistry for YFP, IBA1, P2RY12 and (E) YFP, TMEM119, and GFAP immunostaining. White dotted outlines indicate microglia with downregulated TMEM119 and/or P2RY12 expression. White arrows depict YFP− cells that also show loss of P2RY12 expression. Yellow arrowheads show YFP+ cells in either WT or iKO mice that still maintained P2RY12 or TMEM119 expression. Representative results from n=3–5 mice/group. Scale bar = 100µm.
Figure 5.
Figure 5.. Sparse Tgfb1 induced-knockout in individual adult microglia supports an autocrine mechanism of microglial TGF-β ligand production and signaling regulation.
(A) Mouse model used to induce Tgfb1 KO in mosaic sparse individual microglia and experimental timeline depicting titrated dose of tamoxifen. (B-D) Representative images showing IBA1, TMEM119, and YFP expression and co-localization in control tissue at 2 weeks post tamoxifen (B) and sparse iKO tissue at 2 weeks (C) showing loss of TMEM119 expression in sparse individual microglia and (D) reversal of TMEM119 expression in the sparse Tgfb1 iKO brain at 8 weeks post tamoxifen. The yellow dotted outline in (C) highlights singular microglia showing loss of homeostatic TMEM119 expression. White arrows highlight YFP+ cells showing no loss of homeostatic TMEM119 expression. Note that at this low dosage of TAM, the recombination of individual floxed alleles (R26-YFP reporter or the floxed Tgfb1 gene) occurs independently of each other, therefore YFP+ cells do not always indicate a sparse Tgfb1 KO microglia, consistent with our recent study. Representative results from n=3–5 mice/group from different cohorts of TAM treatment. Scale bar = 100µm.
Figure 6.
Figure 6.. In-situ RNA-scope and IHC double labeling confirm loss of Tgfb1 RNA and downregulation of TGF-β downstream signaling (pSMAD3) in dyshomeostatic individual microglia in the sparse Tgfb1 iKO model.
(A) The mouse model used to examine sparse iKO in microglia and experimental timeline with TAM dosage. (B) Representative image showing combined immunohistochemistry staining (for IBA1, TMEM119, DAPI) and Tgfb1 RNA-scope hybridization. (B1–3) Surrounding normal microglia showing TMEM119 expression and Tgfb1 RNA presence. (B4) A single microglia cell with loss of TMEM119 expression and loss of Tgfb1 mRNA. White arrows were used to mark normal cells in the central panel. Yellow arrowhead used to mark individual iKO microglia. Note that tissue treatment for RNAscope analysis makes the IHC condition less ideal for morphology evaluation than regular IHC staining, however, IBA1 and TMEM119 expression are still distinguishable for individual WT or iKO microglia. (C) Representative image showing co-immunohistochemical staining with DAPI, IBA1, TMEM119, and pSMAD3. (C1–5) Surrounding normal microglia showing TMEM119 expression and pSMAD3 immunostaining. (C6) A single microglia cell with loss of TMEM119 expression and loss of pSMAD3 labeling. The yellow arrow (microglia #6) marks the individual iKO microglia. Representative results from n=3 iKO mice. Scale bar = 10µm. For additional representative images see Supplementary Figs 10 and 11.
Figure 7.
Figure 7.. Transcriptomic analysis of microglia and astrocyte cells sorted from Cx3Cr1CreER(Jung)Tgfb1fl/fl mice.
(A) Mouse model used to induce Tgfb1 KO and YFP reporter in microglia. (B) Summary of transcriptomic changes in microglia or astrocytes pertaining to both inflammatory responses and critical TGF-β signaling component genes. (C, H) PCA analysis plot of microglia and astrocyte samples. Note that one astrocyte sample from iKO mice clustered irregularly in the PCA plot which has an RNA Integrity Number (RIN) below 8 (red circle). (D, I) Heatmap of expression of significantly differentially expressed genes in microglia and astrocytes from control and iKO samples. (E, J) Volcano plot showing expression log fold changes. (K) Microglial differential gene expression observed across various gene sets including, homeostatic microglia genes, stage 1 and 2 disease-associated microglia (DAM) genes, injury exposed microglial (TBI), amyloid beta exposed microglia,,, and aged microglia,. (L) Astrocytic differential gene expression was observed across different gene sets including, homeostatic astrocyte genes, A1, and A2 genes. Z-scores were calculated and plotted to display differential gene expression. The astrocyte sample that had an RIN< 8 was excluded from this analysis.
Figure 8.
Figure 8.. Behavioral assessment of full dosage Veh or TAM treated Cx3cr1CreERTgfb1wt/wt or Cx3cr1CreERTgfb1fl/fl mice to evaluate general motor function, motor coordination and learning, and learning and memory.
(A) Mouse model used to induce Tgfb1 KO in microglia. (B) Experimental timeline, showing the order of behavioral measurements. (C-J) Behavioral measurements in vehicle-treated Cx3cr1CreERTgfb1wt/wt or Cx3cr1CreERTgfb1fl/fl mice showing open field test (OFT) of the first hour in locomotion chamber (C) average speed and (D) total distance traveled. (E,F) average speed and total distance during the light and dark cycles in a 23-hour period. G) Accelerated rotarod learning test. (H-J) Barnes maze test showing (H) average speed during testing (I) latency to locating the target hole and (J) number of error trails before locating the target hole. (n=8 for each group). (K-R) Behavioral measurements from TAM-treated control and iKO mice showing open field test (OFT) of the first hour in locomotion chamber (K) average speed and (L) total distance traveled. (M, N) average speed and total distance during the light and dark cycles in a 23-hour period. (O) Accelerated rotarod learning test. (P-R) Barnes maze test showing (P) average speed during testing (Q) latency to locating the target hole and (R) number of error trails before locating the target hole. (control n=19, iKO n=13) (ns=not significant, * p<0.05, Student’s t-test)

Similar articles

References

    1. Paolicelli R. C. et al. Synaptic pruning by microglia is necessary for normal brain development. Science 333, 1456–1458 (2011). - PubMed
    1. Carroll J. A., Race B., Williams K., Striebel J. F. & Chesebro B. Innate immune responses after stimulation with Toll-like receptor agonists in ex vivo microglial cultures and an in vivo model using mice with reduced microglia. J Neuroinflammation 18, 194 (2021). - PMC - PubMed
    1. Sierra A. et al. Microglia shape adult hippocampal neurogenesis through apoptosis-coupled phagocytosis. Cell Stem Cell 7, 483–495 (2010). - PMC - PubMed
    1. Nimmerjahn A., Kirchhoff F. & Helmchen F. Resting microglial cells are highly dynamic surveillants of brain parenchyma in vivo. Science 308, 1314–1318 (2005). - PubMed
    1. Hu X. et al. Microglia/macrophage polarization dynamics reveal novel mechanism of injury expansion after focal cerebral ischemia. Stroke 43, 3063–3070 (2012). - PubMed

Publication types