[Preprint]. 2023 Jul 3:2023.06.29.23291992.
doi: 10.1101/2023.06.29.23291992.

Exome-wide evidence of compound heterozygous effects across common phenotypes in the UK Biobank

Affiliations

Exome-wide evidence of compound heterozygous effects across common phenotypes in the UK Biobank

Frederik H Lassen et al. medRxiv. .

Update in

Abstract

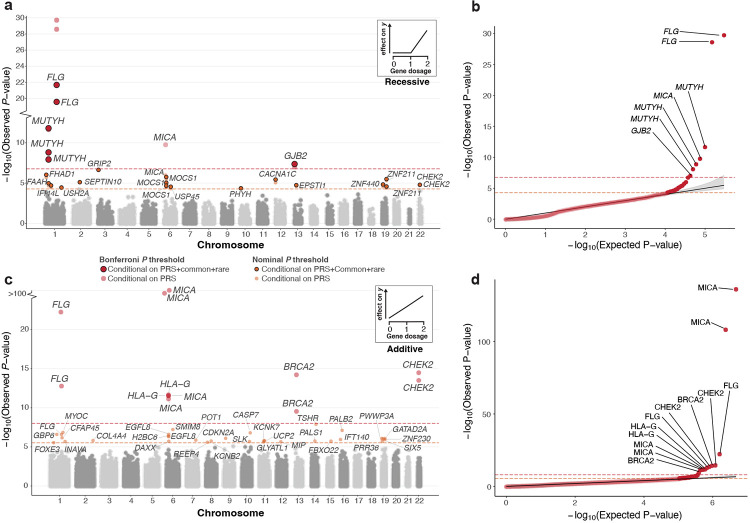
Exome-sequencing association studies have successfully linked rare protein-coding variation to risk of thousands of diseases. However, the relationship between rare deleterious compound heterozygous (CH) variation and their phenotypic impact has not been fully investigated. Here, we leverage advances in statistical phasing to accurately phase rare variants (MAF ~ 0.001%) in exome sequencing data from 175,587 UK Biobank (UKBB) participants, which we then systematically annotate to identify putatively deleterious CH coding variation. We show that 6.5% of individuals carry such damaging variants in the CH state, with 90% of variants occurring at MAF < 0.34%. Using a logistic mixed model framework, systematically accounting for relatedness, polygenic risk, nearby common variants, and rare variant burden, we investigate recessive effects in common complex diseases. We find six exome-wide significant (P<1.68×10⁻⁷) and 17 nominally significant (P<5.25×10⁻⁵) gene-trait associations. Among these, only four would have been identified without accounting for CH variation in the gene. We further incorporate age-at-diagnosis information from primary care electronic health records, to show that genetic phase influences lifetime risk of disease across 20 gene-trait combinations (FDR < 5%). Using a permutation approach, we find evidence for genetic phase contributing to disease susceptibility for a collection of gene-trait pairs, including FLG-asthma (P=0.00205) and USH2A-visual impairment (P=0.0084). Taken together, we demonstrate the utility of phasing large-scale genetic sequencing cohorts for robust identification of the phenome-wide consequences of compound heterozygosity.


Figures

Fig. 1:
Fig. 1:. CH variants composed of at least one ultra-rare variant (MAC ≤ 10) can be robustly identified in large scale biobanks.
a) Trio SER depicted on y-axis as a function of MAC bin (x-axis) for phased variants with MAF ≤ 5%, stratified by phasing confidence score PP ≥ 0.5 or PP ≥ 0.9. b) Counts of samples harboring different classes of variation with at least two variants in UKBB. Each set of three bars depicts the number of individuals with at least one CH variant, homozygous variant, or multi-hit (cis) variant, respectively. Here, we define a CH pLoF+damaging missense variant as any combination of pLoF and/or damaging missense variation on opposite haplotypes. A qualifying carrier for each bar occurs according to the configuration displayed above the bars, and is grouped by variant consequence according to the color legend. c-d) Number of CH or homozygous carriers per gene. e) 1 - cumulative fraction (y-axis) of homozygous (dashed line) and CH carriers as a function of lowest MAF (x-axis) in bi-allelic variant pairs for which both variants phased at PP ≥ 0.9 (solid line), stratified by variant consequence according to the color key.
Fig. 2:
Fig. 2:. Conditional recessive and additive modeling of gene copy disruption in 311 phenotypes across 176,587 participants.
a) Recessive Manhattan plot depicting log10-transformed gene-trait association P-values against chromosomal location. Associations are colored red or orange based on whether they are Bonferroni (P<1.68×10⁷) or nominally (P<5.25×10⁵) significant. Transparent coloring represents the resulting P-value when conditioning only on PRS, whereas solid coloring with black outline represents the P-value derived after conditioning on off-chromosome PRS, nearby (500 kb) common variant association signal, and rare variants within the gene when applicable (methods). The Bonferroni and nominal significance thresholds are also displayed as orange and red dashed lines respectively. A gene may appear multiple times if it is associated with more than one phenotype. A qualifying example of the recessive inheritance pattern is shown in the top right: disruption of both gene copies result in an effect on the phenotype (y). b) QQ-plot for genes with bi-allelic damaging variants after conditioning on off chromosome PRS. The shaded area depicts the 95%CI under the null. Gene-trait associations passing Bonferroni significance are labeled accordingly. c-d) Additive Manhattan plot and corresponding QQ-plot for genes with mono and bi-allelic damaging variants associated with at least one phenotype after conditioning on off chromosome PRS when applicable (methods). No additional conditioning was performed in this analysis. Gene-trait associations are colored red and orange based on whether they are respectively Bonferroni (P<9.8×10⁹) or nominally (P<3.05×10⁶) significant. The additive inheritance model is depicted in the top right: each affected haplotype result in a incremental effect on the phenotype (y).
Fig. 3:
Fig. 3:. In-silico permutation of genetic phase provides evidence for CH-specific effects.
a) Overview of the permutation pipeline. To be sufficiently powered to detect effects, we considered five significant (P<0.01) gene-trait pairs from the genome-wide analysis that have at least ten individuals harboring pLoF or damaging missense/protein-altering variants on the same haplotypes or CH carriers. Then, we shuffled CH trans and cis labels across samples and re-ran the association analysis, resulting in a null distribution of permuted t-statistics corresponding to the association strength in the absence of phase information. We derive the one-tailed empirical P-value by comparing the observed t-statistics with the empirical null distribution. b) The resulting distributions of permuted (white and black box plots) and observed t-statistic (red dot) for each gene-trait and the resulting empirical P-value. P-values shown in bold indicate Bonferroni significance (P<0.0505=0.01). Box and whisker plots display the quartiles of the empirical null distribution.
Fig. 4:
Fig. 4:. Age-at-diagnosis modeling reveals novel recessive effects driven by damaging bi-allelic variants.
a) Flow diagram of our approach. To investigate whether homozygous and/or CH effects are associated with a difference in lifetime risk of disease development, we perform Cox proportional-hazards modeling for gene-trait combinations in which ≥ 5 samples are two-hit carriers (CH or homozygotes) and ≥ 100 samples that are heterozygotes. Among Bonferroni significant associations (P<1.89×10⁷), we filter to gene-trait pairs for which at least five samples carry multiple variants disrupting the same haplotype, and test for an association between CH or homozygous carrier status and lifetime disease risk (corresponding to HRs>1). b) HRs when comparing CH and homozygous status versus heterozygous carrier status. Throughout, we display hazard ratios and corresponding P-values with (circles) and without (triangles) taking the polygenic contribution into account by conditioning on off-chromosome PRSs for heritable traits that pass our quality control cutoffs. P-values following inclusion of polygenic contribution to disease status are provided where PRS are predictive. HRs for gene-traits with two or more individuals with multiple cis variants on the same haplotype are displayed in pink. Associations that pass Bonferroni significance (P<1.89×10⁷) and FDRs < 5% cutoff are illustrated in the top and bottom respectively. c) HRs when comparing bi-allelic status versus heterozygous carrier status for gene-trait pairs with ≥ 3 individuals harboring variants disrupting the same haplotype, allowing ascertainment of confidence intervals. c) HRs when comparing wildtype, heterozygous, CH and homozygous status against individuals that harbor two damaging variants on the same haplotype. 95% CIs are shown in the figure. Abbreviations: CC (colorectal cancer), COPD (chronic obstructive pulmonary disease).
Fig. 5:
Fig. 5:. Trajectories of haplotype disruption in common disease.
a-b) Kaplan-Meier survival curves for CH (red), homozygous (orange), heterozygous carriers (blue), single disruption of haplotypes (pink) owed to pLoF or damaging missense/protein-altering mutations. Wildtypes and bi-allelic variants (CH or homozygous) are shown with green and black lines respectively. Both CH and homozygous MUTYH-variant carriers are at elevated lifetime risk of developing benign neoplasm of the colon compared to heterozygous carriers and wildtypes. c-d) Kaplan-Meier survival curves for ATP2C2 mono and bi-allelic variant carriers. Carriers of CH variants develop COPD more early compared to heterozygotes carriers and wildtypes. Moreover, individuals who harbor a single putatively disrupted haplotype owed to ≥2 damaging variants develop COPD at the same frequency as heterozygotes and wildtypes. e) Gene plots for ATP2C2, displaying protein coding variants for samples that carry ≥ 2 pLoF or damaging missense/protein-altering variants stratified by exon or intron. CH variants, multiple variants in cis, and homozygous variants are highlighted by lines joining the positions of co-occurring variants in a sample. Lines are colored by number of cases for the shown variant configurations, with gray lines indicating no observed samples are cases; orange lines indicating some some samples are cases; red lines indicate that all observed samples are cases. Variants are labeled by position (GRCh38) and according to inferred consequence (missense, stop gain, splice acceptor/donor). Protein domains are highlighted accordingly.

References

    1. Nelson M. R., Tipney H., Painter J. L., et al. The support of human genetic evidence for approved drug indications. en. Nature Genetics 47, 856–860 (Aug. 2015). - PubMed
    1. Plenge R. M., Scolnick E. M. & Altshuler D. Validating therapeutic targets through human genetics. en. Nature Reviews Drug Discovery 12. Number: 8 Publisher: Nature Publishing Group, 581–594 (Aug. 2013). - PubMed
    1. Whiffin N., Armean I. M., Kleinman A., et al. The effect of LRRK2 loss-of-function variants in humans. en. Nature Medicine 26, 869–877 (June 2020). - PMC - PubMed
    1. Tobert J. A. Lovastatin and beyond: the history of the HMG-CoA reductase inhibitors. en. Nature Reviews Drug Discovery 2. Number: 7 Publisher: Nature Publishing Group, 517–526 (July 2003). - PubMed
    1. Do R. Q., Vogel R. A. & Schwartz G. G. PCSK9 Inhibitors: potential in cardiovascular therapeutics. eng. Current Cardiology Reports 15, 345 (Mar. 2013). - PubMed

Publication types