[Preprint]. 2023 Jul 6:rs.3.rs-3117313.
doi: 10.21203/rs.3.rs-3117313/v1.

Cancer Prevalence Across Vertebrates

Affiliations

Cancer Prevalence Across Vertebrates

Zachary T Compton et al. Res Sq. .

Update in

  • Cancer Prevalence across Vertebrates.
    Compton ZT, Mellon W, Harris VK, Rupp S, Mallo D, Kapsetaki SE, Wilmot M, Kennington R, Noble K, Baciu C, Ramirez LN, Peraza A, Martins B, Sudhakar S, Aksoy S, Furukawa G, Vincze O, Giraudeau M, Duke EG, Spiro S, Flach E, Davidson H, Li CI, Zehnder A, Graham TA, Troan BV, Harrison TM, Tollis M, Schiffman JD, Aktipis CA, Abegglen LM, Maley CC, Boddy AM. Compton ZT, et al. Cancer Discov. 2025 Jan 13;15(1):227-244. doi: 10.1158/2159-8290.CD-24-0573. Cancer Discov. 2025. PMID: 39445720 Free PMC article.

Abstract

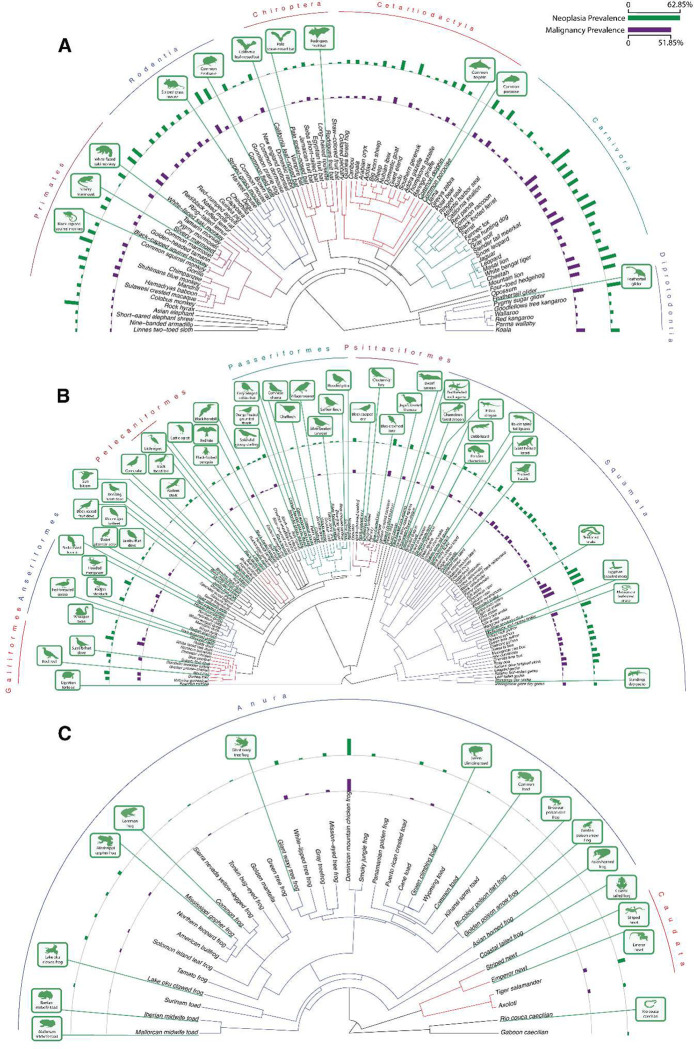
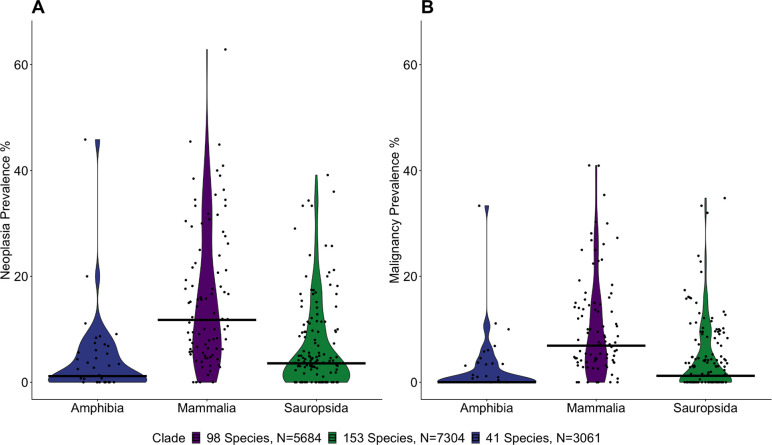
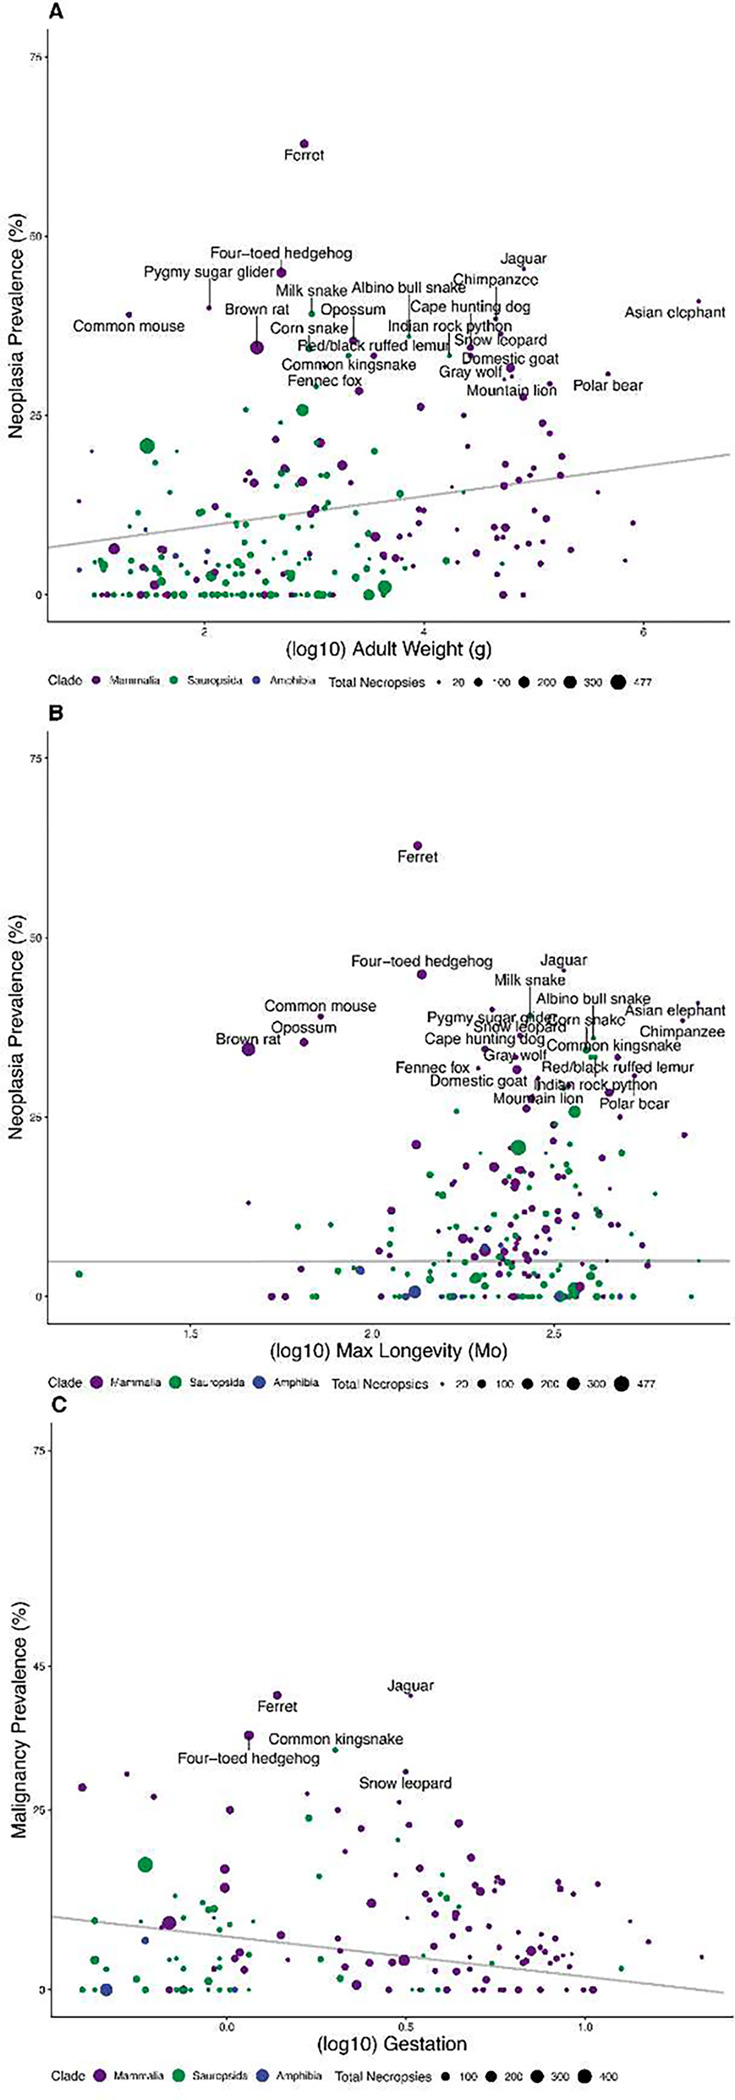
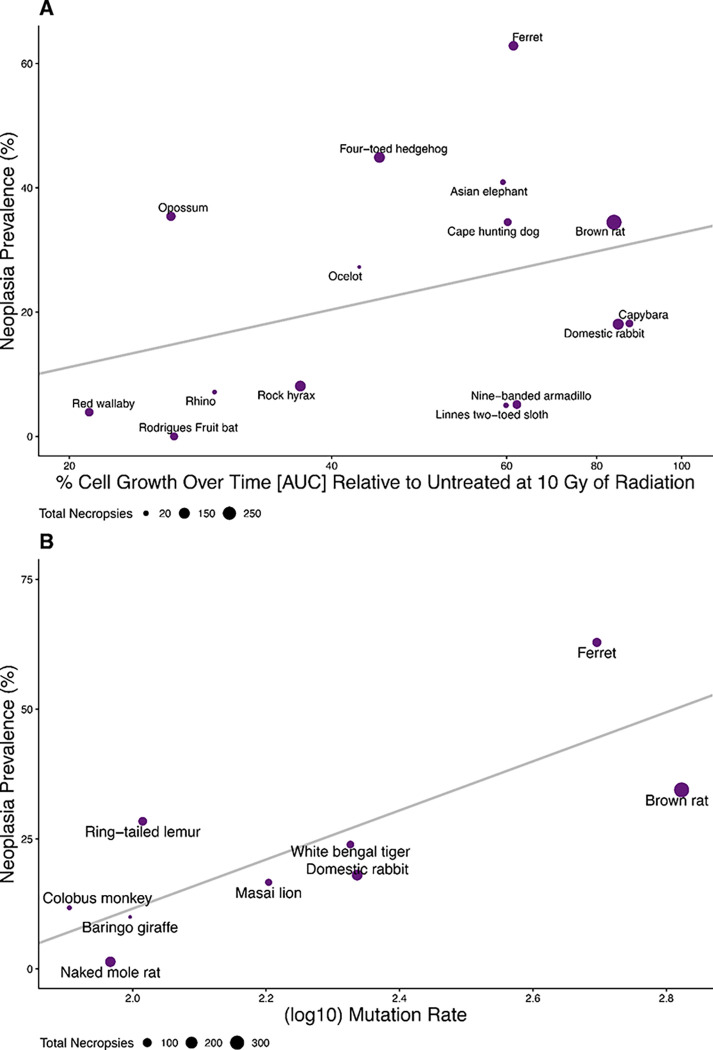
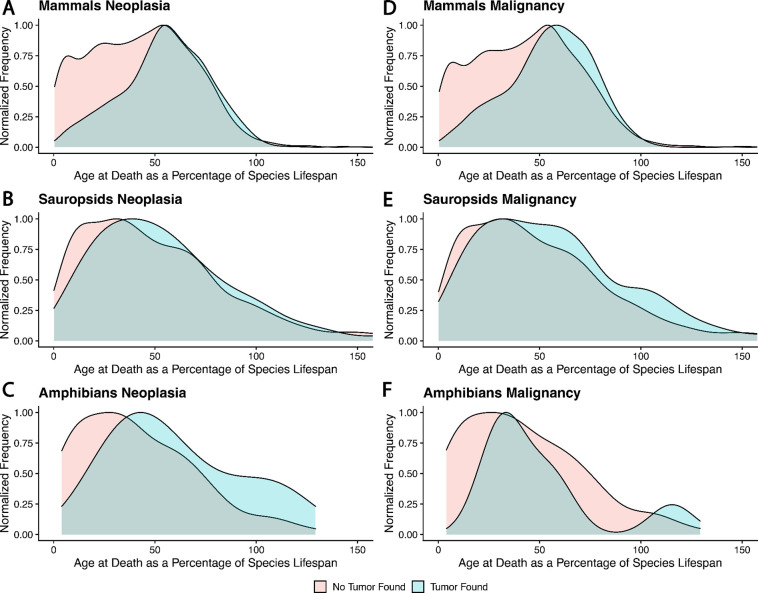
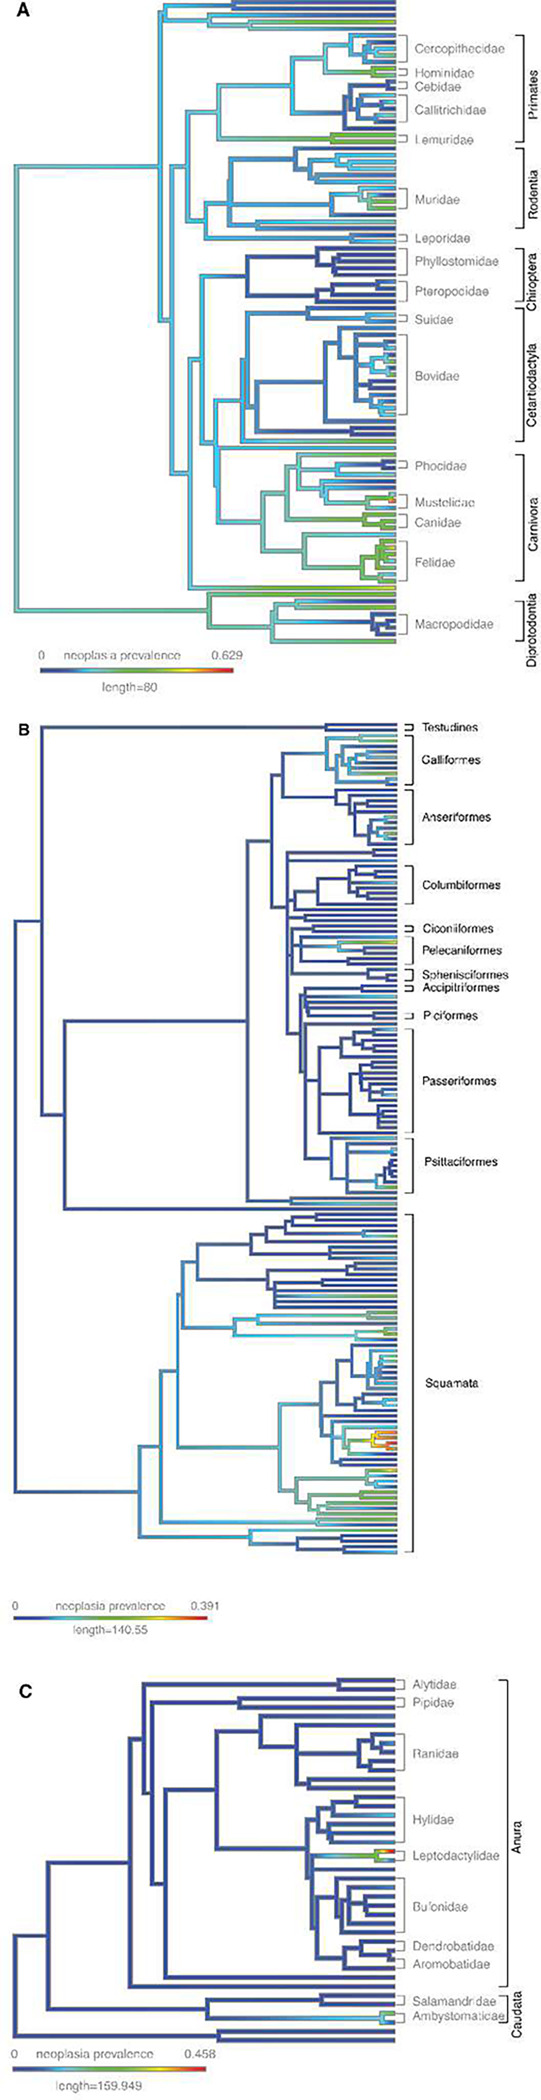
Cancer is pervasive across multicellular species, but what explains differences in cancer prevalence across species? Using 16,049 necropsy records for 292 species spanning three clades (amphibians, sauropsids and mammals) we found that neoplasia and malignancy prevalence increases with adult weight (contrary to Peto's Paradox) and somatic mutation rate, but decreases with gestation time. Evolution of cancer susceptibility appears to have undergone sudden shifts followed by stabilizing selection. Outliers for neoplasia prevalence include the common porpoise (<1.3%), the Rodrigues fruit bat (<1.6%) the black-footed penguin (<0.4%), ferrets (63%) and opossums (35%). Discovering why some species have particularly high or low levels of cancer may lead to a better understanding of cancer syndromes and novel strategies for the management and prevention of cancer.


Conflict of interest statement

Competing interests: JDS is co-founder, shareholder, and employed by Peel Therapeutics, Inc., a company developing evolution-inspired medicines based on cancer resistance in elephants. LMA is share-holder and consultant to Peel Therapeutics, Inc. The other authors declare that they have no competing interests (ZTC, VKH, WM, SR, DM, SEK, MW, RK, KN, CB, LR, AP, BM, SS, SA, GF, OV, MG, EGD, SS, EF, HD, AZ, TAG, BT, TMH, MT, AA, AMB, CCM)

Figures

Fig. 1.
Fig. 1.
Neoplasia and malignancy prevalence across mammals (A), sauropsids (B), and amphibians (C). Silhouetted species indicated that zero neoplasms were reported.
Fig. 2.
Fig. 2.
Distributions of of A. neoplasia (Kruskal-Wallace test: p = 2.906 × 10⁻¹²) and B. malignancy (Kruskal-Wallace test: p = 6.519 × 10⁻¹¹) prevalences are different across three clades, Amphibia, Mammalia, and Sauropsida (Reptilia and Aves). Dots show the estimated species neoplasia prevalence and bars show the median for the clade. Neoplasia and malignancy prevalence for species were calculated by the proportion of the reported lesions among the total number of necropsies for that species.
Fig. 3.
Fig. 3.
Significant life history factors associated with neoplasia and malignancy prevalence. A. Larger organisms have a higher neoplasia prevalence than smaller organisms (2.1% neoplasia per Log10g adult body mass, p = 0.007, R2 = 0.18, λ = 0.46). B. Longer lived organisms also have more neoplasia (0.01% neoplasia per Log10 month lifespan, p = 0.02, R2 = 0.16, λ = 0.34). C. Organisms with longer gestation times have a lower malignancy prevalence (−5.65% malignancies per Log10 months, p = 0.02, R2 = 0.01, λ = 0.41). When controlling for adult body mass, organisms with longer gestation times also have fewer neoplasias at death (−5.30% neoplasia per Log10 months, p = 0.1).
Fig. 4.
Fig. 4.
A. % Cell Growth Over Time [AUC] Relative to Untreated at 10 Gy of Radiation (plotted and analyzed on a Log10 scale) as a predictor of neoplasia prevalence in species’ fibroblast cell lines. (30.89% neoplasia per Log10 Cell Count Area Change, p = 0.22, R2 = 0.011, λ = 6.6 × 10⁻⁵) B. Log10 Mean Mutation Rate as a predictor of neoplasia prevalence (47.26% per single base substitution per genome per year, p = 0.0059, R2 = 0.96, λ = 1.00).
Fig. 5.
Fig. 5.
The density distribution of ages at death in animals with neoplasia versus non-neoplasia, adjusted for each species’ lifespan as specified in PanTHERIA. While the distributions of ages at death are different between necropsies showing neoplasia versus those that don’t (Two Sample Kolmogorov-Smirnov Test: Mammals: D=0.11, p =1.81 × 10⁻⁶; Sauropsids: D= 0.18, p = 4.48 × 10⁻⁸; Amphibians: D=0.5, p = 0.011), we found few neoplasias that could be explained by an organism living an extraordinarily long time in captivity, except in amphibians.
Fig. 6.
Fig. 6.
Cladogram depiction of cancer incidence within A. Mammals, B. Sauropsids, and C. Amphibians. Cladograms with the species labels at each tip can be found in Suppl. Fig. 63. Heat map coloration indicates relative prevalence of cancer within each branch, illustrating the diversity of neoplastic disease amongst closely related species. The scale is the same for each panel so that the differences between the clades are apparent.

References

    1. Aktipis C. A. et al. Cancer across the tree of life: cooperation and cheating in multicellularity. Philos. Trans. R. Soc. Lond. B Biol. Sci. 370, (2015). - PMC - PubMed
    1. Ahmad F. B. & Anderson R. N. The Leading Causes of Death in the US for 2020. JAMA 325, 1829–1830 (2021). - PMC - PubMed
    1. Daignan-Fornier B., Laporte D. & Sagot I. Quiescence Through the Prism of Evolution. Front Cell Dev Biol 9, 745069 (2021). - PMC - PubMed
    1. Kirk D. L. A twelve-step program for evolving multicellularity and a division of labor. Bioessays 27, 299–310 (2005). - PubMed
    1. Nedelcu A. M. The evolution of multicellularity and cancer: views and paradigms. Biochem. Soc. Trans. 48, 1505–1518 (2020). - PubMed

Publication types

LinkOut - more resources