[Preprint]. 2023 Jul 5:rs.3.rs-3105966.
doi: 10.21203/rs.3.rs-3105966/v1.

The acid-sensing nociceptor TRPV1 controls breast cancer progression in bone via regulating HGF secretion from sensory neurons

Affiliations

The acid-sensing nociceptor TRPV1 controls breast cancer progression in bone via regulating HGF secretion from sensory neurons

Tatsuo Okui et al. Res Sq. .

Abstract

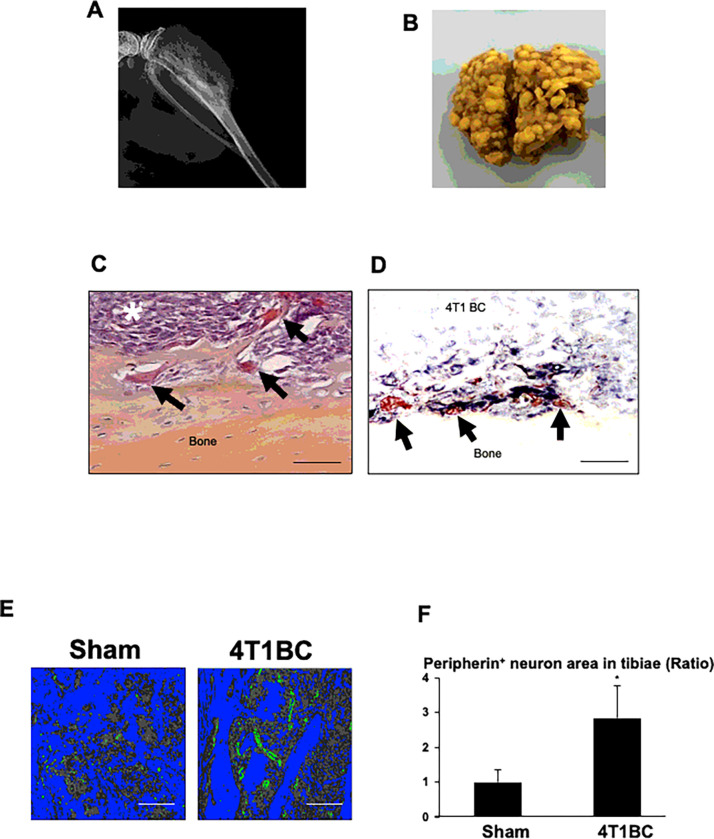
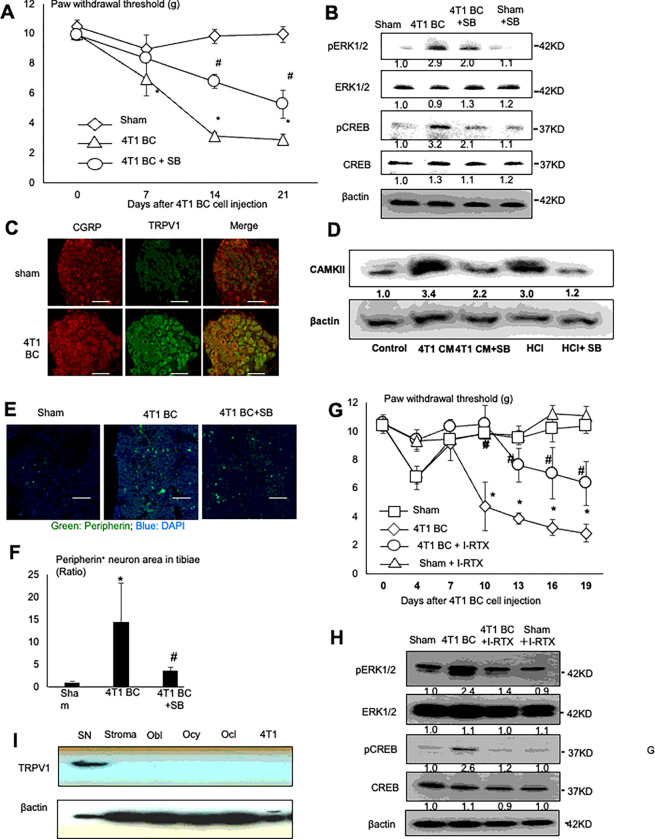
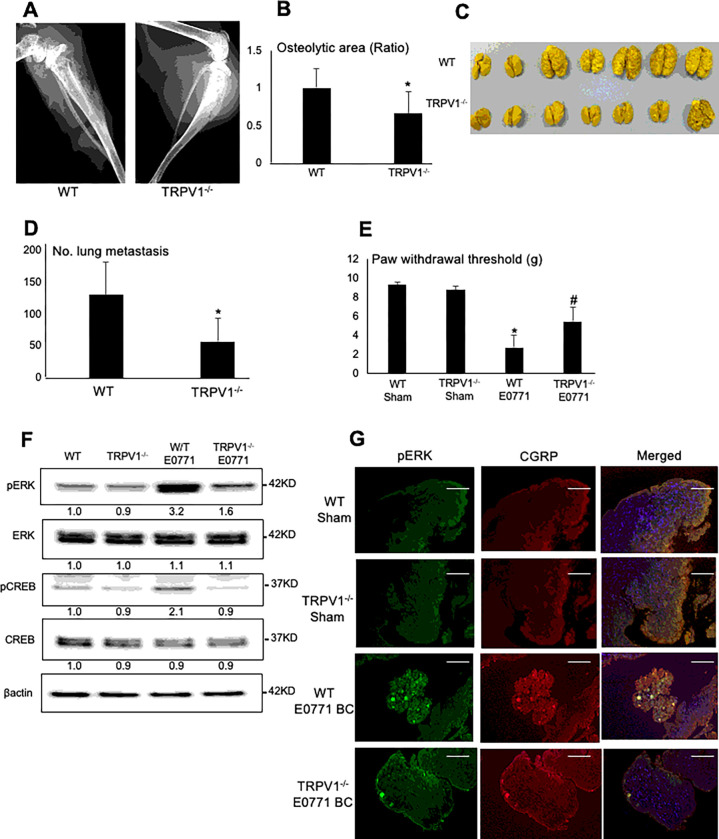
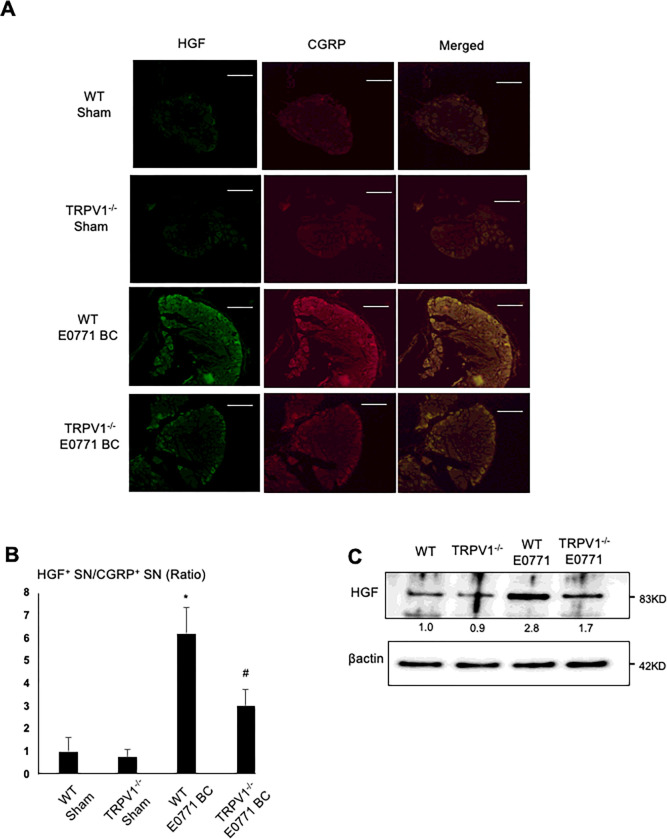
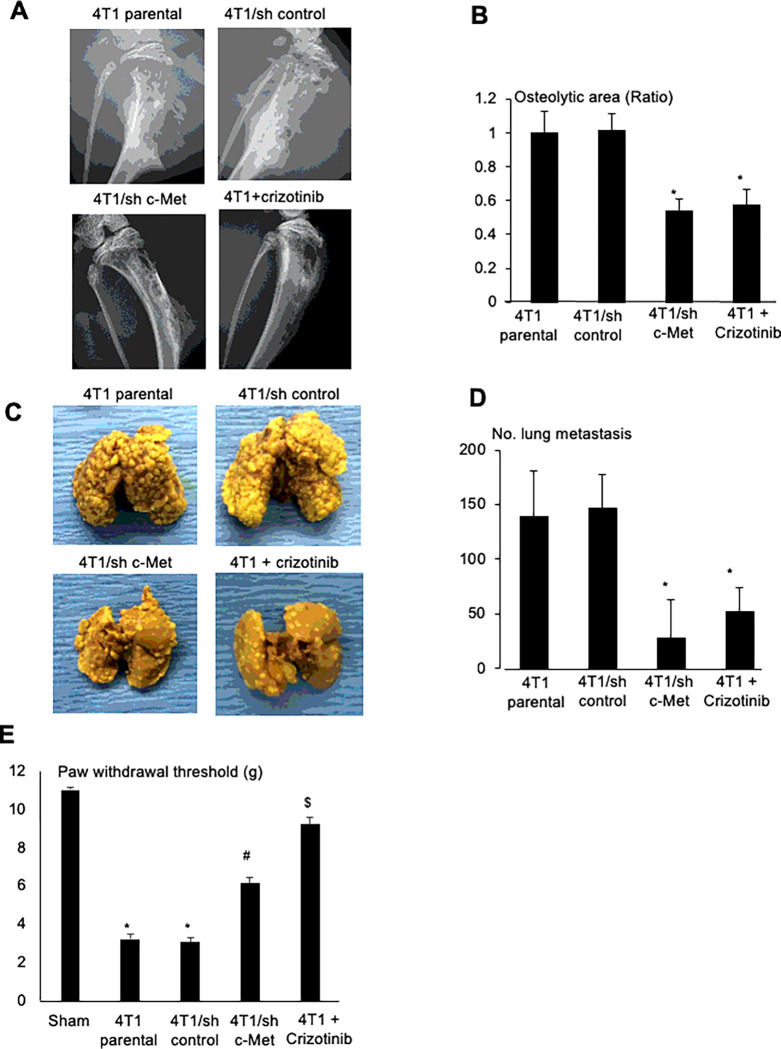
Cancers showing excessive innervation of sensory neurons (SN) in their microenvironments are associated with poor outcomes due to promoted growth, increased tumor recurrence, metastasis, and cancer pain, suggesting SNs play a regulatory role in cancer aggressiveness. Using a preclinical model in which mouse 4T1 breast cancer (BC) cells were injected into the bone marrow of tibiae, we found 4T1 BC cells aggressively colonized bone with bone destruction and subsequently spread to the lung. Of note, 4T1 BC colonization induced the acidic tumor microenvironment in bone in which SNs showed increased innervation and excitation with elevated expression of the acid-sensing nociceptor transient receptor potential vanilloid-1 (TRPV1), eliciting bone pain (BP) assessed by mechanical hypersensitivity. Further, these excited SNs produced increased hepatocyte growth factor (HGF). Importantly, the administration of synthetic and natural TRPV1 antagonists and genetic deletion of TRPV1 decreased HGF production in SNs and inhibited 4T1 BC colonization in bone, pulmonary metastasis from bone, and BP induction. Our results suggest the TRPV1 of SNs promotes BC colonization in bone and lung metastasis via up-regulating HGF production in SNs. The SN TRPV1 may be a novel therapeutic target for BC growing in the acidic bone microenvironment and for BP.


Figures

Figure 1
Figure 1. Increased innervation of SNs associated with 4T1 BC colonization in tibiae.
A. Radiograph of osteolytic lesions associated with 4T1 BC colonization in tibiae taken at day 21 prior to sacrifice under general anesthesia. B. Macroscopic view of lung metastasis of 4T1 BC in the same mice as 1A. C. Histology of tibiae colonized by 4T1 BC cells (white asterisk). Bone-resorbing osteoclasts are seen at the endosteal surface of tibiae (black arrows). Tibiae were harvested at day 21 after sacrifice. Scale bar=100μm. D. Spatial interactions of peripherin+ SNs (black) with 4T1 BC cells and osteoclasts (red) in tibiae colonized by 4T1 BC. Sections were incubated with a primary anti-peripherin antibody (1:1,000) overnight at 4°C and then streptavidin-biotin complex, EnVision horse radish peroxidase (HRP) for 60 min and visualized using a nickel 3,3-diaminobenzidine (DAB) substrate-chromogen solution, and subsequently double-stained with tartrate-resistant acid phosphatase (TRAP) for osteoclasts using a TRACP & ALP double-stain Kit (Takara Bio, and analyzed using Magnafire 4.1 software with the IX70 microscope (Olympus). Scale bar=100μm. E. Peripherin+ SNs (green) in tibiae injected with or without (sham) 4T1 BC cells. Tibiae were harvested at day 21 and sections were immunofluorostained with a primary anti-peripherin antibody as described in Figure 1D and counterstained with DAPI. Bones and bone marrow are seen in blue and grey by image binarization using Image J, respectively. Scale bar=200μm. F. Quantitative analysis of Figure 1E. Peripherin+ area in the whole histological section of tibiae of sham and the 4T1 mice was determined under a fluorescent microscope using Neuron J. Three histological sections randomly selected were used for quantitation. Ratio represents the area of peripherin+ SNs in tibiae of 4T1 BC mice/the area of peripherin+ SNs in tibiae of sham mice x 1. Data are shown as mean ± SD (N=3). *p<0.05 vs sham mice.
Figure 2
Figure 2. Role of TRPV1 in the sprouting and excitation of SNs, and the induction of BCIBP in the 4T1 BC mice
A. Progression of BCIBP assessed by the hind-paw mechanical allodynia by the von Frey test in tibiae of sham and the 4T1 BC mice treated with or without a selective synthetic TRPV1 antagonist, SB366791 (500 μg/kg, ip, once a day from day 6 to 20). The force by which mice withdraw their hind-paw is shown on Y-axis as paw withdrawal thresholds (g) in the figure. Mice with BCIBP in tibiae show decreased paw withdrawal threshold. Data are shown as mean ± SD (N=5). *p<0.05 vs sham mice. #p<0.05 vs untreated 4T1 BC mice. B. Expression of pERK1/2 and pCREB, two molecular markers for SN excitation, in lumbar DRGs of sham and the 4T1 BC mice treated with or without SB366791. Lumbar (L3-L5) DRGs were harvested from mice of each treatment group after sacrifice at day 21 and subjected to Western analysis. C. Co-expression of CGRP (left) and TRPV1 (center) on DRG SNs of the 4T1 BC mice. DRGs were harvested from sham and the 4T1 BC mice after sacrifice at day 21 and sections were immunofluorostained with a primary anti-CGRP (1:200) and anti-TRPV1 (1:1,000) antibody overnight at 4 C, and a secondary fluorescent-labeled antibody (1:100) for 60 min. Scale bar=50μm. D. Activation of TRPV1 signal pathway by 4T1 BC CM. Rat immortalized DRG SN cell line 50B11 was treated with 4T1 BC CM (30%, v/v), which is acidic (see Supplemental Figure 1B), or hydrochloric acid (HCl, pH 6.5) as positive control in the absence or presence of SB366791 (200 nM) for 30 min, lysed and subjected to Western analysis for the expression of Ca2+/calmodulin-dependent protein kinase II (CAMKII). E. Increased peripherin+ SNs (green) in tibiae of the 4T1 BC mice treated with or without SB366791. Tibiae were harvested from mice after sacrifice at day 21 and sections were immunofluorostained with a primary anti-peripherin antibody (1:1,000) and counterstained with DAPI (blue). Scale bar=200μm. F. Quantitative analysis of Figure 2E. Peripherin+ area in the whole histological section of tibiae of sham and the 4T1 mice was determined under a fluorescent microscope using Neuron J. Three histological sections randomly selected were used for quantitation. Ratio represents peripherin+ SN of 4T1 BC or 4T1 BC + SB366791/peripherin+ SN of sham mice x 1. Data are shown as mean ± SD (N=3). *p<0.05 vs sham mice. #p<0.05 vs untreated 4T1 BC mice. G. Effects of a selective natural antagonist of TRPV1, I-RTX (0.5 μmol/kg, ip, once a day from day 6 to 20) on BCIBP in the 4T1 BC mice. Mechanical allodynia of sham mice seen at day 4 was due to surgical trauma. Data are shown as mean ± SD (N=5). *p<0.05 vs sham mice. #p<0.05 vs untreated 4T1 BC mice. H. Effects of I-RTX on the expression of pERK1/2 and pCREB in DRGs of the 4T1 BC mice. DRGs were harvested from mice of each treatment group after sacrifice at day 21 and subjected to Western analysis. I. Western analysis of TRPV1 expression in DRGs of 4T1 BC mice, and mouse primary bone marrow stromal cells, primary calvarial osteoblasts (Obl), MLO-Y4 osteocyte-like cells (Ocy) and osteoclasts generated from bone marrow macrophages (Ocl) and 4T1 BC cells.
Figure 3
Figure 3. Effects of TRPV1 antagonists, SB366791 (synthetic) and I-RTX (natural), on 4T1 BC colonization in tibiae, metastasis to lung, and weight loss in the 4T1 BC mice.
A. Radiograph of osteolytic lesions associated with 4T1 BC colonization in tibiae in the 4T1 BC mice treated without (left) or with (right) SB366791 (500 μg/kg, ip, once a day from day 6 to 20) taken at day 21 prior to sacrifice under general anesthesia. B. Quantitative analysis of Figure 3A. Ratio represents osteolytic area of 4T1 BC + SB366791/osteolytic area of 4T1 BC x 1. Data are shown as mean ± SD (N=5). *p<0.05 vs 4T1 BC mice. C. Macroscopic view of lung metastasis of 4T1 BC from tibiae in the same experiment as Figure 3A. D. Quantitative analysis of Figure 3C. Lungs were harvested from mice after sacrifice and fixed in Bouin’s fixative, and the number of metastatic foci were macroscopically counted. Data are shown as mean ± SD (N=5). *p<0.05 vs 4T1 BC mice. E. Effects of SB366791 (500 mg/kg, ip, once a day from day 6 to 20) on 4T1 BC cell proliferation in bone evaluated by Ki-67 expression. Bones were harvested at day 21 and sections were immunostained with anti-Ki67 antibody. Scale bar=200μm. F. Quantitative analysis of Figure 3E. Ki-67+ 4T1 BC cells in three fields of 1 mm2 of tumor were counted under a microscopy using Image J. Data are shown as mean ± SD (N=5). *p<0.05 vs sham mice. #p<0.05 vs untreated 4T1 BC mice. G. Effects of SB366791 (500 mg/kg, ip, once a day from day 6 to 20) on 4T1 BC cell apoptosis in tibiae of 4T1 BC mice. Tibiae were harvested at day 21 and sections were stained with TUNEL. Apoptotic 4T1 BC cells are seen in brown. Scale bar 200μm. H. Quantitative analysis of Figure 3G. The number of TUNEL-positive 4T1 BC cells in three fields of 1 mm2 of tumor were counted under a microscopy using Image J. Data are shown as mean ± SD (N=5). *p<0.05 vs sham and untreated 4T1 BC mice. I. Osteolytic lesions associated with 4T1 BC colonization in tibiae in 4T1 BC mice treated with or without I-RTX (0.5 μmol/kg, ip, once a day from day 6 to 20). Ratio represents osteolytic area of 4T1 BC + I-RTX/osteolytic area of 4T1 BC x 1. Data are shown as mean ± SD (N=5). *p<0.05 vs 4T1 BC mice. J. Lung metastasis of 4T1 BC from tibiae in the same experiment as Figure 3I. Data are shown as mean ± SD (N=5). *p<0.05 vs 4T1 BC mice.
Figure 4
Figure 4. Colonization in tibiae and lung metastasis of E0771 BC cells from tibiae, and BCIBP induction in TRPV1−/− mice.
A. Radiograph of osteolytic lesions associated with mouse E0771 BC colonization in tibiae in WT (left) and TRPV1−/− (right) mice taken at day 21 prior to sacrifice under general anesthesia. B. Quantitative analysis of Figure 4A. Ratio represents osteolytic area of TRPV1−/− mice /osteolytic area of WT mice x 1. Data are shown as mean ± SD (N=7). *p<0.05 vs WT mice. C. Macroscopic view of lung metastasis of E0771 BC cells from tibiae in the same experiment as Figure 4A. D. Quantitative analysis of Figure 4C. The number of 4T1 BC metastatic foci in lung was macroscopically counted as described in Figure 3D. Data are shown as mean ± SD (N=7). *p<0.05 vs WT mice. E. Hind-paw mechanical allodynia assessed at day 21 in WT and TRPV1−/− mice that were intratibially injected with E0771 BC cells. See Figure 2A legend for experimental details. Data are shown as mean ± SD (N=7). *p<0.05 vs sham WT mice. #p<0.05 vs WT E0771 mice. F. Expression of molecular marker for SN excitation, pERK1/2 and pCREB, in DRGs harvested from WT and TRPV1−/− mice that were intratibially injected with E0771 BC cells at day 21 by Western analysis. G. Co-expression of pERK1/2 (left) and CGRP (center) in SNs in DRGs harvested from WT andTRPV1−/− mice intratibially injected with or without E0771 at day 21 by immunofluorescence. Scale bar=100μm.
Figure 5
Figure 5. HGF expression in SNs in tibiae and DRG.
A. Co-expression of CGRP (left, red) and HGF (center, green) on SNs in DRGs of sham (top) and 4T1 BC (bottom) mice. DRGs were harvested from mice at day 21 and sections were immunofluorostained with anti-CGRP and anti-HGF antibody. Scale bar=50μm. B. Quantitative analysis of Figure 5A. The number of CGRP+ and HGF+ SNs was enumerated under a fluorescent microscope using Neuron J software. The value on Y-axis shows the number of HGF+ SNs/the number of CGRP+ SNs. Data are shown as mean ± SD (N=3). *p<0.01 vs sham mice. C. Co-expression of HGF on CGRP+ SNs (white arrows) in the cortical bone of tibiae of sham (left) and 4T1 BC mice (right). Tibiae were harvested from mice at day 21 and sections were immunofluorostained with anti-CGRP (red) and anti-HGF (green) antibody and counterstained with DAPI (blue). Scale bar=50μm. D. HGF levels in bone marrow and serum of sham, untreated 4T1 BC mice and 4T1 BC mice treated with SB366791 (500μg/kg, ip, once a day from day 6 to 20) by ELISA (R & D Systems, #MHG00, Mouse/Rat HGF Quantikine ELISA Kit). Bone marrow and blood were harvested at day 21 prior to sacrifice. Data are shown as mean ± SD (N=8). *p<0.01 vs sham mice. #p<0.05 vs untreated 4T1 BC mice. E. Western analysis of HGF expression in DRGs harvested from sham, untreated 4T1 BC mice and 4T1 BC mice treated with or without SB366791 (500μg/kg, ip, once a day from day 6 to 20) at day 21. F. Western analysis of HGF expression in DRGs of the 4T1 BC mice treated with or without I-RTX (0.5 μmol/kg, ip, once a day from day 6 to 20). DRGs were harvested at day 21.
Figure 6
Figure 6. HGF expression on CGRP+ SNs
A. Co-expression of HGF (left) and CGRP (center) on SNs in DRGs in WT and TRPV1−/− mice intratibially injected with or without E0771 BC cells. DRGs were harvested from mice at day 21 and sections were immunofluorostained with anti-CGRP and anti-HGF antibody. Scale bar=50μm. B. Quantitative analysis of Figure 6A. Ratio represents TRPV1−/− sham, E0771 BC-injected WT or E0771 BC-injected TRPV1−/− mice /WT sham mice x 1. Data are shown as mean ± SD (N=7). *p<0.05 vs WT sham mice. #p<0.05 vs WT E0771 BC mice. C. Western analysis of HGF expression in DRG SNs harvested at day 21 from WT and TRPV1−/− mice that were intratibially injected with or without E0771 BC cells.
Figure 7
Figure 7. Role of HGF/c-Met in 4T1 BC progression in tibiae, lung metastasis from tibiae, and BCIBP induction in 4T1 BC mice.
A. Effects of shRNA knockdown of c-Met in 4T1 BC cells or inhibition of c-Met signaling by crizotinib (30mg/kg, po, once every day from day 6 to 20, #4368, Tocris) on the development of osteolytic lesions associated with 4T1 BC progression in tibiae. Radiographs were taken prior to sacrifice at day 21 under general anesthesia. B. Quantitative analysis of Figure 7A. Ratio represents, osteolytic area of 4T1 BC + SB366791 or 4T1/sh c-Met/osteolytic area of 4T1 parental x 1. Data are shown as mean ± SD (N=4). *p<0.05 vs 4T1 parental and 4T1/sh control mice. C. Effects of shRNA knockdown of c-Met in 4T1 BC cells or inhibition of c-Met signaling by crizotinib on lung metastases from tibiae in the same experiment as Figure 7A. D. Quantitative analysis of Figure 7C. Number of 4T1 BC metastatic foci in lung was macroscopically counted as described in Figure 4D. Data are shown as mean ± SD (N=4). *p<0.05 vs 4T1 parental and 4T1/sh control mice E. Effects of shRNA knockdown of c-Met in 4T1 BC cells or inhibition of c-Met signaling by crizotinib on BCIBP induction assessed by hind-paw mechanical allodynia at day 21. See Figure 2A legend for experimental details. Data are shown as mean ± SD (N=4). *p<0.01 vs sham mice. #p<0.05 vs 4T1 parental and 4T1/sh control mice. &p<0.01 vs untreated 4T1 parental mice.

Similar articles

References

    1. Carmeliet P. & Tessier-Lavigne M. Common mechanisms of nerve and blood vessel wiring. Nature 436, 193–200, doi:10.1038/nature03875 (2005). - DOI - PubMed
    1. Hanahan D. & Weinberg R. A. Hallmarks of cancer: the next generation. Cell 144, 646–674, doi:10.1016/j.cell.2011.02.013 (2011). - DOI - PubMed
    1. Bapat A. A., Hostetter G., Von Hoff D. D. & Han H. Perineural invasion and associated pain in pancreatic cancer. Nature reviews. Cancer 11, 695–707, doi:10.1038/nrc3131 (2011). - DOI - PubMed
    1. Falk S. & Dickenson A. H. Pain and nociception: mechanisms of cancer-induced bone pain. J Clin Oncol 32, 1647–1654, doi:10.1200/jco.2013.51.7219 (2014). - DOI - PubMed
    1. Ciftci S. et al. Perineural invasion in prostate biopsy specimens is associated with increased bone metastasis in prostate cancer. Prostate 75, 1783–1789, doi:10.1002/pros.23067 (2015). - DOI - PubMed

Publication types