[Preprint]. 2024 Jun 16:2023.07.08.548212.
doi: 10.1101/2023.07.08.548212.

From enhancers to genome conformation: complex transcriptional control underlies expression of a single herpesviral gene

Affiliations

From enhancers to genome conformation: complex transcriptional control underlies expression of a single herpesviral gene

David W Morgens et al. bioRxiv. .

Update in

Abstract

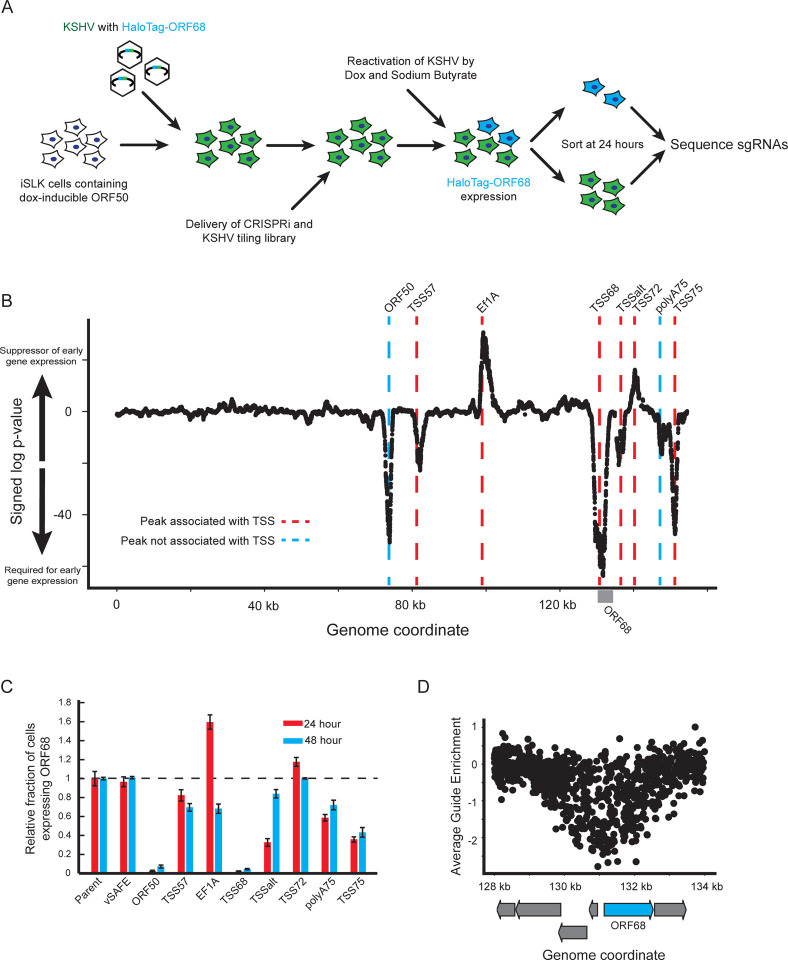
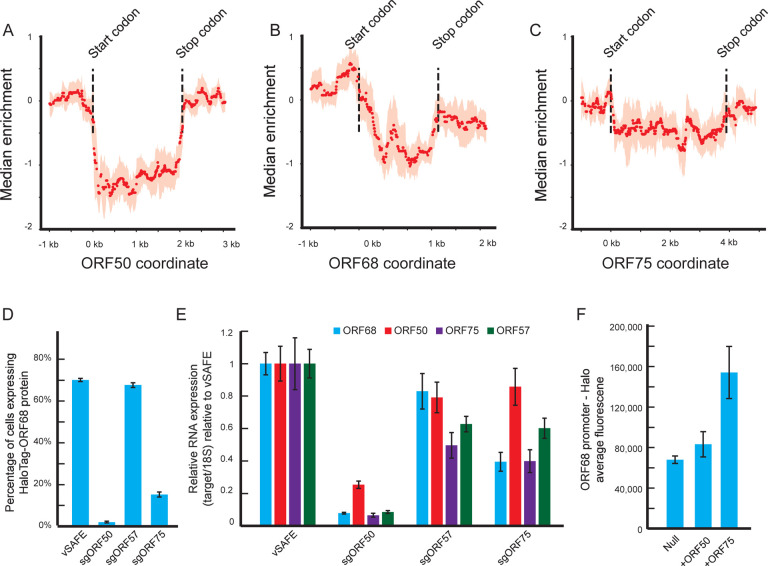
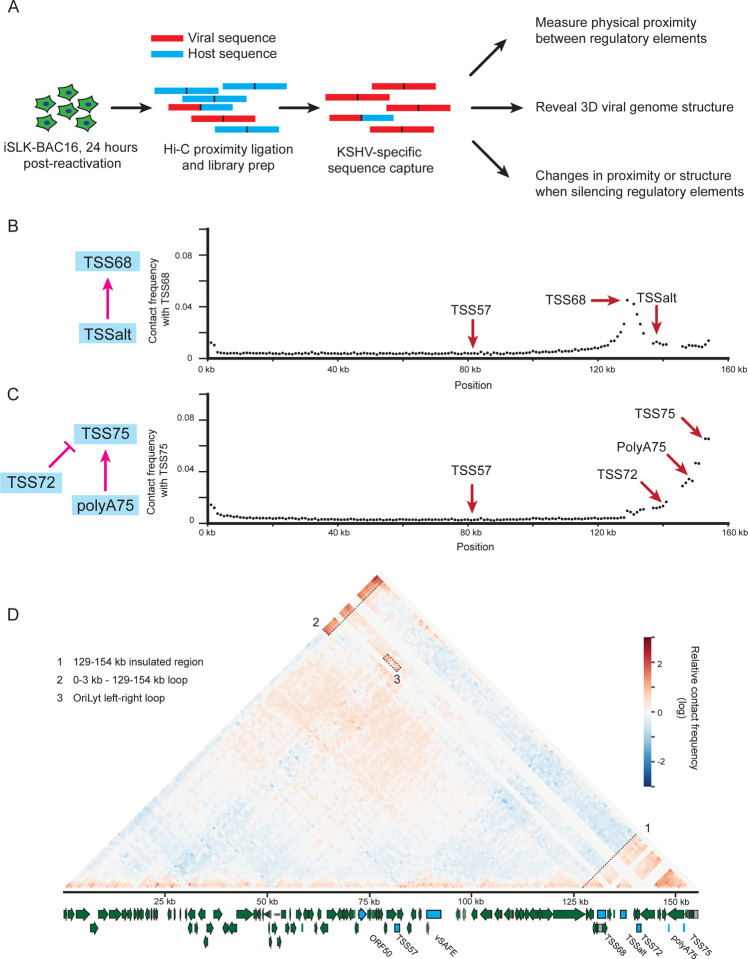
Complex transcriptional control is a conserved feature of both eukaryotes and the viruses that infect them. Here, we illustrate this by combining high-density functional genomics, expression profiling, and viral-specific chromosome conformation capture to define with unprecedented detail the transcriptional regulation of a single gene, ORF68, from Kaposi's sarcoma-associated herpesvirus (KSHV). We first identified seven cis-regulatory regions by densely tiling the ~154 kb KSHV genome with CRISPRi. A parallel Cas9 nuclease screen indicated that three of these regions act as promoters of genes that regulate ORF68. RNA expression profiling demonstrated that three more of these regions act by either repressing or enhancing other distal viral genes involved in ORF68 transcriptional regulation. Finally, we tracked how the 3D structure of the viral genome changes during its lifecycle, revealing that these enhancing regulatory elements are physically closer to their targets when active, and that disrupting some elements caused large-scale changes to the 3D genome. These data enable us to construct a complete model revealing that the mechanistic diversity of this essential regulatory circuit matches that of human genes.


Conflict of interest statement

Conflict of interest The authors declare that they have no conflict of interest.

Figures

Figure 1.
Figure 1.. CRISPRi screen identifies novel viral regulatory regions.
A) Schematic of screen. The viral genome encodes a constitutive fluorescent marker (green) and a HaloTag-ORF68 fusion (blue). B) Summary of results from the CRISPRi screen. X-axis identifies the genome coordinate on the BAC16 KSHV genome. y-axis represents the log-transformed p-value of each locus relative to negative control distribution. Red dotted lines indicate the location of transcriptional start sites. Blue dotted line identifies the two peaks that do not associate with a TSS. C) Validation of pooled guides targeting each peak. Three guides were used to target each locus identified on the x-axis. Y-axis displays the relative percent of cell expressing the HaloTag-ORF68 for the 24 or 48 hour post lytic reactivation time points. Error bars represent standard error of four replicates from independent reactivations. D) Enrichment of individual guides at the ORF68 locus. Each dot represents a single guide, with the target location displayed on the x-axis and the average enrichment from two replicates on the y-axis. Arrows represent coding regions of ORF68 (in blue) and surrounding genes in grey.
Figure 2.
Figure 2.. Local effects caused by CRISPRi.
A) Heat map of changes to viral gene expression at 24 hours relative to vSAFE negative controls, with ORF68 presented at the top. Each column shows relative gene expression changes following CRISPRi-induced suppression of the indicated locus. Values are sorted by the effect of sgTSS75. Average of three replicates. B-D) Change in RNA-level of each viral gene relative to vSAFE negative controls in genome-order. Genes whose start codons are within 2.5 kb of at least one guide in targeting pool are highlighted. E) Nascent RNA expression was measured by RT-qPCR at 24 hours post-reactivation from cells treated for two hours with EU. Values are presented relative to parental cells, and error bars are standard error from three independent replicates.
Figure 3.
Figure 3.. Knockout screen maps associated coding regions.
A-C) Median smoothed enrichments from Cas9 nuclease screen at associated coding locus. Dotted lines indicate exon boundaries. For each guide, the median enrichment of 500 bp window centered at the target locus was calculated along with an IQR. Median value is shown as a point and IQR is shown as shaded region. Regions were considered significant if the guides on each side of the boundary were significantly different and in consistent directions. D) Percent of cells expressing HaloTag-ORF68 24 hours post-reactivation for the indicated pool of coding region-targeting guides. Values are averages of four independent replicates and error bars represent standard error. E) RT-qPCR measurements of ORF68, ORF50, ORF75 and ORF57 mRNA at 24 hours post-reactivation following Cas9-based targeting of the loci indicated on the x-axis. Data are presented relative to 18S RNA and vSAFE. Error bars show standard error from four technical replicates. F) Average fluorescence from HEK293T cells transfected with an ORF68-promoter-driven HaloTag and a plasmid expressing the indicated viral protein. Error bars are standard error from seven independent replicates.
Figure 4.
Figure 4.. Mapping regulatory network by effect on viral transcription.
A) Co-correlation matrix of the RNA-seq data from Figure 2a. For each indicated pair of sgRNA pools, a Pearson correlation was calculated between the viral RNA levels. B) Model of regulatory events controlling transcription of the ORF68 locus. C) Supernatant transfer assay measuring changes in KSHV virion production after knockdown of the indicated loci. Error bars represent standard error from six independent reactivations.
Figure 5.
Figure 5.. Capture Hi-C of the KSHV genome.
A) Schematic of capture Hi-C experiment. B,C) Contact frequency between B) TSS68 and C) TSS75 and other locations in the viral genome at 1 kb resolution. D) Relative contact frequency map corrected for circular/concatenated distance. Noted features are marked and labeled. Positive values represent more interaction than expected. Annotated viral genome is provided with regulatory elements identified marked in blue.
Figure 6.
Figure 6.. Changing physical relationship between regulatory regions.
A) Schematic splitting the regulatory network into initial, intermediate, and final stages. B-D) Relative contact frequency at 1 kb resolution from 100–154 kb measured by capture Hi-C 24 hours post-reactivation for representative B) initial stages (purple), C) intermediate stages (orange), D) and final stages (yellow). Positive values indicate greater interaction than expected, and locations of regulatory elements are marked in blue. E-G) Relative contact frequency at 2 kb resolution across the genome measured by capture Hi-C 24 hours post-reactivation for representative E) initial stages, F) intermediate stages, G) and final stages. Dotted lines represent locations of insulator regions as defined by negative local-minimum insulator scores. The locations of three observed insulators are marked in blue. H-J) Insulator scores at the marked locations in A-C at D) 100–102 kb, E) 130–132 kb, and F) 136–138 kb. More negative values indicated a stronger insulator. Values are the average of two adjacent regions with error bars representing standard deviation of these two values.

Similar articles

References

    1. Kutluay S. B. & Triezenberg S. J. Role of chromatin during herpesvirus infections. Biochim. Biophys. Acta 1790, 456–66 (2009). - PMC - PubMed
    1. Toth Z. et al. Epigenetic analysis of KSHV latent and lytic genomes. PLoS Pathog. 6, 1–17 (2010). - PMC - PubMed
    1. Qi Y. et al. Latency-associated nuclear antigen inhibits lytic replication of Kaposi’s sarcoma-associated herpesvirus by regulating let-7a/RBPJ signaling. Virology 531, 69–78 (2019). - PubMed
    1. Stedman W. et al. Cohesins localize with CTCF at the KSHV latency control region and at cellular c-myc and H19/Igf2 insulators. EMBO J. 27, 654 (2008). - PMC - PubMed
    1. Campbell M. et al. KSHV episomes reveal dynamic chromatin loop formation with domain-specific gene regulation. Nat. Commun. 2017 91 9, 1–14 (2018). - PMC - PubMed

Publication types