

This is a preprint.
Ethnicity is not biology: retinal pigment score to evaluate biological variability from ophthalmic imaging using machine learning
- PMID: 37461664
- PMCID: PMC10350142
- DOI: 10.1101/2023.06.28.23291873
Ethnicity is not biology: retinal pigment score to evaluate biological variability from ophthalmic imaging using machine learning
Update in
-
Machine learning derived retinal pigment score from ophthalmic imaging shows ethnicity is not biology.Nat Commun. 2025 Jan 2;16(1):60. doi: 10.1038/s41467-024-55198-7. Nat Commun. 2025. PMID: 39746957 Free PMC article.
Abstract
Background: Few metrics exist to describe phenotypic diversity within ophthalmic imaging datasets, with researchers often using ethnicity as an inappropriate marker for biological variability.
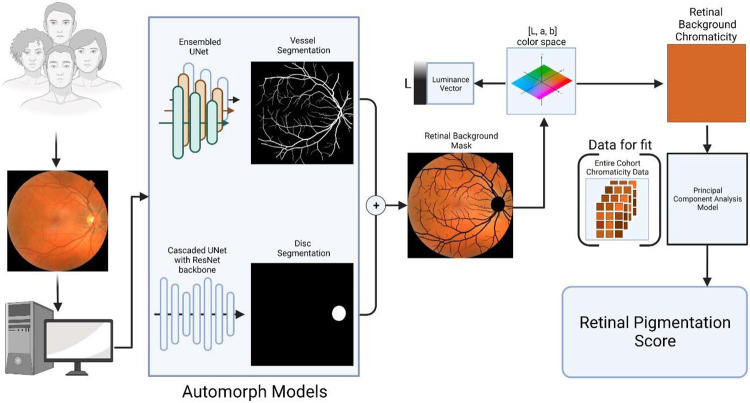
Methods: We derived a continuous, measured metric, the retinal pigment score (RPS), that quantifies the degree of pigmentation from a colour fundus photograph of the eye. RPS was validated using two large epidemiological studies with demographic and genetic data (UK Biobank and EPIC-Norfolk Study).
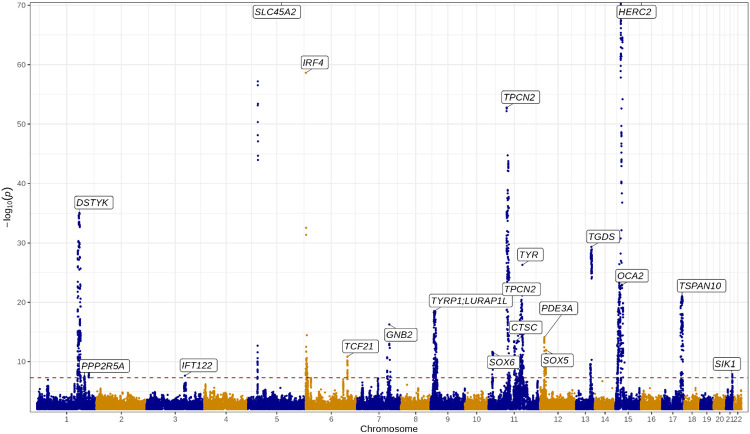
Findings: A genome-wide association study (GWAS) of RPS from UK Biobank identified 20 loci with known associations with skin, iris and hair pigmentation, of which 8 were replicated in the EPIC-Norfolk cohort. There was a strong association between RPS and ethnicity, however, there was substantial overlap between each ethnicity and the respective distributions of RPS scores.
Interpretation: RPS serves to decouple traditional demographic variables, such as ethnicity, from clinical imaging characteristics. RPS may serve as a useful metric to quantify the diversity of the training, validation, and testing datasets used in the development of AI algorithms to ensure adequate inclusion and explainability of the model performance, critical in evaluating all currently deployed AI models. The code to derive RPS is publicly available at: https://github.com/uw-biomedical-ml/retinal-pigmentation-score.
Funding: The authors did not receive support from any organisation for the submitted work.
Conflict of interest statement
Declaration of interests: APK has acted as a paid consultant or lecturer to Abbvie, Aerie, Allergan, Google Health, Heidelberg Engineering, Novartis, Reichert, Santen and Thea. AYL reports support from the US Food and Drug Administration, grants from Santen, Carl Zeiss Meditec, and Novartis, personal fees from Genentech, Topcon, and Verana Health, outside of the submitted work; This article does not reflect the opinions of the Food and Drug Administration. AT report grants from Bayer and Novartis and personal fees from Abbvie, Allegro, Annexon, Apellis, Bayer, Heidelberg Engineering, Iveric Bio, Kanghong, Novartis, Oxurion, Roche/Genentech, Thea CE reports personal fees from Heidelberg Engineering and Inozyme pharmaceuticals outside of the submitted work.
Figures


References
-
- Flaxman SR, Bourne RRA, Resnikoff S, Ackland P, Braithwaite T, Cicinelli MV, et al. Global causes of blindness and distance vision impairment 1990–2020: a systematic review and meta-analysis. Lancet Glob Health 2017;5:e1221–34. - PubMed
-
- Wong WL, Su X, Li X, Cheung CMG, Klein R, Cheng C-Y, et al. Global prevalence of age-related macular degeneration and disease burden projection for 2020 and 2040: a systematic review and meta-analysis. Lancet Glob Health 2014;2:e106–16. - PubMed
-
- Teo ZL, Tham Y-C, Yu M, Chee ML, Rim TH, Cheung N, et al. Global prevalence of diabetic retinopathy and projection of burden through 2045: Systematic review and meta-analysis. Ophthalmology 2021;128:1580–91. - PubMed
-
- Tufail A, Rudisill C, Egan C, Kapetanakis VV, Salas-Vega S, Owen CG, et al. Automated Diabetic Retinopathy Image Assessment Software: Diagnostic Accuracy and Cost-Effectiveness Compared with Human Graders. Ophthalmology 2017;124:343–51. - PubMed
Publication types
Grants and funding
LinkOut - more resources
Full Text Sources