[Preprint]. 2023 Jun 28:rs.3.rs-2976953.
doi: 10.21203/rs.3.rs-2976953/v1.

The Secondary Somatosensory Cortex Gates Mechanical and Thermal Sensitivity

Affiliations

The Secondary Somatosensory Cortex Gates Mechanical and Thermal Sensitivity

Daniel G Taub et al. Res Sq. .

Update in

Abstract

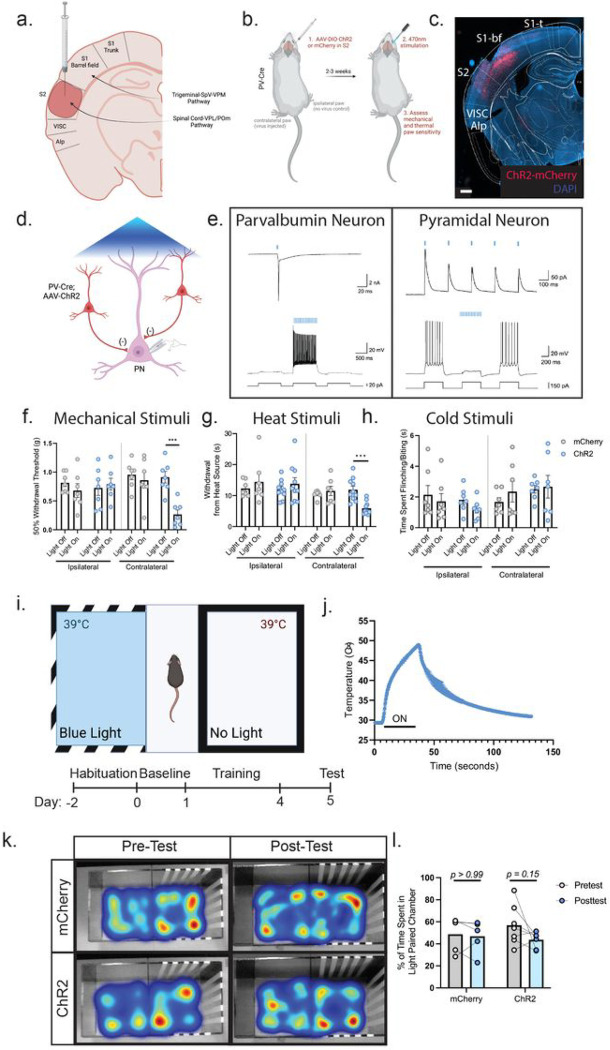
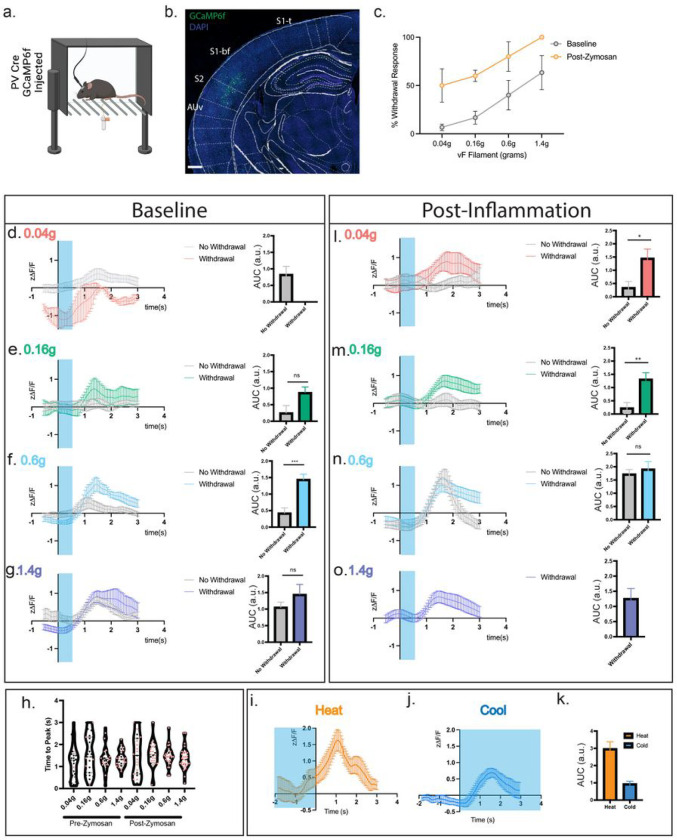
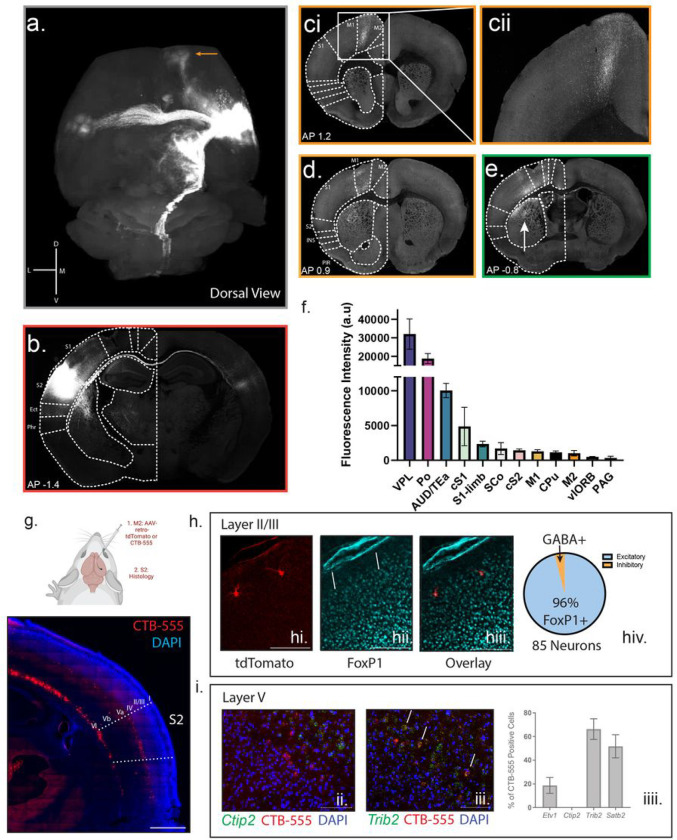
The cerebral cortex is vital for the perception and processing of sensory stimuli. In the somatosensory axis, information is received by two distinct regions, the primary (S1) and secondary (S2) somatosensory cortices. Top-down circuits stemming from S1 can modulate mechanical and cooling but not heat stimuli such that circuit inhibition causes blunted mechanical and cooling perception. Using optogenetics and chemogenetics, we find that in contrast to S1, an inhibition of S2 output increases mechanical and heat, but not cooling sensitivity. Combining 2-photon anatomical reconstruction with chemogenetic inhibition of specific S2 circuits, we discover that S2 projections to the secondary motor cortex (M2) govern mechanical and thermal sensitivity without affecting motor or cognitive function. This suggests that while S2, like S1, encodes specific sensory information, that S2 operates through quite distinct neural substrates to modulate responsiveness to particular somatosensory stimuli and that somatosensory cortical encoding occurs in a largely parallel fashion.


Conflict of interest statement

Declaration of Interests: CJW is a founder of Nocion Therapeutics, Quralis and Blackbox Bio.

Figures

Figure 1:
Figure 1:. Optogenetic inhibition of the secondary somatosensory cortex (S2) enhances tactile and thermal sensitivity.
(a): Schematic diagram of injection strategy into the S2 cortex via needle placement through the barrel cortex. (b): Experimental workflow of optogenetic inhibition of S2. Cre-dependent channelrhodopsin (ChR2) was injected into the S2 region of parvalbumin (PV)-Cre animals. An optical fiber was then placed in the S2 region to enable activation of inhibitory neurons to produce regional net inhibition. (c): Expression of ChR2 virus in PV neurons of the S2 region. Scale bar: 500μm. (d): Schematic diagram depicting slice electrophysiology approach. Pyramidal neurons in S2 were recorded from while adjacent PV-interneurons were activated by blue light illumination. (e): Light-evoked responses in a ChR2+ parvalbumin interneuron (left) and a ChR2 pyramidal neuron (right). Left: Blue light stimulation triggers action potential firing in the fast-spiking parvalbumin interneuron in both voltage (up) and current (bottom) clamp modes; Right: Photoactivation of parvalbumin interneurons evokes inhibitory post-synaptic currents (up) and suppresses actional potential firing (bottom) in the pyramidal neuron. Example neuron in L5 of a total of 10 cells over 4 animals. Similar inhibition observed in L2/3 neurons. (f): Optogenetic inhibition of S2 produces increased mechanical sensitivity in the von Frey mechanical assay. Two Way ANOVA with Tukey’s (n=7 for all groups). (g): Optogenetic inhibition of S2 produces increased sensitivity to heat applied by a Hargreave’s thermal ramp stimulus. Two Way ANOVA with Tukey’s (n=7 mCherry, n=10 ChR2). (h): Optogenetic inhibition of S2 does not affect cold sensitivity in the acetone assay. Two Way ANOVA with Tukey’s (n=7 for both groups) (i): Schematic depicting the conditioned place preference test and experimental timeline. (j): Thermal profile of the heat ramp stimulus applied to the hindpaw. (k): Optogenetic inhibition of S2 does not produce any conditioned aversive behavior. Representative heat maps are color coded to label the most occupied spaces in red and least occupied in blue. (l): Time spent in the paired chamber does not differ between S2 inhibited and non-inhibited animals. Two Way ANOVA with Sidak’s multiple comparisons, p-values as stated (n=5 mCherry, n=7 ChR2). Data presented as mean ± SEM. *p=<0.05, **p=<0.005, ***p=<0.0005.
Figure 2:
Figure 2:. The S2 cortical responses to mechanical and thermal somatosensory stimuli in the non-noxious and noxious range correlates with behavioral outputs.
(a): Diagram depicting the experimental strategy of in vivo calcium imaging with fiber photometry. GCaMP6f was injected into the S2 region of parvalbumin-cre (PV-Cre) mice, and a fiber lowered into S2 to capture calcium transients. (b): Example of GCaMP6f expression in PV neurons of the S2 region. Scale bar = 500μm. (c): Percent withdrawal to differentially weighted mechanical von Frey stimulation of the hindpaw in fiber implanted animals both before and after inflammatory induction. (d,e,f,g): Left: Calcium responses of PV neurons in S2 to a 0.04, 0.16, 0.6 and 1.4g mechanical stimulus plotted by Z-scored delta F/F following a single stimulation of the hindpaw at time 0. Blue shading represents the average temporal extent of stimulation. Right: Area under curve analysis of calcium transients produced in d, e, f, g. Unpaired t-test. (h): Time to peak of calcium response to a single mechanical stimulus of the hindpaw. Black circles and red circles represent no paw withdrawal and paw withdrawal trials, respectively. Data shown as a violin plot with the median and interquartile range depicted. (i): Calcium responses in PV neurons in S2 plotted by Z-scored delta F/F to a heat ramp stimulus. Time 0 is time of paw withdrawal from the heat source. Blue shading represents when the heat stimulus is on (j): Calcium responses in PV neurons in S2, plotted by Z-scored delta F/F, to application of acetone to the hindpaw at time 0. Blue shading represents the temporal extent of the acetone stimulus (k): Area under curve analysis of the calcium transients produced in i and j. (l, m, n, o): Left: Calcium responses of PV neurons in S2 plotted by Z-scored delta F/F following a single mechanical stimulation of the hindpaw at time 0, 4 hours post zymosan injection. Force of stimulation in the graphs. Right: Area under curve analysis of calcium transients produced in l, m, n, o. Unpaired t-test. For all experiments, n=3 animals, 5–10 sensory trials per mouse, see Methods. Data presented as mean ± SEM. *p=<0.05, **p=<0.005, ***p=<0.0005.
Figure 3:
Figure 3:. The S2 projectome reveals specific cortical and subcortical sensorimotor targets including the secondary motor cortex (M2).
(a): Dorsal view of the reconstruction of S2 projection sites. Tract from S2 to M2 highlighted by an orange arrow. (b): Example S2 injection site. (c): (i): M2 projections (ii): magnified M2 projections. (d): Projections to the M1 cortex. (e): Projections to the primary somatosensory cortex (S1). Arrow denotes projections to the striatum. (f): Average intensity of projections to different brain regions. S2 – red (contralateral light red), S1 – green (contralateral light green), vlORB – navy, M1 – yellow, M2 – orange, AUD/TEa – teal, caudate putamen – black, Po of thalamus – purple, VPL of thalamus – blue, superior colliculus – white, PAG – dark purple. (g): Top: Schematic for ascertaining the identity of S2-to-M2 neurons by injecting either the retrograde dye CTB-555 or AAV2/retro-CAG-tdTomato into M2 and analyzing the S2 region. Bottom: Representative image of the S2 region labeled with CTB-555. Scale bar: 500μm. (h): Identity of Layer II/III neurons. (hi): Image of retro-CAG-tdTomato sparse labeled neurons in layer II of S2. (hii): Foxp1 staining in the cortex as a marker of excitatory neurons. Arrows pointing to example positive Foxp1 neurons. (hiii): Merged image reveals overlap between retro-CAG-tdTomato labeled neurons and Foxp1. Analysis of 3 animals with 85 neurons total. Scale bar: 100μm. (i): Identity of Layer V neurons by RNAscope. (ii): Example of non-overlap between CTB-555 (red) labelled neurons and Ctip2 RNAscope probe (green). (iii): Example of overlap between CTB-555 (red) labelled neurons and Trib2 (green). (iiii): Quantification of overlap between CTB-555 labelled neurons and Ctip2, Etv1, Satb2, and Trib2. n=2 animals. Data presented as mean ± SEM. Scale bar: 50μm.
Figure 4:
Figure 4:. S2 monosynaptically connects with upper layer II/III neurons in M2.
a. Schematic diagram of layer specific rabies tracing. b. Example of M2 injection site in Penk-Cre animal. GFP: AAV-hSyn-Flex-TVA-p2A-GFP-2A-oG. mCherry: Rabies. Blue: DAPI. bi. Widefield view of M2 with M2 region outlined. bii. Zoomed in view divided by channel. biii. Widefield view of S2 with S2 region outlined. biv. Layer-specific quantification of the percentage of “starter cells” in M2 compared with “input neurons” in S2 in Penk-Cre Mice. c. Example of M2 injection site in Rbp4-Cre animal. GFP: AAV-hSyn-Flex-TVA-p2A-GFP-2A-oG. mCherry: Rabies. Blue: DAPI. ci. Widefield view of M2 with M2 region outlined. cii. Zoomed in view divided by channel. ciii. Widefield view of S2 with S2 region outlined. civ. Layer-specific quantification of the percentage of starter cells in M2 compared with traced neurons in S2 in Rbp4-Cre Mice. Data presented as mean ± SEM. For all experiments, n=3 mice. Scale bar = 500μm
Figure 5:
Figure 5:. Chemogenetic inhibition of S2-to-M2 projecting neurons enhances mechanical and heat sensitivity.
(a): Schematic diagram and timeline of chemogenetic manipulation of S2-to-M2 projecting neurons. (b): Representative images of S2 region following injection AAV-DIO-Inhibitory DREADD in S2 and AAV2/retro-Cre in M2. Scale bar = 500μm (c): CNO ligand administration in ex vivo brain slices during patch clamp recording inhibits neurons infected with inhibitory DREADDs. Example trace representative of 4 animals (1 neuron/animal) examined. (d): Chemogenetic inhibition of S2-to-M2 neurons produces tactile sensitivity in the von Frey assay. mCherry: n=10, Inhibitory DREADD: n=11, Excitatory DREADD: n=10. Two-Way ANOVA followed by Tukey’s multiple comparisons test mCherry contralateral vs. Inhibitory DREADD contralateral p=0.0002. (e): Chemogenetic inhibition of S2-to-M2 neurons produces heat sensitivity in the Hargreave’s assay mCherry: n=10, Inhibitory DREADD: n=11, Excitatory DREADD: n=10. Kruskal-Wallis H=25.08 p=0.0001 Dunn’s multiple comparisons mCherry contralateral vs. Inhibitory DREADD contralateral p = 0.0032 (f): Chemogenetic inhibition or excitation of S2-to-M2 neurons produces no effect on acetone-induced cold sensitivity mCherry: n=5, Inhibitory DREADD: n=6, Excitatory DREADD: n=10 Two-Way ANOVA followed by Tukey’s post-hoc test. (g): Schematic diagram of chemogenetic inhibition of M2 projections via cannula administration of CNO. (h): Representative image of cannula placement above M2. White arrow pointing towards S2-to-M2 axons in the cortical column. Scale bar = 500μm (i): Chemogenetic inhibition of local M2 projections reproduces the tactile sensitivity observed with systemic CNO application. mCherry: n=8, inhibitory DREADD: n=8 Contralateral Paw Saline vs. 300μM CNO Two Way ANOVA followed by Tukey’s. (j): Chemogenetic inhibition of local M2 projections reproduces the heat sensitivity observed with systemic CNO application. mCherry: n=8, inhibitory DREADD: n=8. Contralateral Paw Saline vs. 300μM CNO Two Way ANOVA followed by Sidak’s. Data presented as mean ± SEM. *p=<0.05, **p=<0.005, ***p=<0.0005.

References

    1. Baluch F. & Itti L. Mechanisms of top-down attention. Trends Neurosci 34, 210–224, doi:10.1016/j.tins.2011.02.003 (2011). - DOI - PubMed
    1. Bannister K. & Dickenson A. H. What the brain tells the spinal cord. Pain 157, 2148–2151, doi:10.1097/j.pain.0000000000000568 (2016). - DOI - PubMed
    1. Manita S. et al. A Top-Down Cortical Circuit for Accurate Sensory Perception. Neuron 86, 1304–1316, doi:10.1016/j.neuron.2015.05.006 (2015). - DOI - PubMed
    1. Liu Y. et al. Touch and tactile neuropathic pain sensitivity are set by corticospinal projections. Nature 561, 547–550, doi:10.1038/s41586-018-0515-2 (2018). - DOI - PMC - PubMed
    1. Moreno-Lopez Y., Bichara C., Delbecq G., Isope P. & Cordero-Erausquin M. The corticospinal tract primarily modulates sensory inputs in the mouse lumbar cord. Elife 10, doi:10.7554/eLife.65304 (2021). - DOI - PMC - PubMed

Publication types

LinkOut - more resources