. 2023 Aug 4;133(4):333-349.
doi: 10.1161/CIRCRESAHA.123.322607. Epub 2023 Jul 18.

Chylomicrons Regulate Lacteal Permeability and Intestinal Lipid Absorption

Affiliations

Chylomicrons Regulate Lacteal Permeability and Intestinal Lipid Absorption

Georgia Zarkada et al. Circ Res. .

Abstract

Background: Lymphatic vessels are responsible for tissue drainage, and their malfunction is associated with chronic diseases. Lymph uptake occurs via specialized open cell-cell junctions between capillary lymphatic endothelial cells (LECs), whereas closed junctions in collecting LECs prevent lymph leakage. LEC junctions are known to dynamically remodel in development and disease, but how lymphatic permeability is regulated remains poorly understood.

Methods: We used various genetically engineered mouse models in combination with cellular, biochemical, and molecular biology approaches to elucidate the signaling pathways regulating junction morphology and function in lymphatic capillaries.

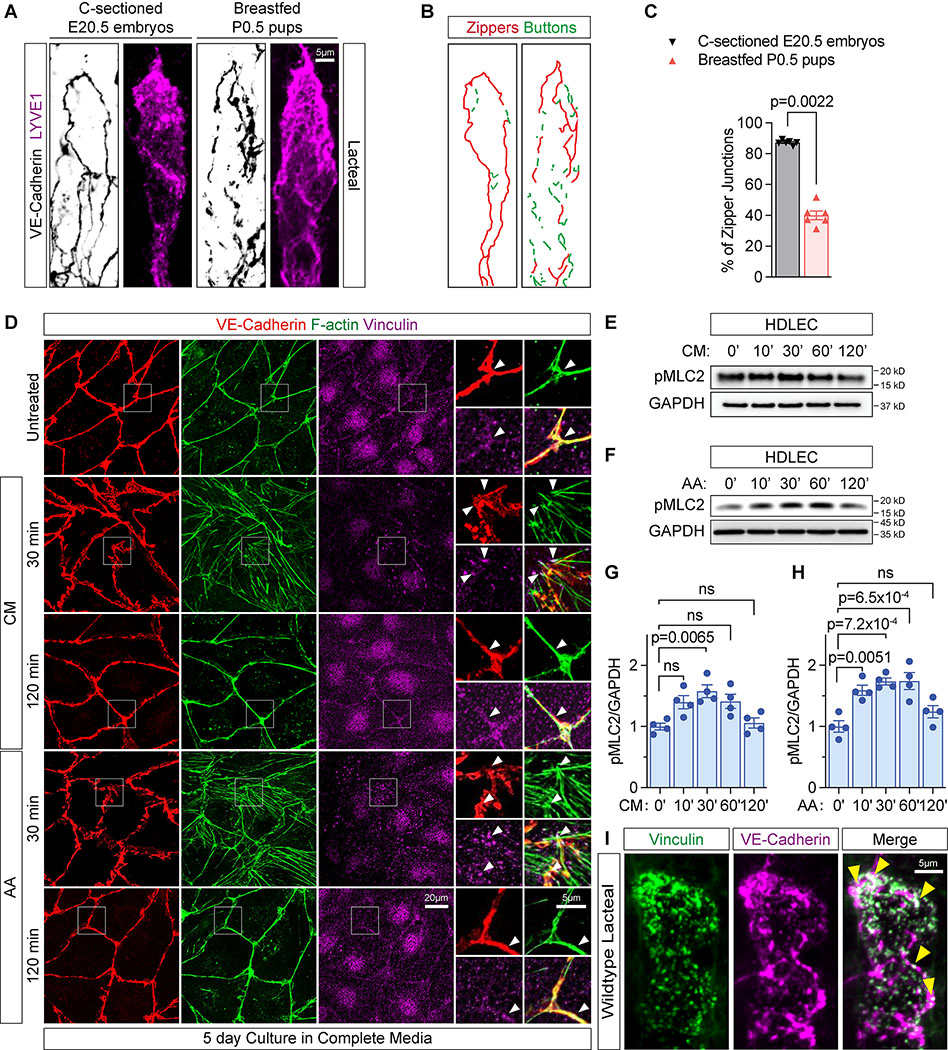
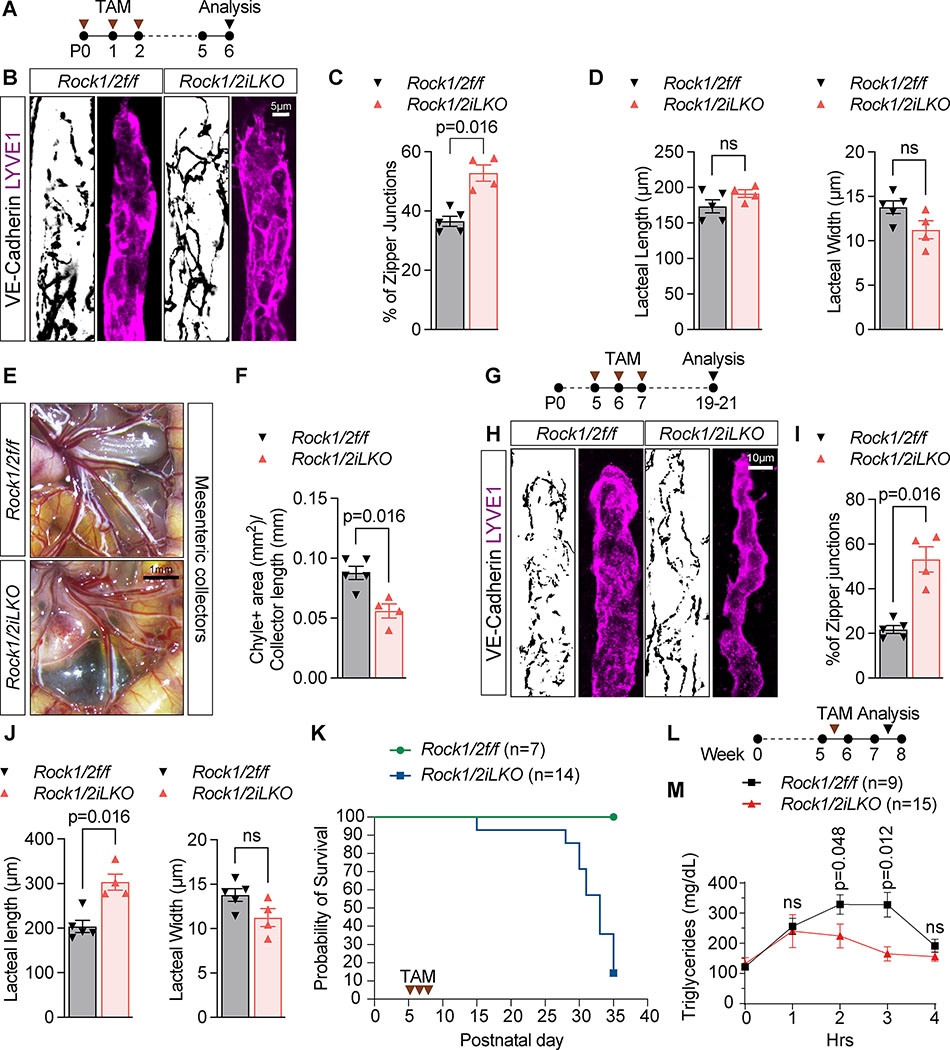
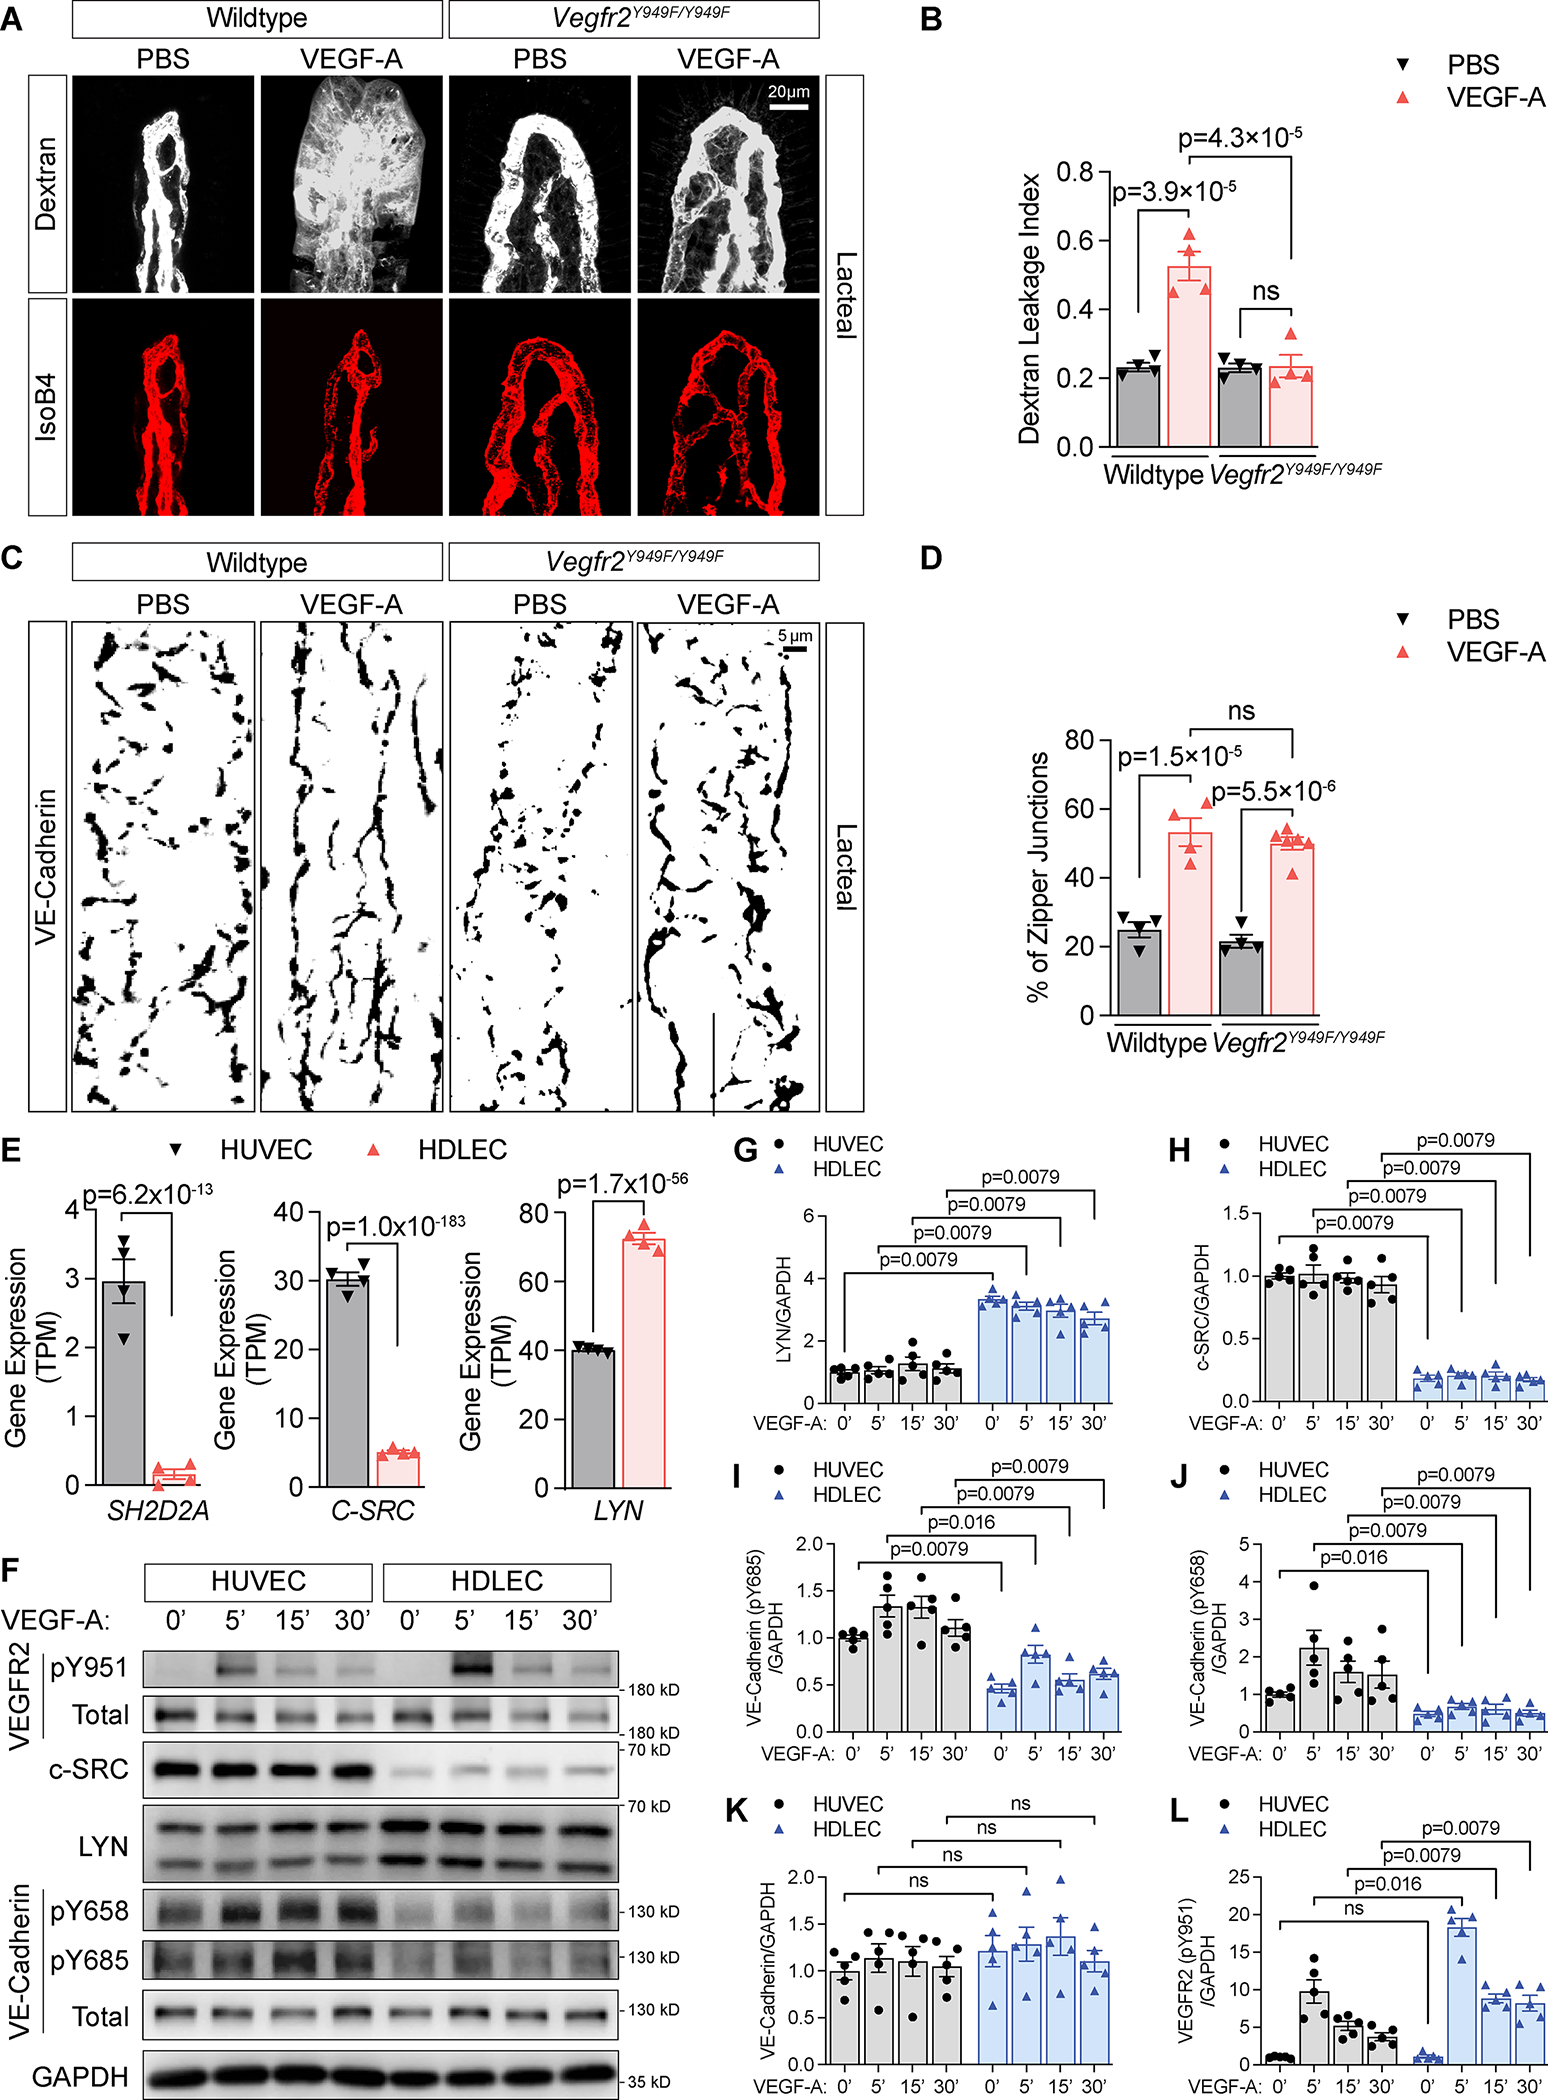
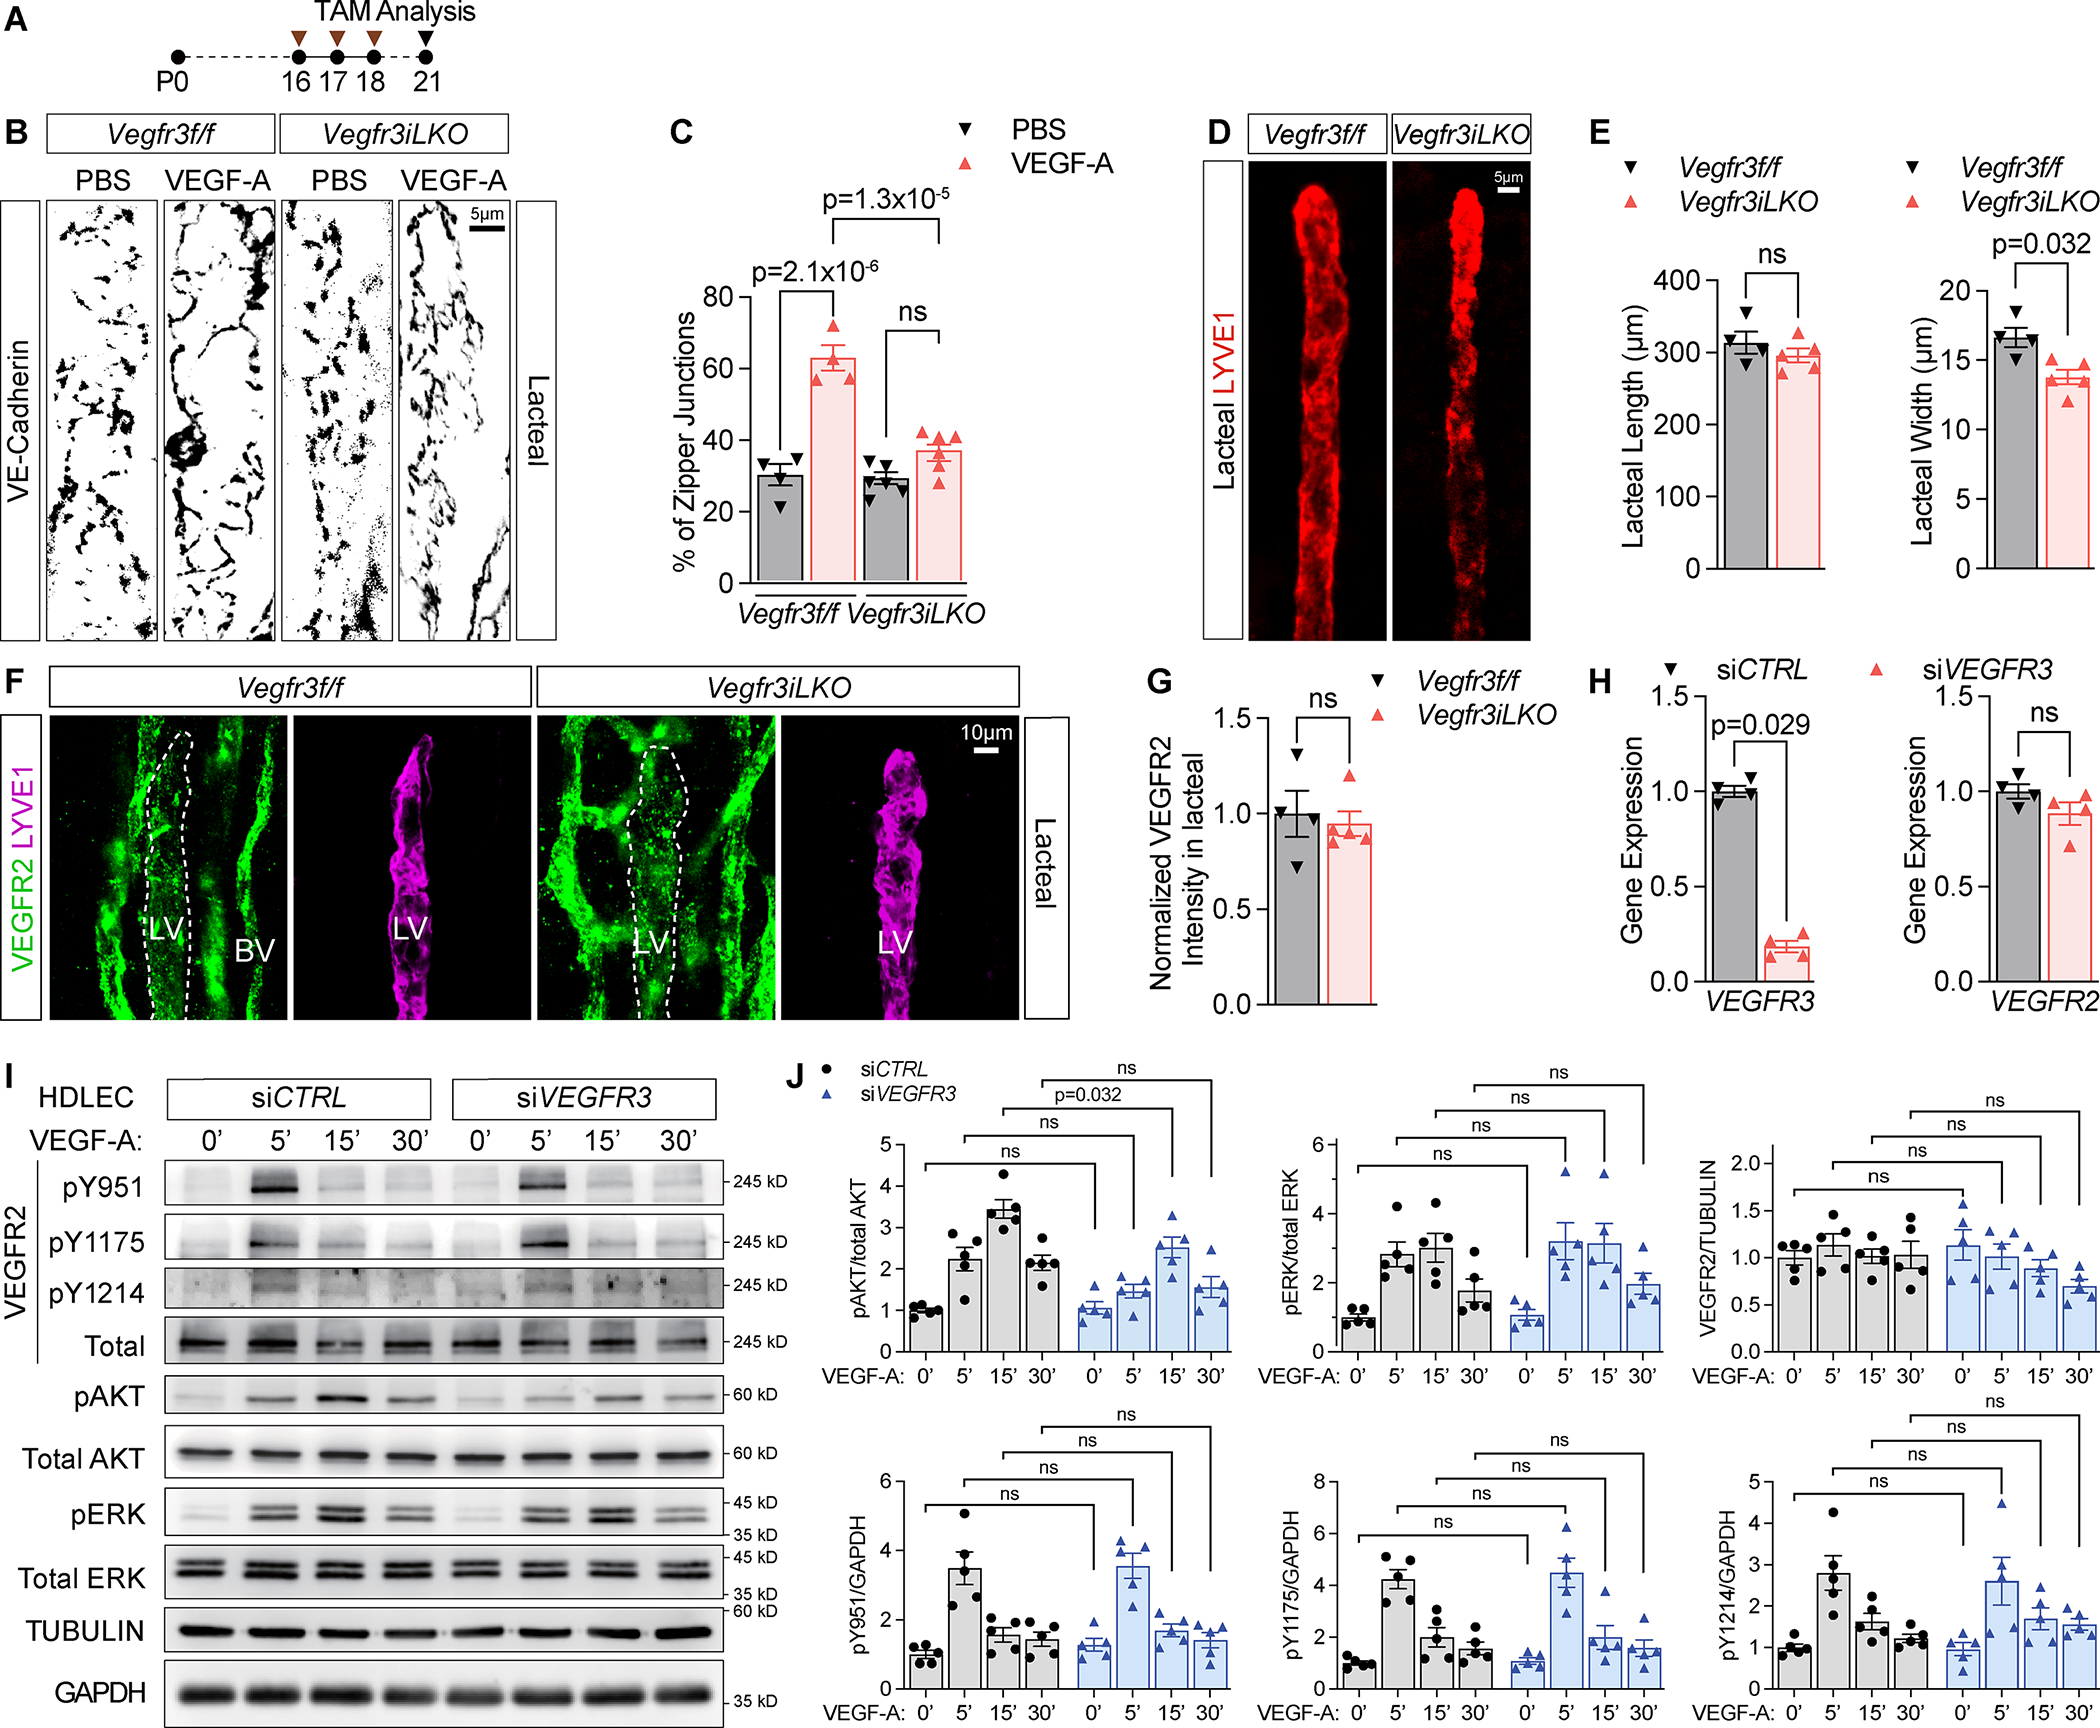
Results: By studying the permeability of intestinal lacteal capillaries to lipoprotein particles known as chylomicrons, we show that ROCK (Rho-associated kinase)-dependent cytoskeletal contractility is a fundamental mechanism of LEC permeability regulation. We show that chylomicron-derived lipids trigger neonatal lacteal junction opening via ROCK-dependent contraction of junction-anchored stress fibers. LEC-specific ROCK deletion abolished junction opening and plasma lipid uptake. Chylomicrons additionally inhibited VEGF (vascular endothelial growth factor)-A signaling. We show that VEGF-A antagonizes LEC junction opening via VEGFR (VEGF receptor) 2 and VEGFR3-dependent PI3K (phosphatidylinositol 3-kinase)/AKT (protein kinase B) activation of the small GTPase RAC1 (Rac family small GTPase 1), thereby restricting RhoA (Ras homolog family member A)/ROCK-mediated cytoskeleton contraction.

Conclusions: Our results reveal that antagonistic inputs into ROCK-dependent cytoskeleton contractions regulate the interconversion of lymphatic junctions in the intestine and in other tissues, providing a tunable mechanism to control the lymphatic barrier.

Keywords: chylomicrons; endothelial cells; lipid; permeability; vascular endothelial growth factor A.


Conflict of interest statement

Disclosures None.

Figures

Figure 1.
Figure 1.. Chylomicrons and lipids promote lacteal junction opening via cytoskeletal contractions:
(A) VE-Cadherin and LYVE1 staining of jejunum lacteals of C-sectioned E20.5 wildtype mouse embryos and breastfed postnatal (P) 0.5 neonatal pups. (B) Example of junction morphology quantification from Figure 1A. The length of zipper and button-like junctions is annotated in green and red respectively and measured using Fiji software (see online Methods). (C) Quantification of % zipper-like junctions out of total junction length in lacteals shown in A. Each symbol represents one mouse. N=6 mice per group. Error bars, SEM. Mann-Whitney U test. (D) VE-Cadherin, F-actin and Vinculin staining of confluent HDLECs in complete media with or without treatment with 50μg/mL chylomicrons (CM) or 30μM arachidonic acid (AA) at the indicated timepoints. Arrowheads indicate colocalization of VE-Cadherin, F-actin and Vinculin staining at junctional sites. (E-H) Western blot and quantification of pMLC2 (Thr18/Ser19), normalized to GAPDH, in HDLECs treated with 50μg/ml CM (E, G) or 30μM AA (F, H) at indicated timepoints. Data are expressed as fold changes compared to the average value of time (T)=0’. N=4 experiments. Error bars, SEM. ns, not significant, One-Way ANOVA with post-hoc Tukey test. (I) VE-Cadherin, Vinculin and LYVE1 staining of jejunum lacteals of wildtype mice. Arrowheads point to VE-Cadherin and Vinculin colocalization on button-like structures.
Figure 2.
Figure 2.. ROCK is required for lacteal junction opening and lipid uptake:
(A) Experimental strategy to induce Rock1/2 deletion in B-F. Arrowheads represent 3X75μg/g TAM injections, followed by analysis at P6. (B) VE-Cadherin and LYVE1 staining of jejunum lacteals from P6 Rock1/2f/f and Rock1/2iLKO mice. (C-D) Quantification of % lacteal zipper-like junctions normalized to total junction length, and lacteal length and width of P6 Rock1/2f/f and Rock1/2iLKO mice. Each dot represents one mouse. N=4 or 5 mice per group. Error bars, SEM. ns, not significant. Mann-Whitney U test. (E-F) Images of mesenteries and quantification of chyle-filled lymphatic collectors of P6 Rock1/2f/f and Rock1/2iLKO mice. Each dot represents one mouse. N=4 or 5 mice per group. Mann-Whitney U test. (G) Experimental strategy to induce Rock1/2 deletion in H-J. Arrowheads represent 3X75μg/g TAM injections, followed by analysis at P19–21. (H) VE-Cadherin and LYVE1 staining of jejunum lacteals from P19–21 Rock1/2f/f and Rock1/2iLKO mice. (I-J) Quantification of % lacteal zipper-like junctions, normalized to total junction length, and lacteal length and width from P19–21 Rock1/2f/f and Rock1/2iLKO mice. Each dot represents one mouse. N=4 or 5 mice per group. Error bars, SEM. ns, not significant. Mann-Whitney U test. (K) Survival curves of Rock1/2f/f and Rock1/2iLKO mice after 3X75μg/g TAM injections at P5, P6 and P7. N=7 or 14 mice per group. (L-M) Timeline of TAM administration (2mg/day for 5 days) and plasma triglyceride measurements of adult Rock1/2f/f and Rock1/2iLKO mice. Mice were fasted for 6 hours, gavaged with 200μl of olive oil, and plasma triglycerides were measured. N=9 or 15 mice per group. Error bars, SEM. Mann-Whitney U test was performed to compare Rock1/2f/f and Rock1/2iLKO groups at the same timepoints.
Figure 3.
Figure 3.. VEGFR2 activation zippers lymphatic capillary junctions:
(A-C) Western blot and quantifications of phospho-VEGFR2 (pY949 and pY1173), normalized to total VEGFR2, in jejunum tissue lysates from non-fed prenatal E20.5 and milk-fed P0.5 mice. Data are expressed as fold changes compared to the average value of E20.5. Each dot represents one mouse. N=8 mice per group. Error bars, SEM. Mann-Whitney U test. (D) Experimental strategy to induce Vegfr2 deletion or overexpression, shown in E-K. Arrowheads represent 3X75μg/g TAM injections, followed by analysis at P21. (E) VE-Cadherin and LYVE1 staining of jejunum lacteals from P21 Vegfr2f/f and Vegfr2iLKO mice 30 min after IV injection of PBS or 250ng/g VEGF-A. (F) Quantifications of jejunum lacteal length and width in P21 Vegfr2f/f and Vegfr2iLKO mice. Error bars, SEM. Each dot represents one mouse. N=4 mice per group. ns, not significant. Mann-Whitney U test. (G) Quantification of % zipper-like junctions out of total junction length in lacteals shown in E. Each symbol represents one mouse. N=4 or 5 mice per group. Error bars, SEM. One-Way ANOVA with post-hoc Tukey test. (H) pERK and LYVE1 staining of VEGFR2CA-tdTomato (+) and (−) ear dermal lymphatic capillaries of P21 iMB-Vegfr2;Prox1CreERT2 mice. CA: constitutive active. LV: lymphatic vessel. (I) Quantification of pERK intensity in VEGFR2CA-tdTomato (+) and (−) lymphatic vessels outlined in H. Each dot represents one mouse. N=4 mice per group. Error bars, SEM. Mann-Whitney U test. (J) VE-Cadherin, tdTomato and LYVE1 staining of ear dermal lymphatic capillaries from P21 iMB-Vegfr2;Prox1CreERT2 mice. (K) Quantification of zipper-like lymphatic junctions out of total lymphatic junction length in VEGFR2CA-tdTomato (+) and (−) lymphatic vessels in J. Each dot represents one mouse. N=6 mice per group. Error bars, SEM. Mann-Whitney U test.
Figure 4.
Figure 4.. VEGFR2 Y949 regulates permeability in blood but not in lymphatic vessels:
(A) Dextran leakage of jejunum villus blood vessels in P11-P13 Vegfr2Y949F/Y949F mice and wildtype littermates, 10 min after retro-orbital injection of fluorescent labeled IsoB4/dextran (70kDa) with 250ng/g VEGF-A or PBS. (B) Quantification of dextran leakage shown in A. Each symbol represents one mouse. N=4 mice per group. Error bars, SEM. ns, not significant. One-Way ANOVA with post-hoc Tukey test. (C) VE-Cadherin staining of jejunum lacteals from P21 wildtype and Vegfr2Y949F/Y949F mice 30 min after IV injection of PBS or 250ng/g VEGF-A. (D) Quantification of % zipper-like junctions out of total junction length in lacteals shown in C. Each symbol represents one mouse. N=4 or 6 mice per group. Error bars, SEM. ns, not significant. One-Way ANOVA with post-hoc Tukey test. (E) RNAseq analysis of SH2D2A (encoding TSAd), C-SRC and LYN differential expression in cultured HDLECs vs. HUVECs. Shown are transcript per million (TPM) values of the indicated genes. N=4 experiments. Error bars, SEM. Benjamini-Hochberg test. (F) Western blot analysis for the indicated proteins in HDLECs vs. HUVECs treated with 50ng/ml VEGF-A for 0, 5, 15 and 30 min. (G-L) Quantifications of the protein blots, normalized to GAPDH, shown in F. Data are expressed as fold changes compared to the average value of T=0’ of HUVEC group. Error bars, SEM. N=5 experiments. ns, not significant. Mann-Whitney U test was performed to compare HDLECs vs. HUVECs at the same timepoints.
Figure 5.
Figure 5.. VEGFR3 is required for VEGF-A/VEGFR2 induced lymphatic junction zippering:
(A) Timeline of experiments shown in B-G. Arrowheads represent 3X75 μg/g TAM injections and analysis at P21. (B) VE-Cadherin staining of jejunum lacteals from P21 Vegfr3f/f and Vegfr3iLKO littermates, 30 min after PBS or 250ng/g VEGF-A IV injection. (C) Quantification of % zipper-like junctions out of total junction length in lacteals shown in B. Each symbol represents one mouse. N=4 or 6 mice per group. Error bars, SEM. One-Way ANOVA with post-hoc Tukey test. (D) LYVE1 staining of jejunum lacteals of P21 Vegfr3f/f and Vegfr3iLKO mice. (E) Quantifications of lacteal width and length from D. Each dot represents one mouse. N=4 or 5 mice per group. Error bars, SEM. ns, not significant. Mann-Whitney U test. (F) VEGFR2 and LYVE1 staining of jejunum villi from P21 Vegfr3f/f and Vegfr3iLKO mice. LV: lymphatic vessel. BV: blood vessel. (G) Quantification of VEGFR2 intensity in the lacteals outlined in F. Data were normalized to the average VEGFR2 intensity of Vegfr3f/f lacteals. Each dot represents one mouse. N=4 or 5 mice per group. Error bars, SEM. ns, not significant. Mann-Whitney U test. (H) qPCR analysis of VEGFR2 and VEGFR3 expression in HDLECs 2 days after transfection with control (CTRL) or VEGFR3 siRNA. N=4 experiments. Error bars, SEM. ns, not significant. Mann-Whitney U test. (I-J) Western blots and quantifications of VEGFR2, ERK and AKT phosphorylation, normalized to the indicated loading controls, in HDLECs transfected with siCTRL or siVEGFR3 and treated with 50ng/ml VEGF-A for 0, 5, 15 and 30 min. Data are expressed as fold changes compared to the average value of T=0’ of siCTRL group. N=5 experiments. Error bars, SEM. ns, not significant. Mann-Whitney U test was performed to compare siCTRL vs. siVEGFR3-treated groups at the same timepoints.
Figure 6.
Figure 6.. PI3K/AKT signaling mediates VEGF-A-induced lymphatic junction zippering:
(A) VE-Cadherin staining of jejunum lacteals from P21 wildtype, Akt1KO and Wortmannin-treated mice, 30 min after IV administration of PBS or 250ng/g VEGF-A. (B) Quantification of % zipper-like junctions out of total junction length in lacteals shown in A. Each symbol represents one mouse. N=4 or 6 mice per group. Error bars, SEM. ns, not significant. One-Way ANOVA with post-hoc Tukey test. (C) LYVE-1 staining and (D) quantifications of length and width of jejunum lacteals from P21 wildtype and Akt1KO mice. Each dot represents one mouse. N=4 mice per group. Error bars, SEM. ns, not significant. Mann-Whitney U test. (E) Experimental strategy to induce Plcγ or Erk2 deletion in F-G. Arrowheads indicate 3X75μg/g TAM injections and analysis at P21. (F) VE-Cadherin staining of jejunum lacteals from P21 PlcγiLKO and Erk1KO;Erk2iLKO mice 30 min after IV injection of PBS or 250ng/g VEGF-A. (G) Quantification of % zipper-like junctions out of total junction length in lacteals shown in F. Each symbol represents one mouse. N=4 to 5 mice per group. Error bars, SEM. Mann-Whitney U test.
Figure 7.
Figure 7.. VEGF-A/VEGFR2 inhibits stress fiber formation in HDLECs:
(A) VE-Cadherin and phalloidin staining of confluent HUVECs and HDLECs starved in 0.2% serum for 6 hours and treated with 50ng/ml VEGF-A or PBS for 30 min. (B) Western blot and quantification of pMLC2 (Thr18/Ser19), normalized to TUBULIN, in confluent HUVECs and HDLECs starved for 6 hours and stimulated with 50ng/ml VEGF-A for 0, 5, 15 and 30 min. Data are expressed as fold changes compared to the average value of T=0’ of each cell group. N=6 experiments. Error bars, SEM. ns, not significant. One-Way ANOVA with post-hoc Tukey test (for HDLEC), or Welch’s ANOVA with post-hoc Dunnett T3 test (for HUVEC). (C-D) RhoA and RAC1 pulldown assays in HDLECs transfected with CTRL or VEGFR2 siRNA and treated with 50ng/ml VEGF-A for 30 min. Top panel: Western blots of GTP-bound RhoA/RAC1 from the pulldown assay and total RhoA/RAC1 from total cell lysates. Bottom panel: Quantifications of the ratios of GTP bound RhoA/RAC1 to total RhoA/RAC1. Data are expressed as fold changes compared to the average value of T=0’ of each siRNA-treated group. N=4–5 experiments. Error bars, SEM. ns, not significant. Mann-Whitney U test. (E) RAC1 pulldown assay in HDLECs after 5 hours Wortmannin (1μM) or DMSO treatment and 30 min VEGF-A (50ng/ml) stimulation. Shown are western blots (top) and quantification (bottom) of the ratios of GTP bound RAC1 to total RAC1 from cell lysates. Data are expressed as fold changes compared to the average value of T=0’ of each treatment group. N=5 experiments. Error bars, SEM. ns not significant. Mann-Whitney U test.
Figure 8.
Figure 8.. VEGF-A and ROCK signaling regulate dermal initial lymphatic drainage:
(A) VE-Cadherin staining of ear dermal initial lymphatics from P21 wildtype mice 30 min after intradermal injection of VEGF-A (50ng in 20μl PBS), histamine (500ng in 20μl PBS), bradykinin (20μg in 20μl PBS) or PBS alone. (B) Quantification of % zipper-like LEC junctions out of total lymphatic junction length in dermal initial lymphatics in A. Each symbol represents one mouse. N=6 or 7 mice per group. Error bars, SEM. ns, not significant. One-Way ANOVA with post-hoc Tukey test. (C) Experiment strategy to induce Rock1/2 deletion shown in panels D-E. Arrowheads represent 3X75μg/g TAM injections and analysis at P19–21. (D-E) VE-Cadherin staining and quantification of % zipper-like junctions out of total junction length in ear dermal initial lymphatics from P19–21 Rock1/2f/f and Rock1/2iLKO mice. Each symbol represents one mouse. N=4 mice per group. Error bars, SEM. Mann-Whitney U test. (F) Evans Blue absorption in lower leg lymphatic vessels of adult wildtype mice at the indicated time points after footpad injection of VEGF-A (20ng in 5μl PBS) or PBS alone, and 5μl of 1.5% Evans Blue solution. (G) Quantification of dye intensity in Evans Blue-filled lymphatics in F. N=7 or 9 mice per group. Error bars, SEM. Mann-Whitney U test was performed to compare PBS and VEGF-A-treated groups at the same timepoints. (H) Timeline of TAM administration (2mg per day for 5 days) of adult Rock1/2f/f and Rock1/2iLKO mice. All mice were analyzed 10 days after the last TAM injection. (I) Evans Blue uptake in lower leg lymphatic vessels of Rock1/2f/f and Rock1/2iLKO mice at the indicated time points after intradermal footpad injection of 9μl 1.5% Evans Blue solution. (J) Quantification of dye intensity in Evans Blue-filled lymphatics in I. N=7–8 mice per group. Error bars, SEM. ns, not significant. Mann-Whitney U test was performed to compare Rock1/2f/f and Rock1/2iLKO mouse groups at the same timepoints. (K) Summary model of LEC junction remodeling in intestinal lacteals. i. High lipid uptake: Chylomicrons derived from ingested lipids activate ROCK (1), which phosphorylates MLC2 and induces actomyosin stress fiber assembly and junction opening, thereby enabling lacteal chylomicron uptake. VEGFR2 is inhibited by chylomicron upregulation of VEGFR1 and NRP1 in BECs, which reduce VEGF-A signals to LEC VEGFR2 (2). ii. Low lipid uptake: VEGF-A signals via VEGFR2/VEGFR3 heterodimers to antagonize ROCK activation and junction opening. VEGFR2/VEGFR3 activate RAC1 via PI3K/AKT, thereby reducing RhoA and ROCK-dependent MLC2 phosphorylation, resulting in actin stress fiber relaxation, cortical actin formation and junction zippering, which prevents chylomicron uptake by lacteals.

Comment in

References

    1. Jackson DG. Leucocyte Trafficking via the Lymphatic Vasculature- Mechanisms and Consequences. Front Immunol. 2019;10:471. doi: 10.3389/fimmu.2019.00471 - DOI - PMC - PubMed
    1. Cifarelli V, Eichmann A. The Intestinal Lymphatic System: Functions and Metabolic Implications. Cell Mol Gastroenterol Hepatol. 2019;7:503–513. doi: 10.1016/j.jcmgh.2018.12.002 - DOI - PMC - PubMed
    1. Petrova TV, Koh GY. Organ-specific lymphatic vasculature: From development to pathophysiology. J Exp Med. 2018;215:35–49. doi: 10.1084/jem.20171868 - DOI - PMC - PubMed
    1. Baluk P, Fuxe J, Hashizume H, Romano T, Lashnits E, Butz S, Vestweber D, Corada M, Molendini C, Dejana E, et al. Functionally specialized junctions between endothelial cells of lymphatic vessels. J Exp Med. 2007;204:2349–2362. - PMC - PubMed
    1. Zhang F, Zarkada G, Yi S, Eichmann A. Lymphatic Endothelial Cell Junctions: Molecular Regulation in Physiology and Diseases. Front Physiol. 2020;11:509. doi: 10.3389/fphys.2020.00509 - DOI - PMC - PubMed

Publication types

MeSH terms

Substances