. 2023 Aug 4;133(4):353-365.
doi: 10.1161/CIRCRESAHA.122.322337. Epub 2023 Jul 18.

Brown Adipose Tissue and BMP3b Decrease Injury in Cardiac Ischemia-Reperfusion

Affiliations

Brown Adipose Tissue and BMP3b Decrease Injury in Cardiac Ischemia-Reperfusion

Íngrid Martí-Pàmies et al. Circ Res. .

Abstract

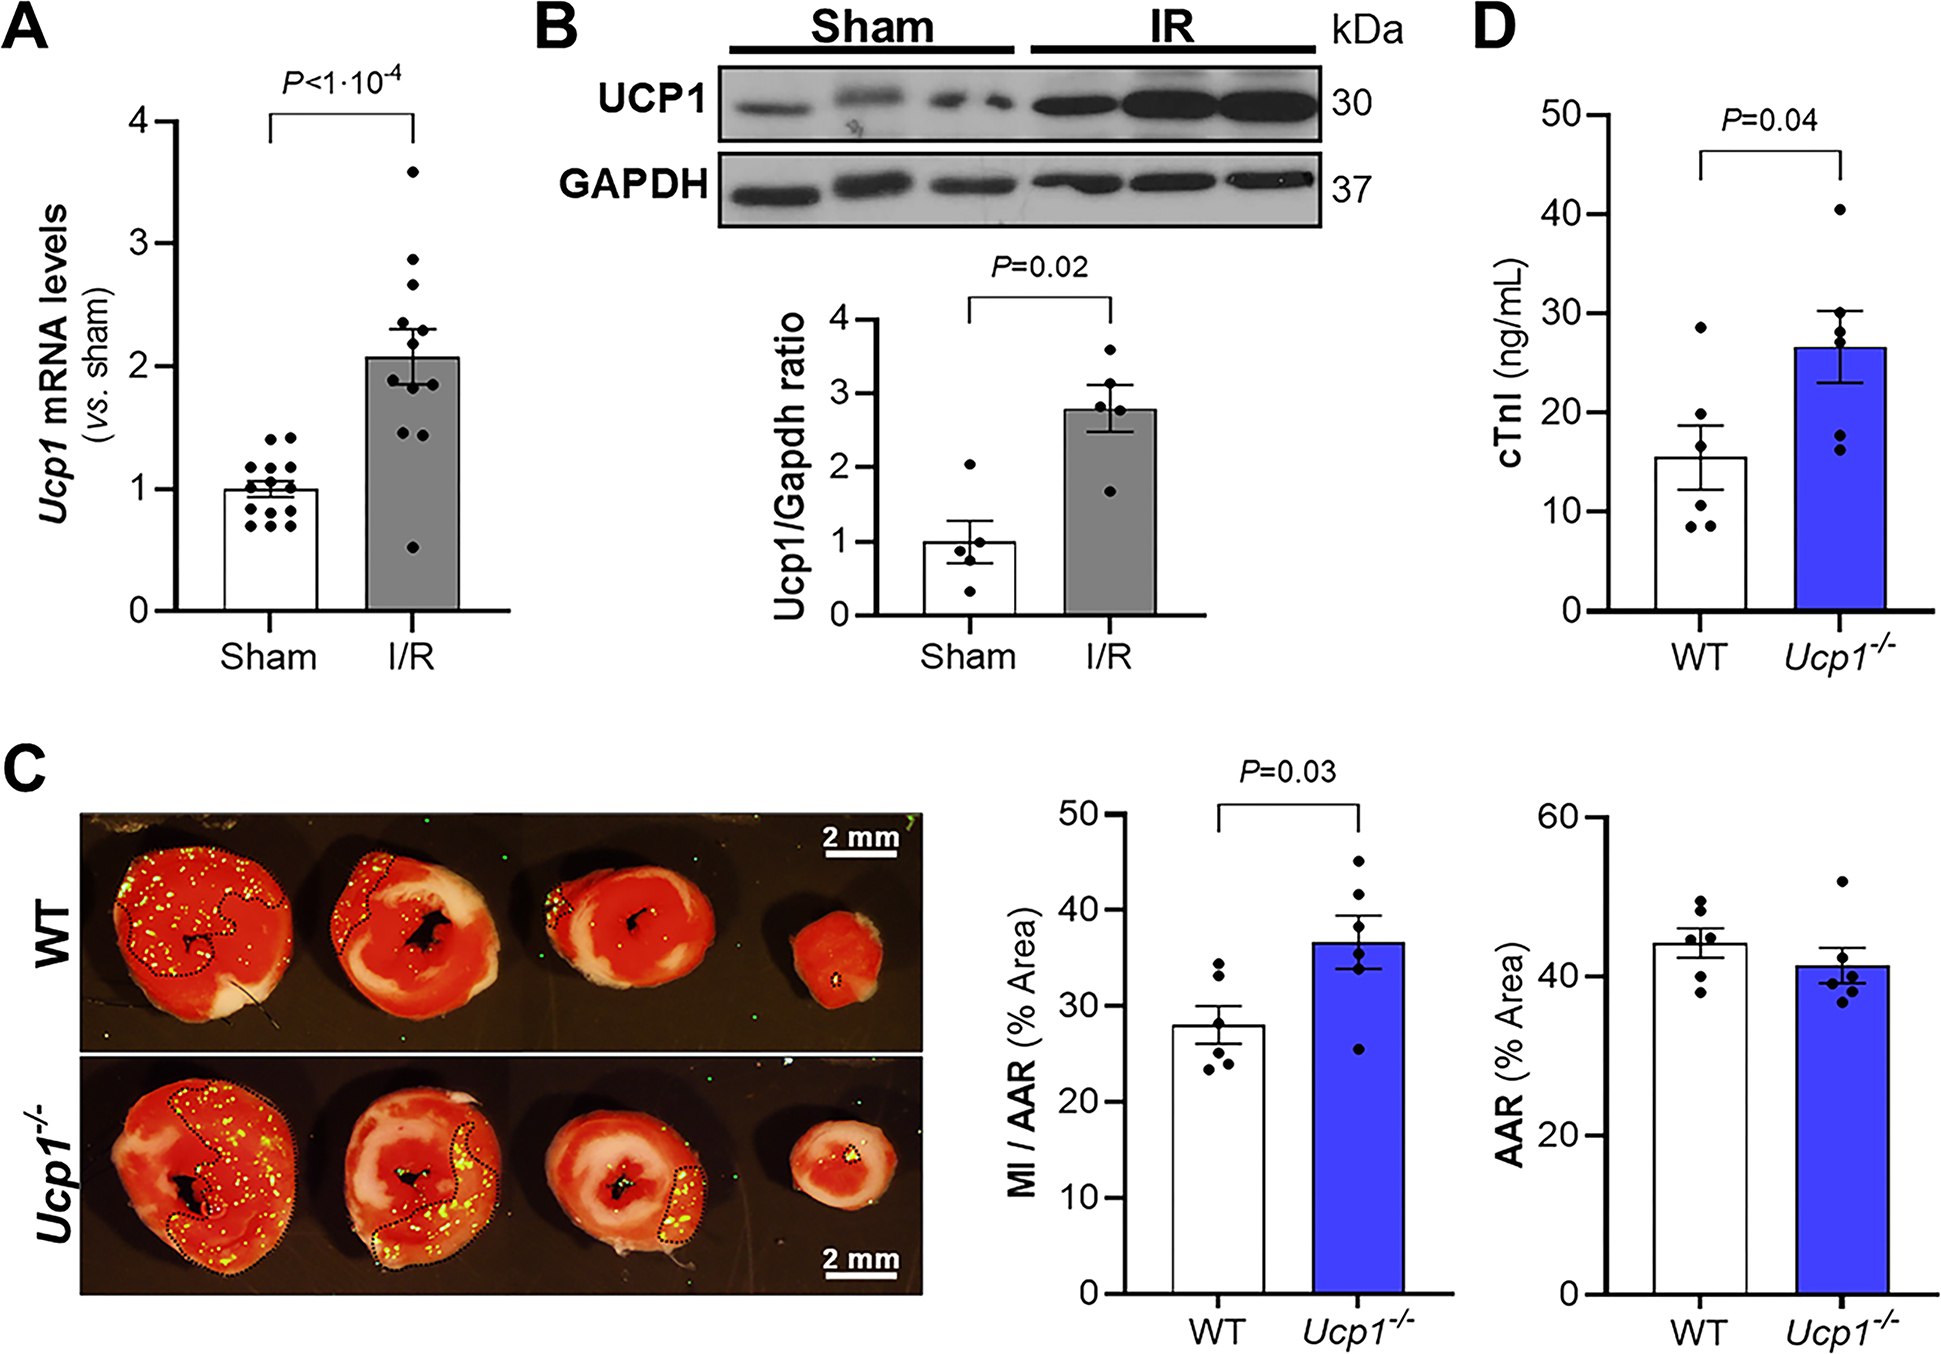
Background: Despite advances in treatment, myocardial infarction (MI) is a leading cause of heart failure and death worldwide, with both ischemia and reperfusion (I/R) causing cardiac injury. A previous study using a mouse model of nonreperfused MI showed activation of brown adipose tissue (BAT). Recent studies showed that molecules secreted by BAT target the heart. We investigated whether BAT attenuates cardiac injury in I/R and sought to identify potential cardioprotective proteins secreted by BAT.

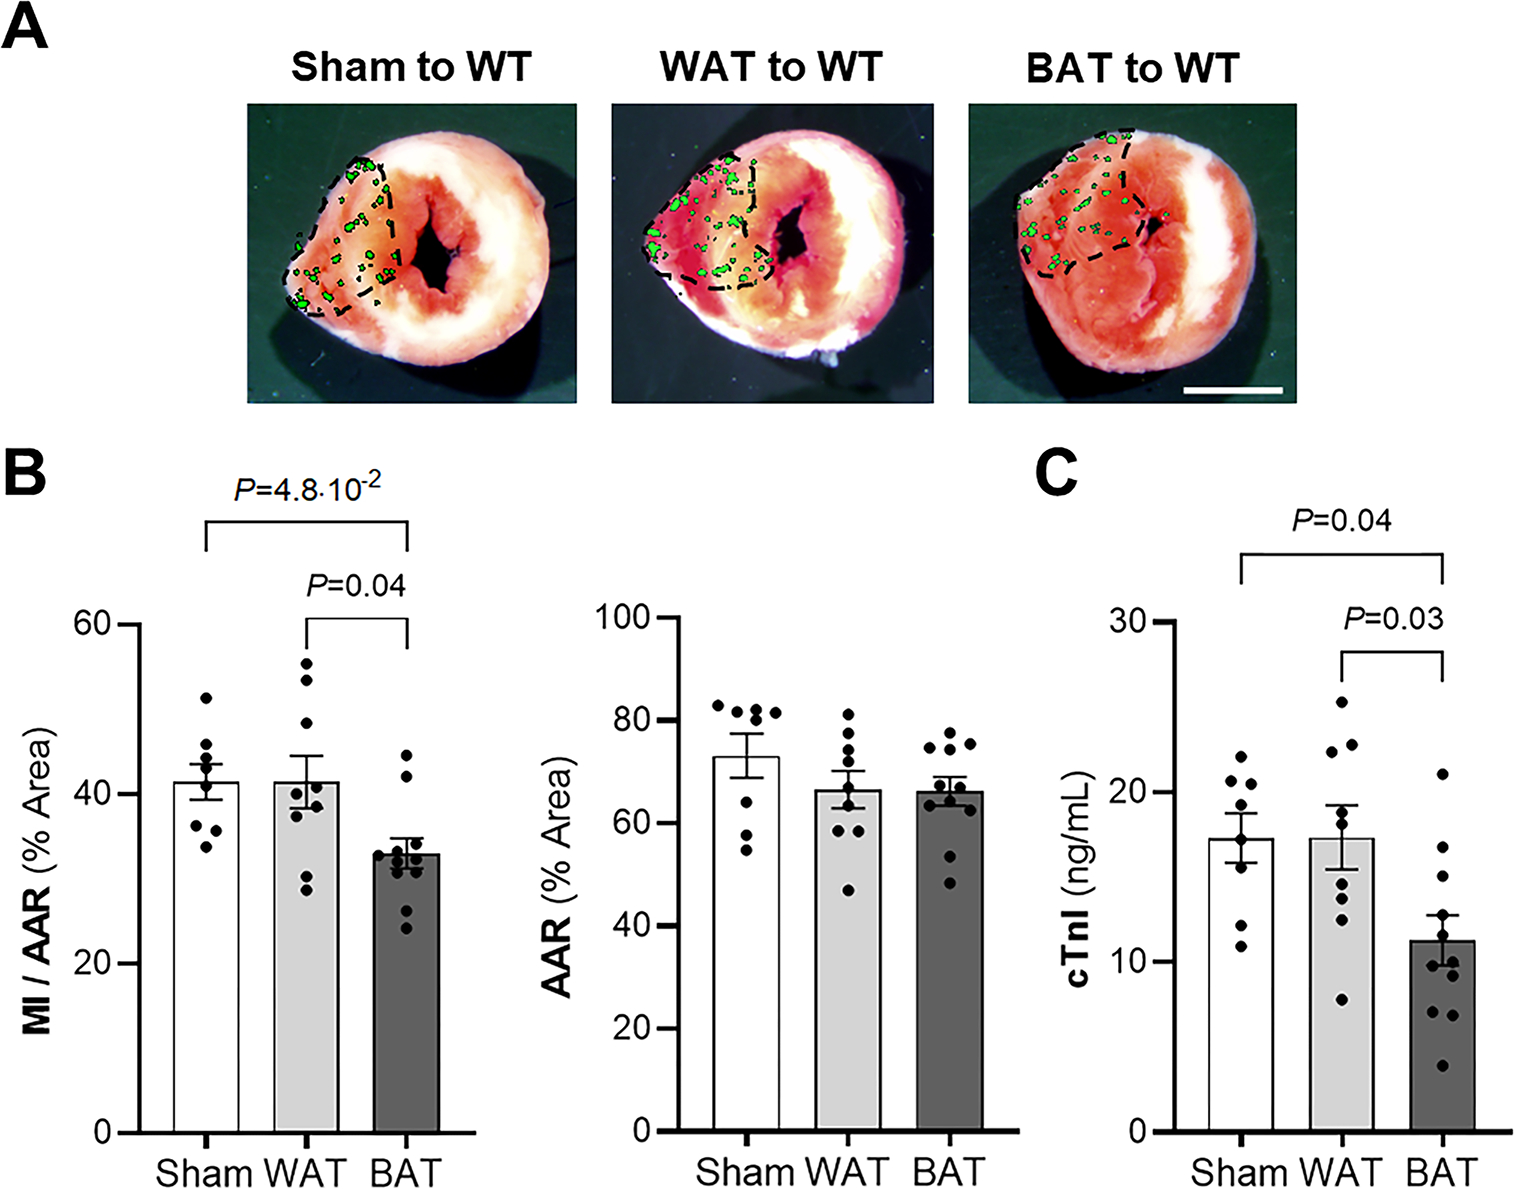
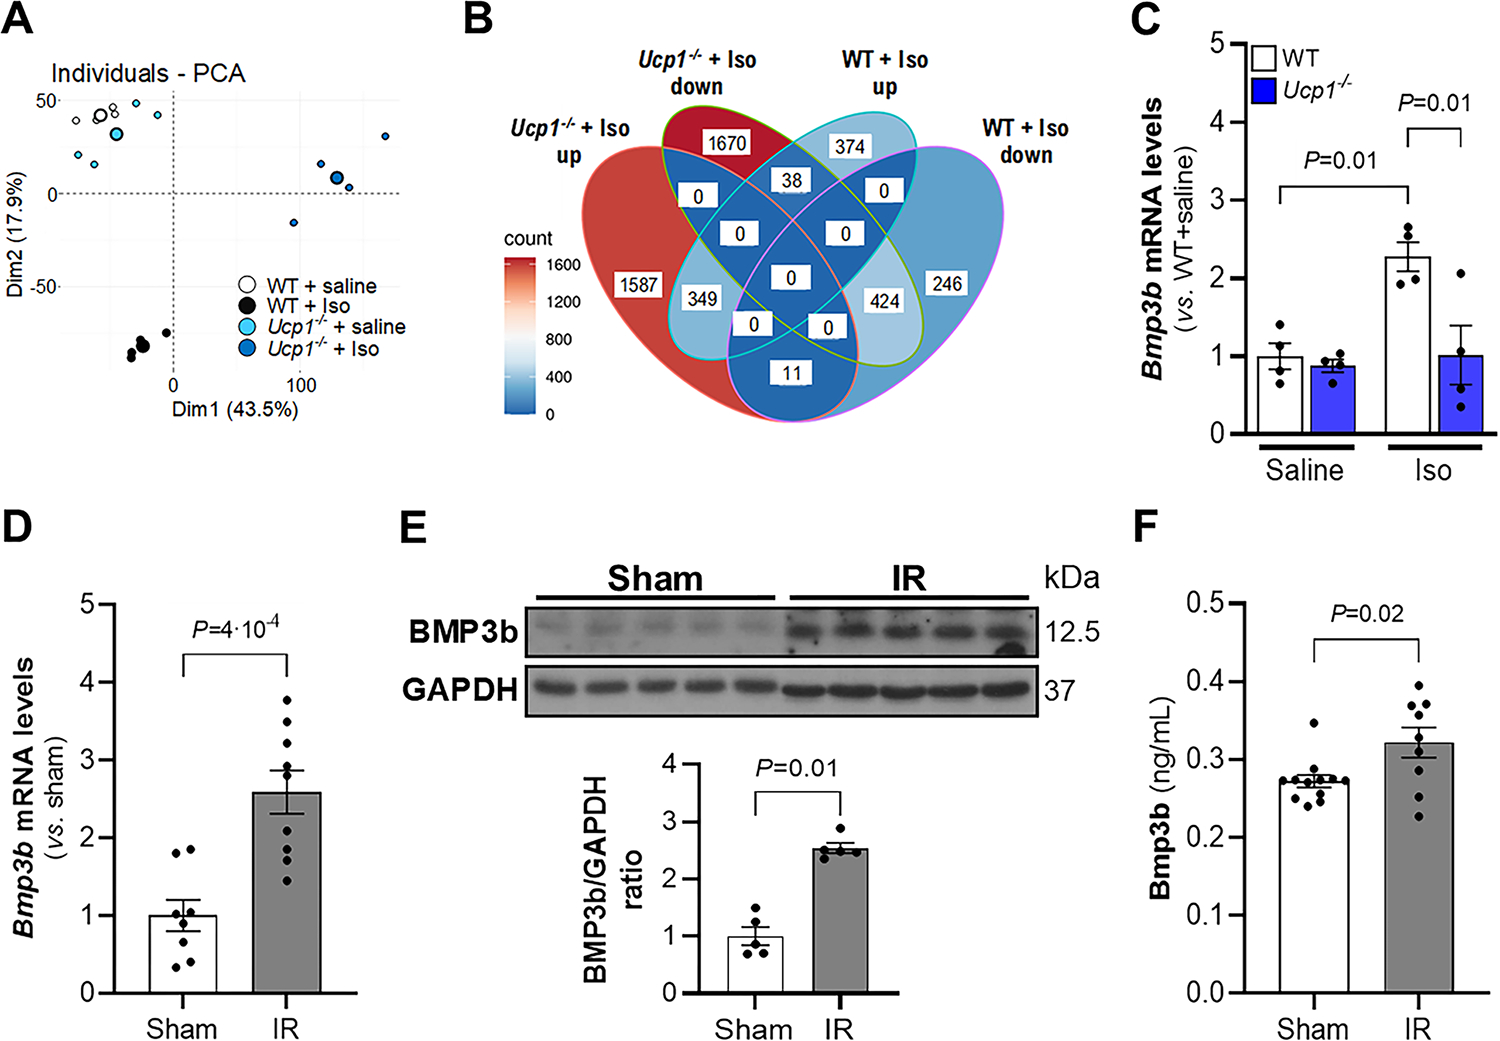
Methods: Myocardial I/R surgery with or without BAT transplantation was performed in wild-type (WT) mice and in mice with impaired BAT function (uncoupling protein 1 [Ucp1]-deficient mice). To identify potential cardioprotective factors produced by BAT, RNA-seq (RNA sequencing) was performed in BAT from WT and Ucp1-/- mice. Subsequently, myocardial I/R surgery with or without BAT transplantation was performed in Bmp3b (bone morphogenetic protein 3b)-deficient mice, and WT mice subjected to myocardial I/R were treated using BMP3b.

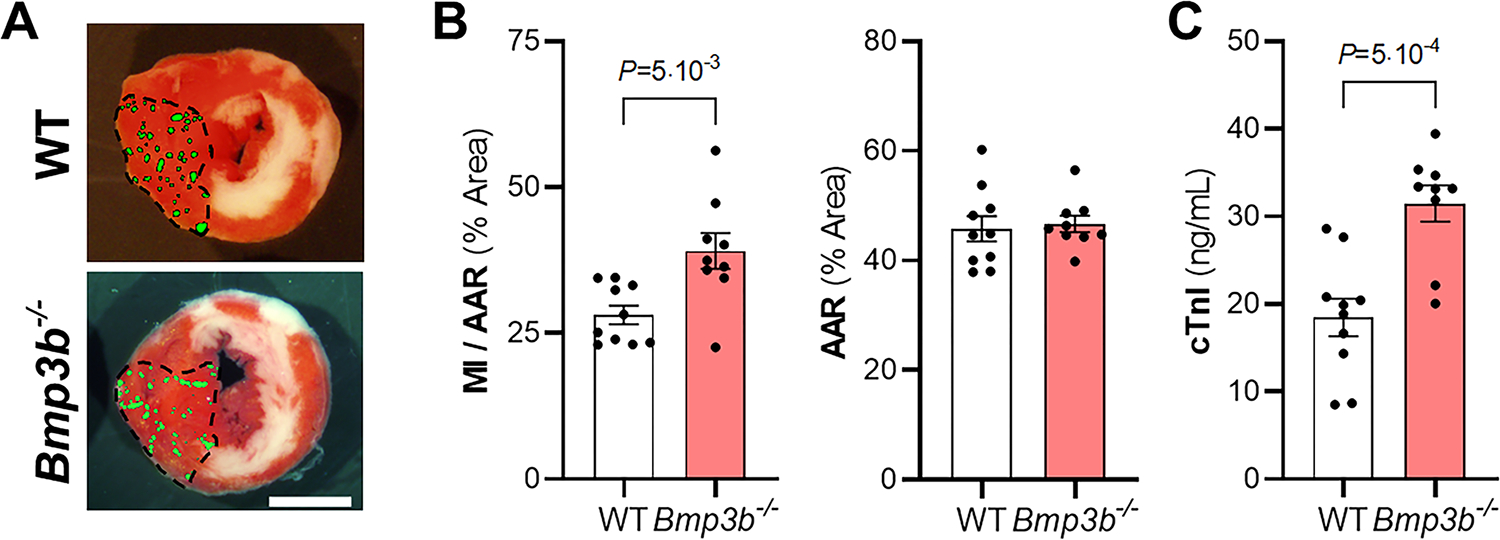
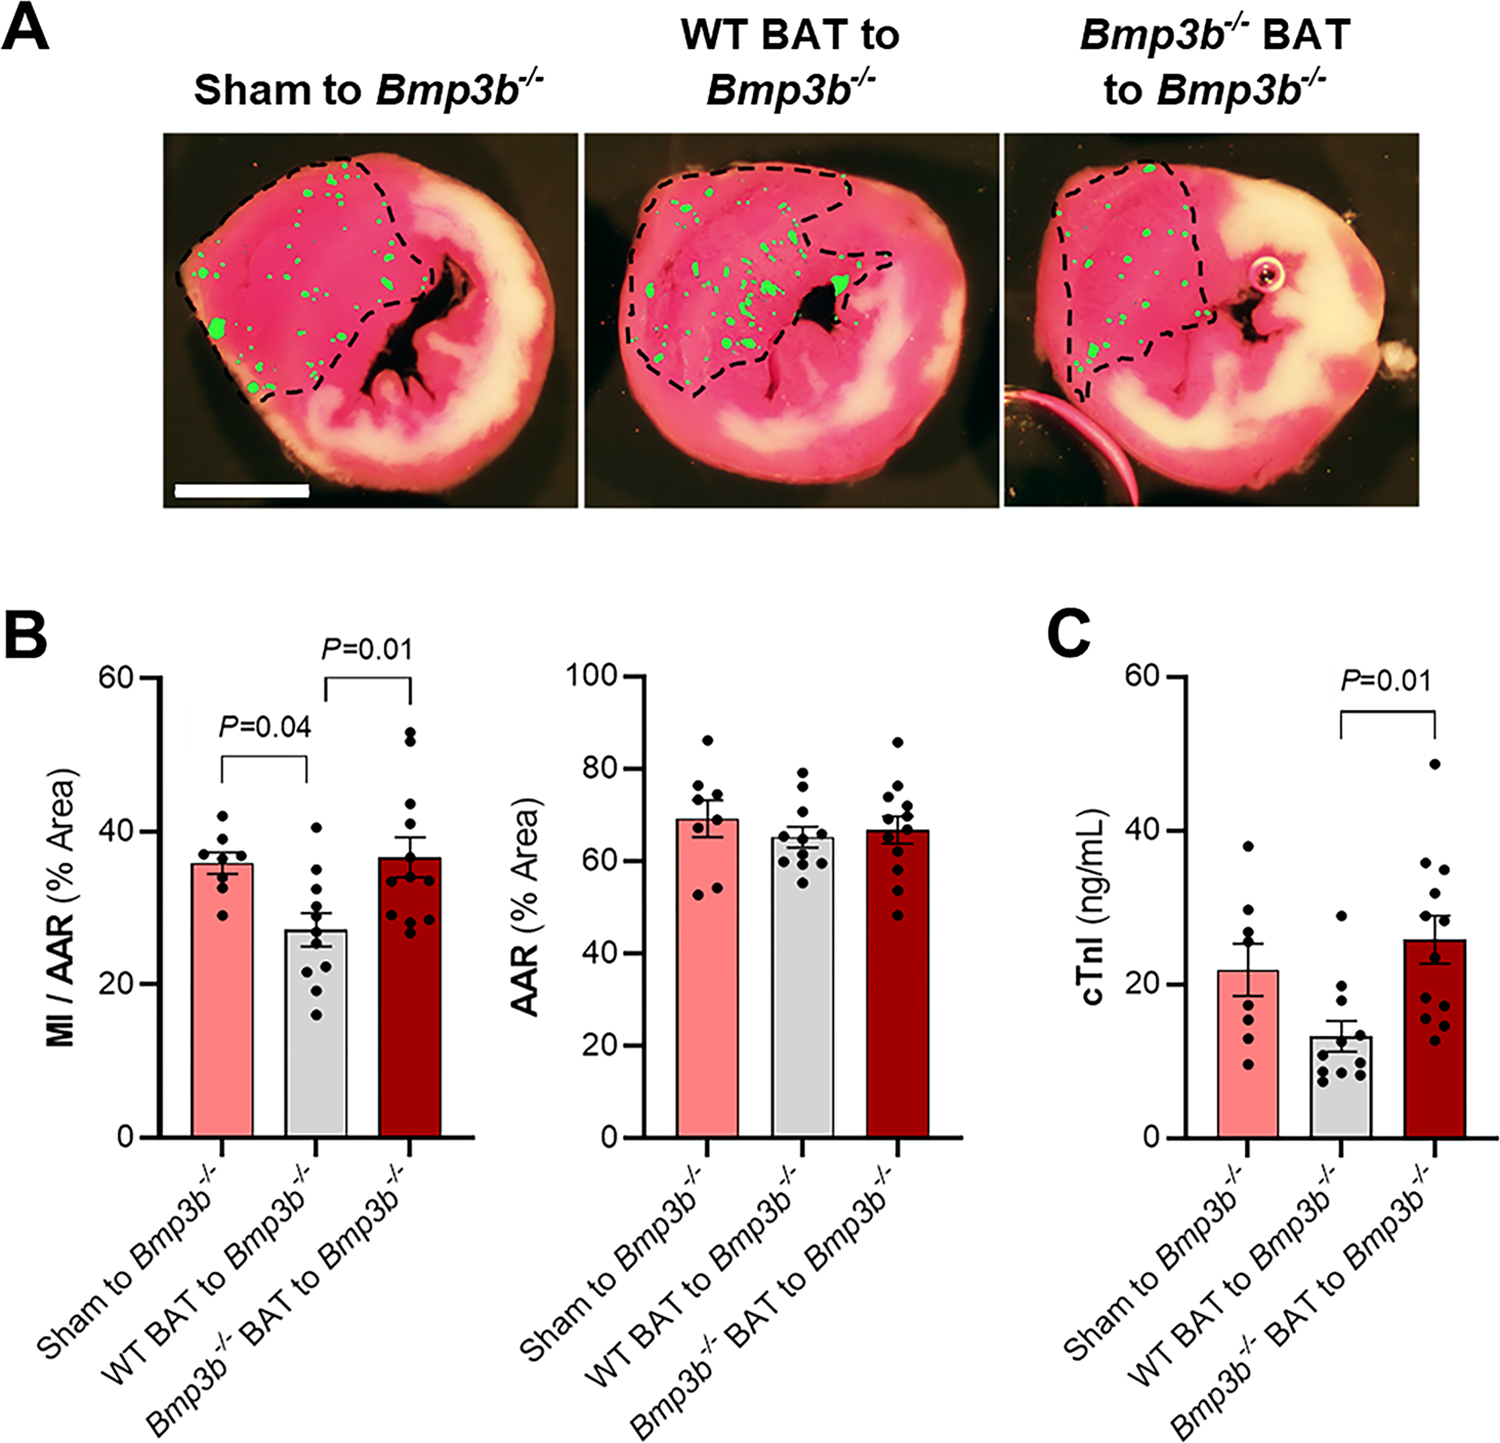
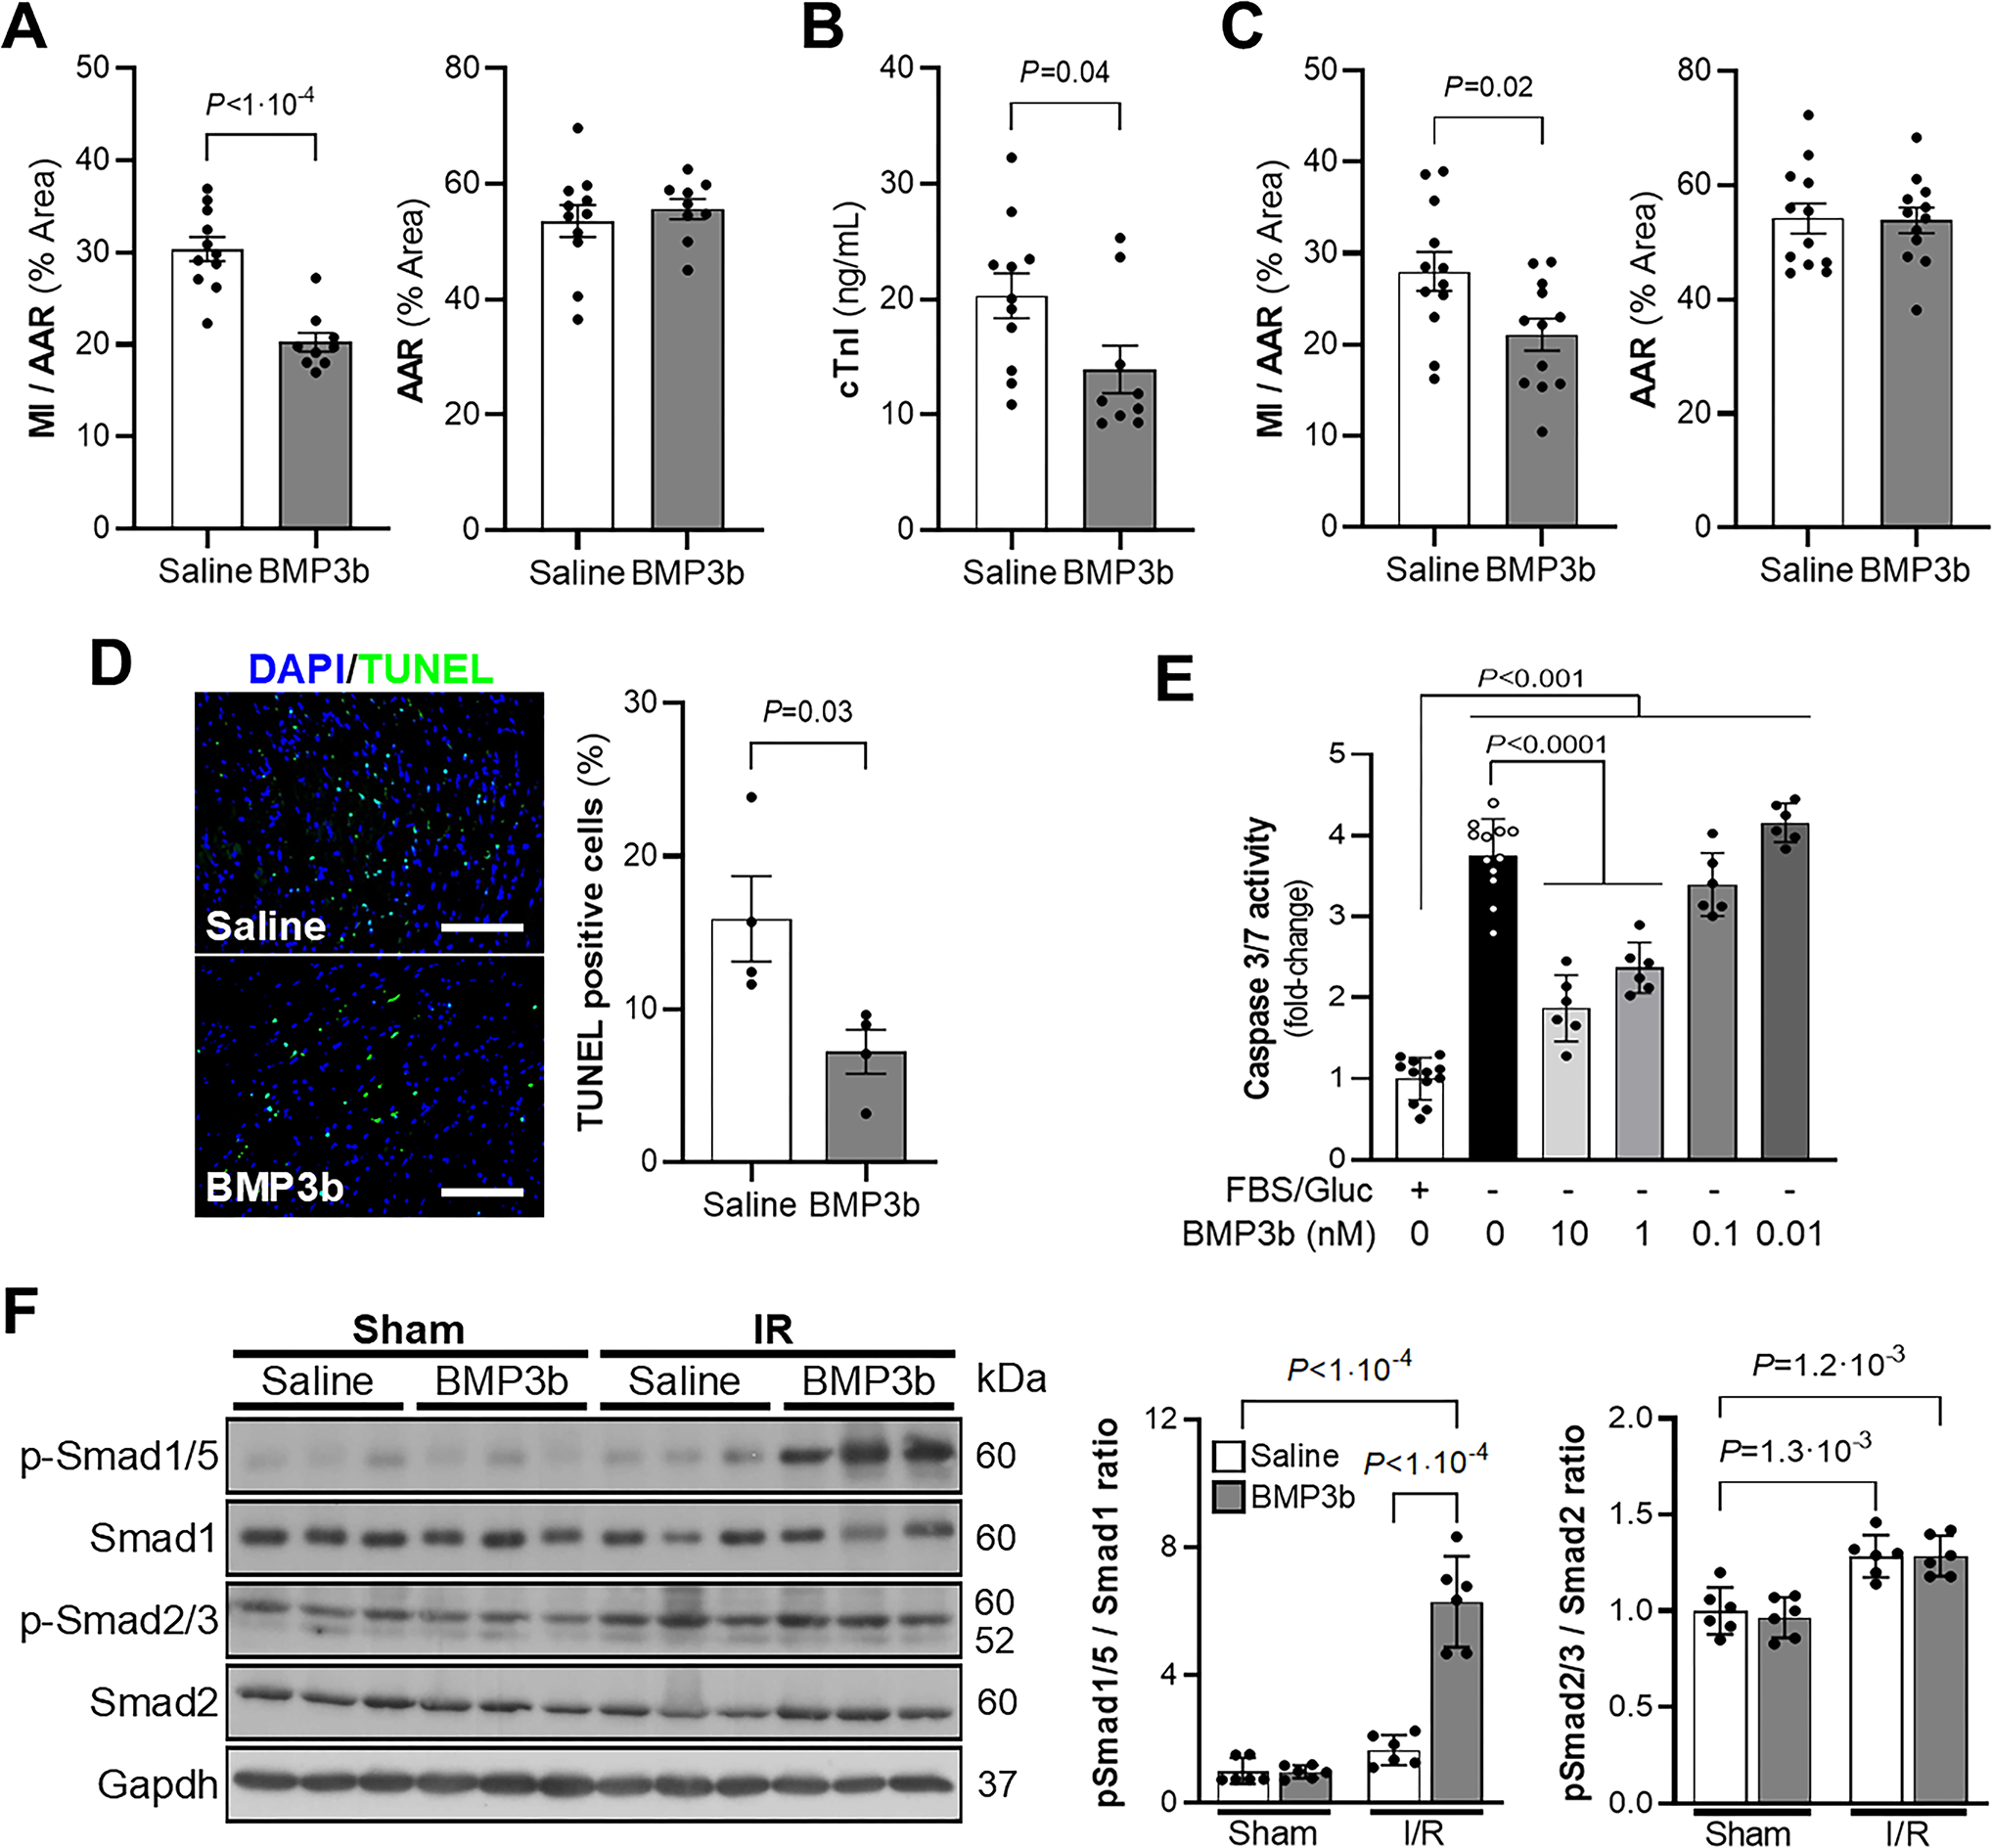
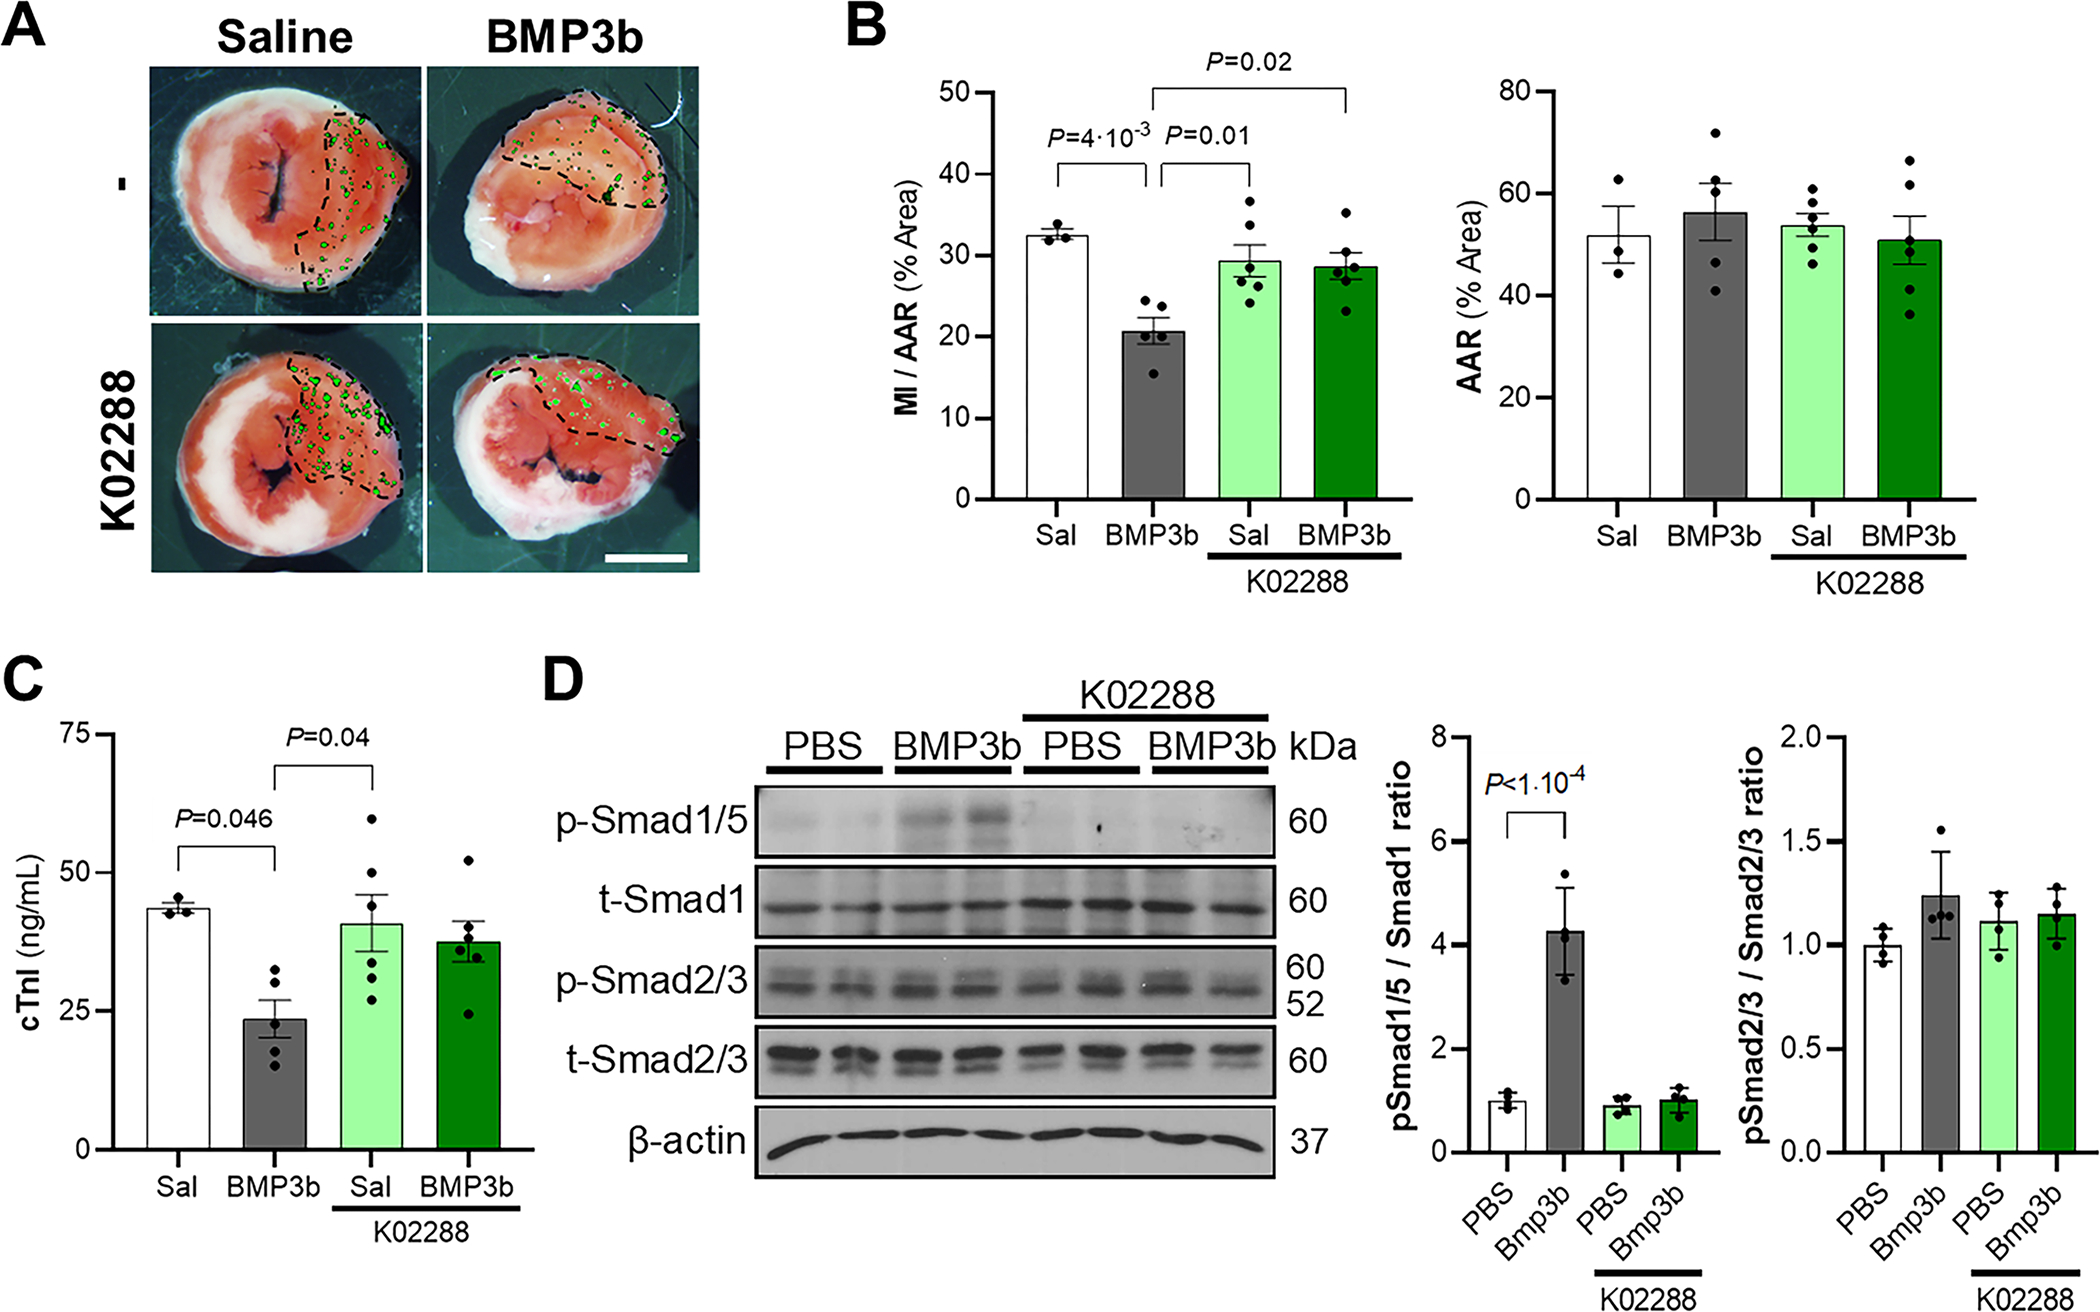
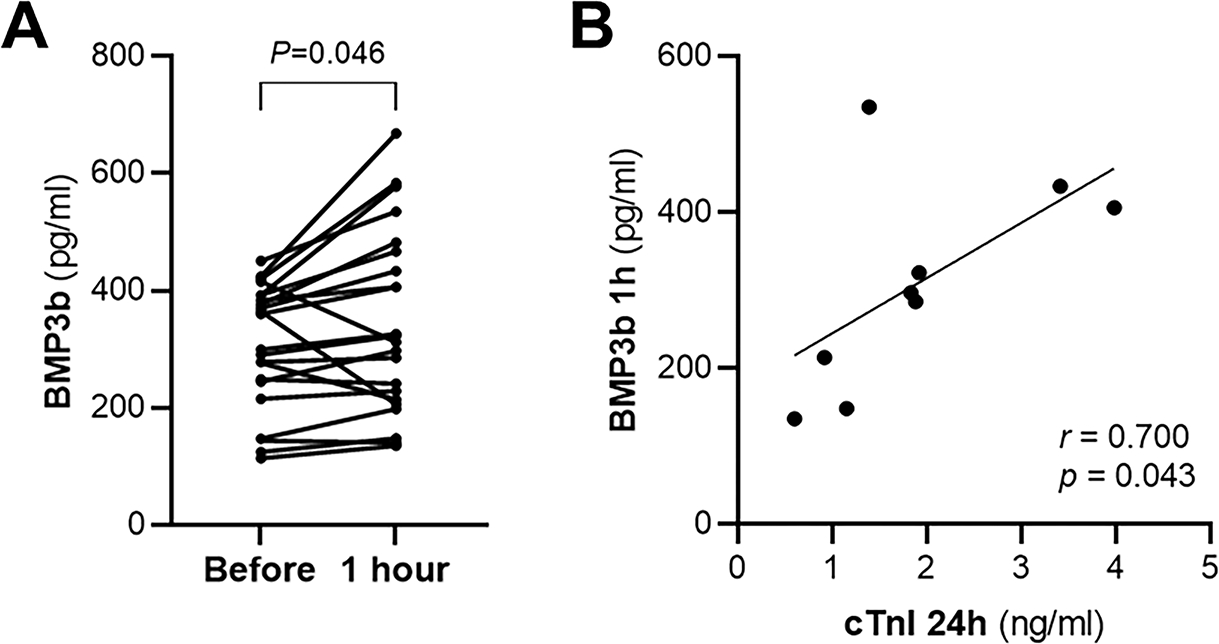
Results: Dysfunction of BAT in mice was associated with larger MI size after I/R; conversely, augmenting BAT by transplantation decreased MI size. We identified Bmp3b as a protein secreted by BAT after I/R. Compared with WT mice, Bmp3b-deficient mice developed larger MIs. Increasing functional BAT by transplanting BAT from WT mice to Bmp3b-deficient mice reduced I/R injury whereas transplanting BAT from Bmp3b-deficient mice did not. Treatment of WT mice with BMP3b before reperfusion decreased MI size. The cardioprotective effect of BMP3b was mediated through SMAD1/5/8. In humans, the plasma level of BMP3b increased after MI and was positively correlated with the extent of cardiac injury.

Conclusions: The results of this study suggest a cardioprotective role of BAT and BMP3b, a protein secreted by BAT, in a model of I/R injury. Interventions increasing BMP3b levels or targeting Smad 1/5 may represent novel therapeutic approaches to decrease myocardial damage in I/R injury.

Keywords: heart failure; mice; myocardium; reperfusion; uncoupling protein 1.


Conflict of interest statement

Disclosures None.

Figures

Figure 1.
Figure 1.. BAT is activated by myocardial I/R and Ucp1-deficiency increases myocardial injury after I/R.
Wild-type mice were subjected to myocardial I/R or to a sham procedure. BAT was isolated, the level of Ucp1 mRNA was measured using real time qPCR (A, Sham, n = 14; I/R, n = 12) and the levels of Ucp1 protein were determined by immunoblot (B, n = 5 mice for each condition). Gapdh was used as a loading control. In the lower panel of B, the graph shows the densitometric analysis of Western blots. Values expressed as means ± SE. *P < 0.05 vs. sham. C) Representative images of Triphenyltetrazolium chloride (TTC) staining and fluorescent microspheres distribution (green dots) of myocardial sections from WT and Ucp1−/− mice 24 h after reperfusion. The viable non-ischemic area is shown in green dots and delineated with black dotted line; the ischemic area (area at risk, AAR) is the region without green dots; and the infarcted area (myocardial infarction, MI), appears in white. The MI area and the AAR from each section were measured using Image J. The ratio of MI area to AAR (MI/AAR) and AAR are shown (right side of panel C, n = 6 mice for each condition). Values expressed as means ± SE. *P < 0.05 vs. WT. D) The level of cardiac troponin I (cTnI) was measured 24 h after reperfusion injury in WT and Ucp1−/− mice. (n = 6 mice for each condition). Values expressed as means ± SE. *P < 0.05 vs. WT. P values were determined by unpaired Student t-test (A, C and D) and Mann-Whitney test (B).
Figure 2.
Figure 2.. Increasing functional brown adipose tissue (BAT) in WT mice limits I/R injury.
Wild-type (WT) mice received BAT transplant, white adipose tissue (WAT) transplant (both from WT mice donors) or underwent a sham procedure. Representative images (A) and quantitative analysis (B) of Triphenyltetrazolium chloride (TTC) staining of myocardial infarction (MI) to area-at-risk (AAR) (MI/AAR) and AAR. The MI/AAR and AAR were measured after 45 min of ischemia and 24 h of reperfusion. (Sham, n = 8; WAT, n = 9; BAT, n = 11). Values are means ± SE. Scale bar: 2 mm. C) The level of cardiac troponin I (cTnI) was measured in plasma by ELISA 24 h after ischemia-reperfusion injury in sham, WAT and BAT transplant to WT mice. (Sham, n = 8; WAT, n = 9; BAT, n = 11). Values expressed as means ± SE. P values were determined by one-way ANOVA with Tukey correction (B and C).
Figure 3.
Figure 3.. Identification of BMP3b as a potential BAT adipokine using RNA-Seq.
A) Principal component analysis (PCA) of RNA-Seq data from WT and Ucp1−/− treated with saline or isoproterenol (Iso) during 3 days (60 mg/kg/day). Each small point represents an RNA-Seq sample (n = 4), and bigger points represent the average of the group data for each condition. B) Venn diagram of differentially expressed genes increased (up) or decreased (down) by isoproterenol (Iso) treatment in comparison to saline treatment in WT and Ucp1−/− mice. C) Gene expression of Bmp3b was assessed by real-time PCR in BAT in WT and Ucp1−/− mice after saline or isoproterenol (Iso) infusion for 3 days (n = 4 in each group). Values are means ± SE. Bmp3b was assessed by real-time PCR (D) and by Western blot (E) in BAT 24 h after sham or myocardial ischemia-reperfusion (IR) surgery in WT mice (real-time PCR: Sham, n = 8; IR, n = 9; Western blot: n = 5 each group). Results are expressed as means ± SE. F) Bmp3b plasma levels were quantified by ELISA 24 h after sham or myocardial ischemia-reperfusion (IR) surgery in WT mice (Sham, n = 12; IR, n = 9;). Results are expressed as means ± SE. P values were determined by unpaired Student t-test (D and F) and Mann-Whitney test. (B) Normality was assessed by Shapiro-Wilk test and P values were determined by two-way ANOVA with Tukey correction.
Figure 4.
Figure 4.. Bmp3b deficiency in mice increases myocardial I/R injury.
WT and Bmp3b−/− mice were subjected to myocardial I/R injury. A) Representative images of Triphenyltetrazolium chloride (TTC) staining and fluorescent microsphere distribution (green dots) of myocardial sections 24 h after reperfusion. Scale bar: 2 mm. B) Myocardial infarction (MI) to area-at-risk (AAR) (MI/AAR) and AAR were measured after 45 min ischemia and 24 h reperfusion (WT, n = 10; Bmp3b−/−, n = 9). Values are means ± SE. C) The level of cardiac troponin I (cTnI) was measured in plasma by ELISA 24 h after I/R injury in WT and Bmp3b−/− mice (WT, n = 10; Bmp3b−/−, n = 9). Values expressed as means ± SE. P values were determined by unpaired Student t-test (B and C).
Figure 5.
Figure 5.. Restoring functional brown adipose tissue (BAT) in Bmp3b−/− mice decreases myocardial I/R injury.
Bmp3b−/− mice received BAT transplant from Bmp3b−/− mice, from WT mice, or underwent a sham procedure. A) Representative images of Triphenyltetrazolium chloride (TTC) staining and fluorescent microsphere distribution (green dots) of myocardial sections 24 h after I/R. Scale bar: 2 mm. B) Myocardial infarction (MI) to area-at-risk (AAR) (MI/AAR) and AAR were measured after 45 min ischemia and 24 h reperfusion (Sham to Bmp3b−/−, n = 8; WT BAT to Bmp3b−/−, n = 11; Bmp3b−/− BAT to Bmp3b−/−, n = 12). Values expressed as means ± SE. C) The level of cardiac troponin I (cTnI) was measured in plasma by ELISA 24 h after I/R injury. (Sham to Bmp3b−/−, n = 8; WT BAT to Bmp3b−/−, n = 11; Bmp3b−/− BAT to Bmp3b−/−, n = 12). Values expressed as means ± SE. P values were determined by one-way ANOVA with Tukey correction (B and C).
Figure 6.
Figure 6.. Treatment with BMP3b decreases myocardial infarction (MI) size in WT mice.
A) Wild-type mice were treated with saline or BMP3b (10 ng/g body weight, immediately before ischemia and the second immediately before reperfusion) and underwent I/R surgery. Heart slices were analyzed 24 h after reperfusion to obtain the ratio of (MI) to area at risk (AAR) (MI/AAR) and AAR are shown (Saline, n = 11; BMP3b, n = 9). Values expressed as means ± SE. B) The level of cardiac troponin I (cTnI) was measured in plasma by ELISA 24 h after I/R injury in WT mice treated with saline or BMP3b (10 ng/g body weight, immediately before ischemia and immediately before reperfusion; Saline, n = 11; BMP3b, n = 9). Values expressed as means ± SE. C) Wild-type mice underwent I/R surgery and were treated with saline or BMP3b (50 ng/g body weight, immediately before reperfusion). The MI/AAR ratio and AAR were analyzed 24 h after reperfusion (n = 12 mice each group). Values expressed as means ± SE. D) Representative images and quantification of TUNEL staining on the heart sections from saline and BMP3b (10 ng/g body weight) treated mice subjected to I/R injury. (n = 4 mice each group). Values expressed as means ± SE. Scale bar: 100 μm. E) Caspase-3 activity was measured in rat neonatal cardiomyocytes (RNCM), starved of glucose and FBS for 2 hours and treated with the indicated concentrations of BMP3b (0 – 10nM) for 24 hours (+FBS/Gluc and –FBS/Gluc 0nM BMP3b, n=12; –FBS/Gluc 0.01 – 10nM BMP3b, n=6). Values expressed as means ± SE. F) Wild-type mice treated with saline or BMP3b were subjected to I/R surgery or a sham procedure. The LV was isolated 3 hours after reperfusion and the levels of SMAD1/5, and SMAD2/3 phosphorylation (p) were determined by immunoblot. Total SMAD1 and SMAD2 are also shown. Levels of GAPDH are shown as loading controls. Densitometric analysis of Western blots are shown (n = 6 mice each group). Values expressed as means ± SD. P values were determined by unpaired Student t-test (A, B and C), Mann-Whitney test (D), one-way ANOVA with Tukey correction (E) and two-way ANOVA with Tukey correction (F).
Figure 7.
Figure 7.. BMP3b cardioprotective effect occurs through the SMAD1/5 pathway.
Wild-type mice were pretreated with K02288 (3.5 mg/kg body weight, i.p.), a selective type I BMP receptor inhibitor, or saline, 1 hour before myocardial I/R surgery, and treated with BMP3b (10 ng/g body weight) or saline (Sal) immediately before ischemia and immediately before reperfusion. Myocardial sections were obtained 24 hours after reperfusion. Representative images A) and quantification B) of triphenyltetrazolium chloride (TTC) staining and fluorescent microsphere distribution (green dots) are shown. MI area and AAR from each heart section were measured. Ratio of MI to AAR (MI/AAR) and AAR are shown. (No treatment/Sal, n = 3; No treatment/BMP3b, n = 5; K02288/Sal, n = 6; K02288/BMP3b, n = 6). Values expressed as means ± SE. Scale bar: 2 mm. C) The level of cardiac troponin I (cTnI) was measured 24 h after reperfusion injury in the same four groups. (No treatment/Sal, n = 3; No treatment/BMP3b, n = 5; K02288/Sal, n = 6; K02288/BMP3b, n = 6). Values expressed as means ± SE. D) Neonatal rat cardiomyocytes were pretreated with K02288 (1μM, 30 min) or PBS, and treated with BMP3b (10nM) or PBS for 30 min. Phospho-Smad1/5 and phospho-Smad2/3 proteins levels were analyzed in cell lysates. Levels of β-actin are shown as loading control in immunoblot analysis (n = 4 each group). Results are expressed as means ± SD. Normality was assessed by Shapiro-Wilk test and P values were determined by two-way ANOVA with Tukey correction.
Figure 8.
Figure 8.. Human BMP3b plasmatic levels are increased after alcohol septal ablation.
A) In patients undergoing alcohol septal ablation the plasma levels of BMP3b were measured before and 1 hour after alcohol septal ablation (n = 22). Values are showing changes of individual subjects’ data. B) The plasma levels of cardiac Troponin I (cTnI) were measured 24 hours after the alcohol septal ablation procedure. The correlation of cTnI measured 24 hours after the procedure and BMP3b plasma levels measured one hour after the procedure is shown (n = 9). P values were determined by paired Student t-test (A) and Spearman correlation (B).

References

    1. Nascimento BR, Brant LCC, Marino BCA, Passaglia LG, Ribeiro ALP. Implementing myocardial infarction systems of care in low/middle-income countries. Heart 2019;105(1):20–26. - PubMed
    1. Virani SS et al. Heart Disease and Stroke Statistics—2021 Update. Circulation 2021;143:E254–E743. - PubMed
    1. Thoonen R et al. Functional brown adipose tissue limits cardiomyocyte injury and adverse remodeling in catecholamine-induced cardiomyopathy. J Mol Cell Cardiol 2015;84:202–211. - PMC - PubMed
    1. Saito M, Matsushita M, Yoneshiro T, Okamatsu-Ogura Y. Brown Adipose Tissue, Diet-Induced Thermogenesis, and Thermogenic Food Ingredients: From Mice to Men. Front Endocrinol (Lausanne) 2020;11. - PMC - PubMed
    1. Yang FT, Stanford KI. Batokines: Mediators of Inter-Tissue Communication (a Mini-Review). Curr Obes Rep 2022;11:1–9. - PMC - PubMed

Publication types

MeSH terms

Substances