. 2023 Sep 8;51(16):8413-8433.
doi: 10.1093/nar/gkad581.

DeSUMOylation of chromatin-bound proteins limits the rapid transcriptional reprogramming induced by daunorubicin in acute myeloid leukemias

Affiliations

DeSUMOylation of chromatin-bound proteins limits the rapid transcriptional reprogramming induced by daunorubicin in acute myeloid leukemias

Mathias Boulanger et al. Nucleic Acids Res. .

Abstract

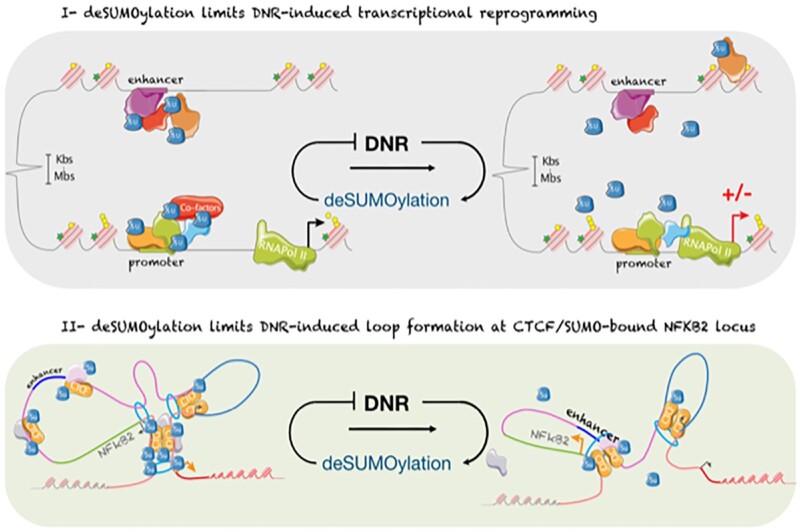
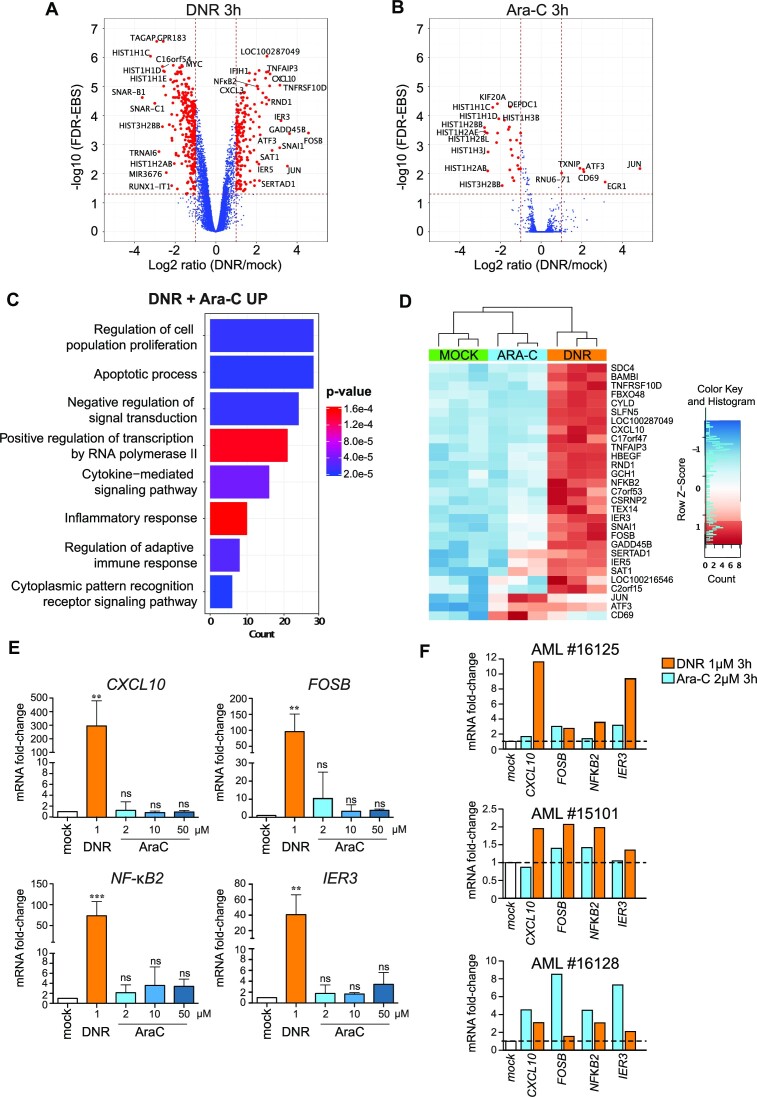
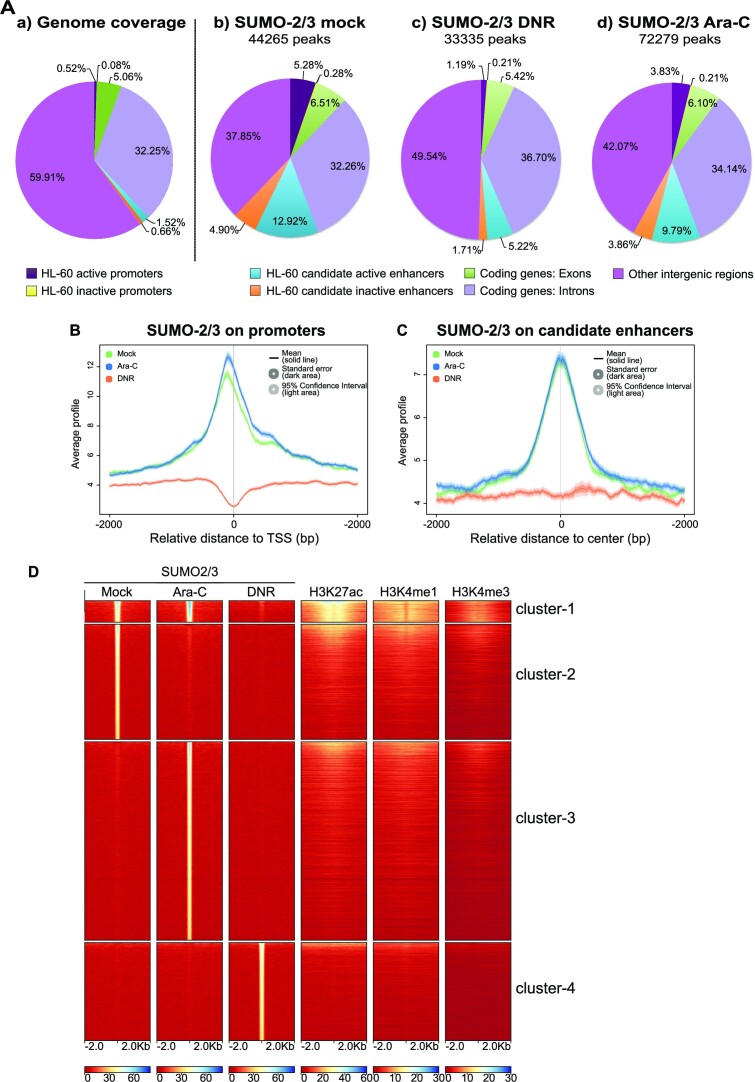
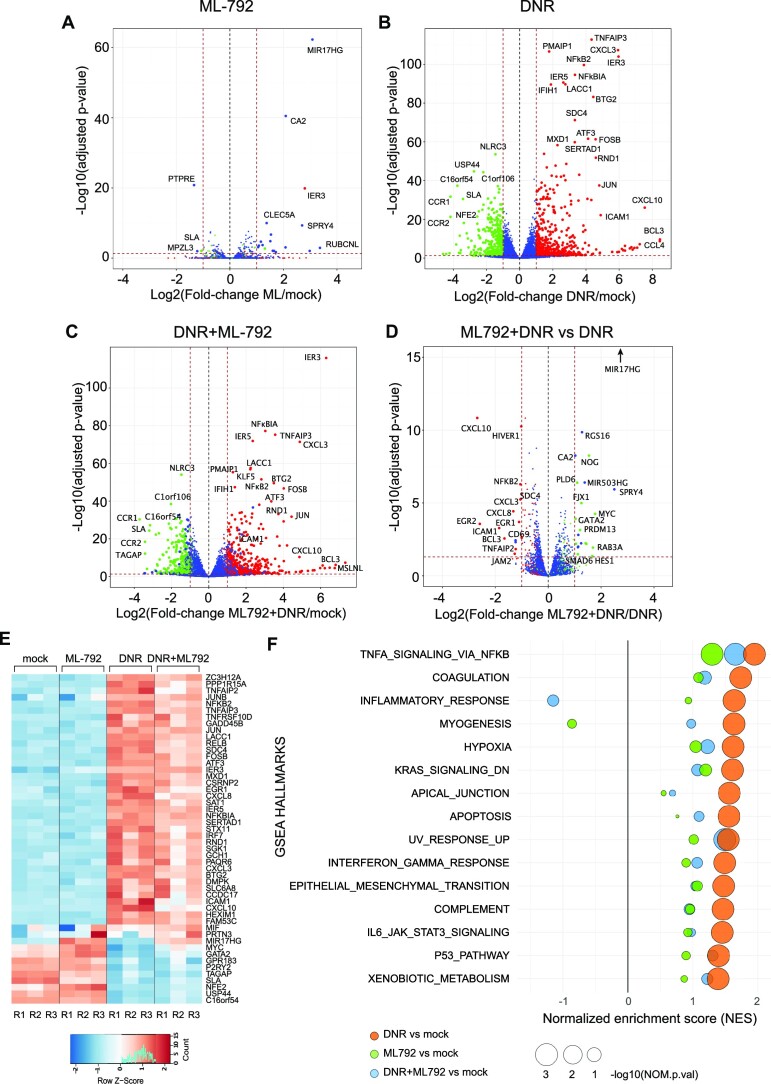
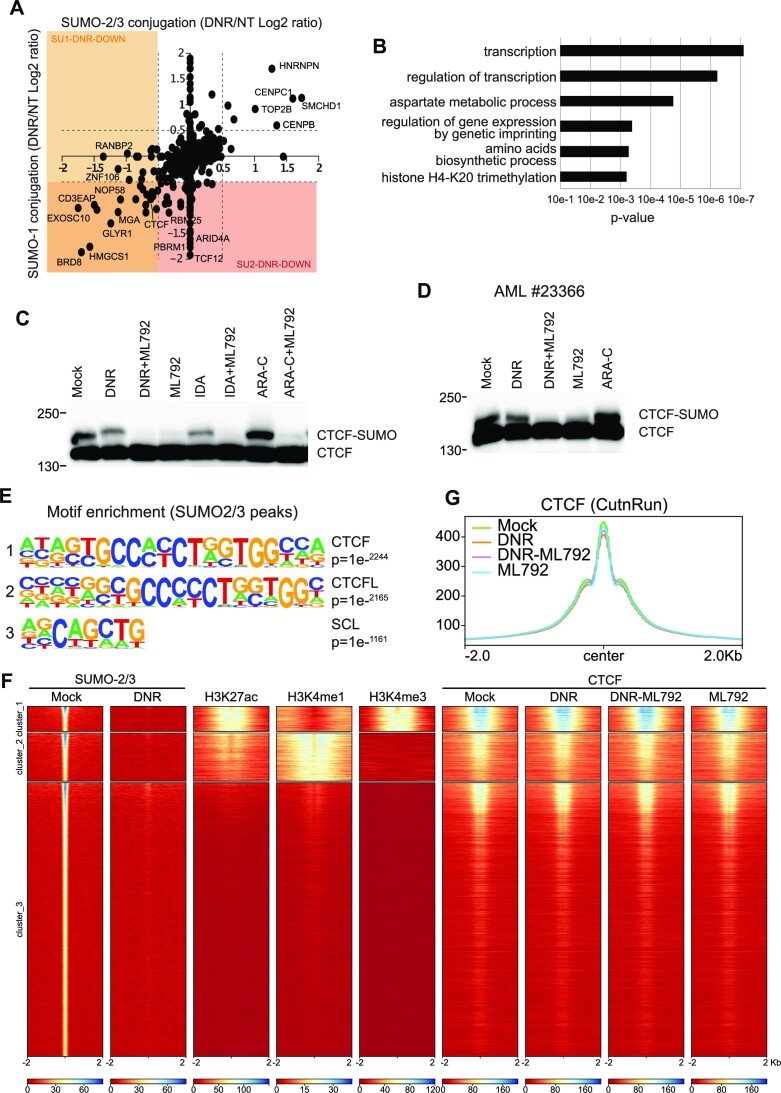
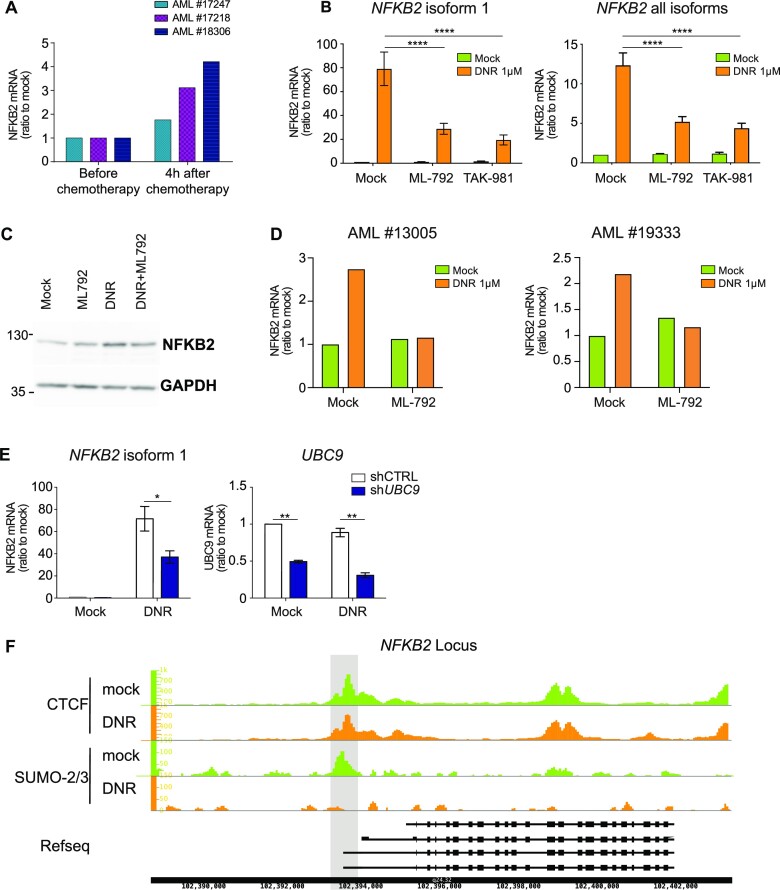
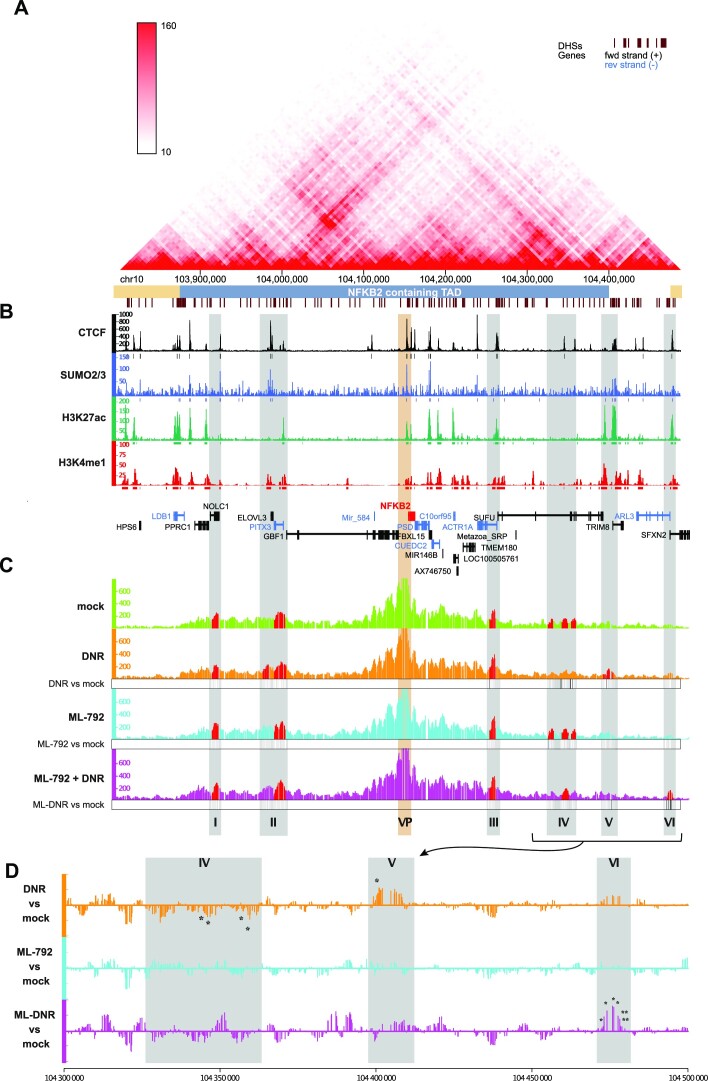
Genotoxicants have been used for decades as front-line therapies against cancer on the basis of their DNA-damaging actions. However, some of their non-DNA-damaging effects are also instrumental for killing dividing cells. We report here that the anthracycline Daunorubicin (DNR), one of the main drugs used to treat Acute Myeloid Leukemia (AML), induces rapid (3 h) and broad transcriptional changes in AML cells. The regulated genes are particularly enriched in genes controlling cell proliferation and death, as well as inflammation and immunity. These transcriptional changes are preceded by DNR-dependent deSUMOylation of chromatin proteins, in particular at active promoters and enhancers. Surprisingly, inhibition of SUMOylation with ML-792 (SUMO E1 inhibitor), dampens DNR-induced transcriptional reprogramming. Quantitative proteomics shows that the proteins deSUMOylated in response to DNR are mostly transcription factors, transcriptional co-regulators and chromatin organizers. Among them, the CCCTC-binding factor CTCF is highly enriched at SUMO-binding sites found in cis-regulatory regions. This is notably the case at the promoter of the DNR-induced NFKB2 gene. DNR leads to a reconfiguration of chromatin loops engaging CTCF- and SUMO-bound NFKB2 promoter with a distal cis-regulatory region and inhibition of SUMOylation with ML-792 prevents these changes.


Figures

Graphical Abstract
Graphical Abstract
Figure 1.
Figure 1.
Chemotherapeutic drugs rapidly alter the expression of genes involved in cell death and inflammation in AML cells. (A, B) Trancriptome profile. HL-60 cells were treated with 1 μM DNR (A) or 2 μM Ara-C for 3 h (B). RNAs were purified from three independent experiments and used to probe Affymetrix Human Gene 2.0 ST Genechips. The red dots on the Volcano plots represent the Differentially Expressed genes (DEG) with an absolute Fold Change (FC) ≥ 2 (log2 ≥ 1) and a False Discovery Rate (FDR) corrected with Empirical Bayes Statistics (EBS) (89) <0.05. (C) Gene Ontology enrichment analysis of the genes up-regulated (2 fold) by DNR and Ara-C. Ontologies were performed using the Panther GO database (51). The main terms of each identified group are presented on the graph and classified by the number of genes present in each group. P values are corrected with Bonferroni step down. (D) Heatmap of DEG with a FC4 in the transcriptomic experiments presented in (A) and (B). The data for all three replicates are represented. (E) RT-qPCR analysis of selected genes. HL-60 cells were treated for 3 h with 1 μM DNR or 2 μM Ara-C. The levels of the indicated mRNAs were measured by RT-qPCR, normalized to GAPDH levels and expressed as fold increase to mock-treated cells (mean ± SD, n = 7 for NF-κB2, n = 6 for IER3, n = 5 for FOSB, CXCL10). (F) Regulation of selected genes in primary AML cells. AML cells (bone marrow aspirate) from three patients were treated in vitro with 1 μM DNR or 2 μM Ara-C for 3 h. The levels of the indicated mRNAs were measured by RT-qPCR, normalized to TBP levels and expressed as fold increase to mock-treated cells.
Figure 2.
Figure 2.
Treatment of AML cells with DNR depletes SUMOylated proteins from the chromatin, in particular at promoters and enhancers. (A, B) ChIP-Seq analyses of SUMO-2/3 distribution on the genome. HL-60 were treated with 1 μM DNR or 2 μM Ara-C for 2 h. ChIP-Seq experiments were carried out with SUMO-2/3 antibodies. (A) a: a proportion of the different genomic regions, b−d: proportion of SUMO-2/3 peaks on these chromatin regions in mock- (b), DNR- (c) or Ara-C- (d) treated HL-60 cells. (B, C) Metaprofile of the SUMO-2/3 ChIP-seq signal on HL-60 promoters (B) or enhancers (C) in mock-, DNR- or Ara-C- treated HL-60 cells. Promoters (−2 kb to TSS) and enhancers as well as their activation state were defined using H3K27ac, H3K4me1 and H3K4me1 profiles as well as NCBI refseq data (see Material and methods and Supplementary Figure 2). (D) Heat-map for the distribution of SUMO-2/3, H3K27ac, H3K4me1, H3K4me3. The clustering was performed on SUMO peaks present in any of the conditions (Mock, DNR, Ara-C) and the ranking was made according to SUMO-2/3 signal.
Figure 3.
Figure 3.
Inhibition of SUMOylation reduces the DNR-induced regulation of a subset of genes. (A–E) HL-60 cells were treated with 1 μM DNR, 0.5 μM ML-792 or the combination of the two drugs for 3 h. Total RNAs were prepared from three independent experiments and sequenced. Volcano plot showing the DEG between (A) ML-792- and mock- (B) DNR- and mock-, (C) ML-792 + DNR- and mock-, (D) ML-792 + DNR and DNR- treated HL-60 cells. Green dot: DNR-downregulated FC ≤ -2 and FDR (false discovery rate) < 0.05; red dots: DNR-upregulated with FC ≥ 2 and FDR < 0.05; Blue dots: genes with –2 ≥FC ≤ 2 and FDR > 0.05 in the DNR vs mock conditions. (E) Heatmap of top 50 DEGs in all conditions presented in A, B and C. (F) Gene Set Enrichment Analysis (GSEA) was performed using RNA-Seq data presented in A–E. The GSEA hallmarks showing a Normalized Enrichment Score NES > 1 or < −1, a P-value < 0.05 and an FDR < 0.25 for the DNR versus mock analysis are presented for each treatment condition (DNR, ML-792, DNR + ML-792) compared to the mock-treated cells.
Figure 4.
Figure 4.
DNR leads to deSUMOylation of chromatin regulators, including CTCF. (A) Changes in SUMO-1 and SUMO-2/3 proteomes upon DNR treatment. SUMOylated proteins were immunoprecipitated with SUMO-1 or SUMO-2/3 antibodies from SILAC-labeled HL-60 cells treated or not with DNR (1 μM for 2 h). Scatterplot analysis of SUMO-1 and SUMO-2/3 proteome change (log2 ratio) in cell treated compared to mock-treated cells. Doted lines represent log2 ratio of ±0.5. Only proteins found to be SUMOylated (Supplementary Figure 4A) are represented. (B) DeSUMOylated proteins are mostly transcriptional regulators. Gene Ontology analysis of the identified down-SUMOylated proteins for SUMO-1 and SUMO-2/3 in response to DNR (log2 ratio < −0.5) were obtained using the Panther Protein Class database (51). (C, D) CTCF is SUMOylated in HL-60 and patient cells. HL-60 (C) or AML patient cells (D) were treated with DNR (1 μM), ML-792 (0.5 μM), IDA (1 μM) or Ara-C (2 μM) for 3 h. Total cell extracts were loaded on SDS-PAGE and immunoblotted with CTCF antibodies. (E) The CTCF motif is enriched at SUMO-2/3 binding sites. Motif enrichment search was performed with homer pearl script (findMotifs.pl) on the SUMO-2/3 ChIP-Seq data obtained for mock-treated HL-60. The three most enriched motifs are shown. (F) SUMO/CTCF overlap on promoters and enhancers. HL-60 cells were treated with DNR (1 μM), ML-792 (0.5 μM) or the combination for 2 h. Cell extracts were then used to perform CUT&RUN with CTCF antibodies (three independent biological replicates). Heat-map for the distribution of SUMO-2/3 (ChIP-Seq, see Figure 2), H3K27ac, H3K4me1, H3K4me3 and CTCF (CUT&RUN). The clustering was performed on H3K4me1 and H3K4me3 and the ranking was made according to SUMO-2/3 signal. (G) Metaprofile for the distribution of CTCF peaks on the whole genome in cells treated for 2 h with mock, DNR (1 μM), ML-792 (0.5 μM) or the combination.
Figure 5.
Figure 5.
deSUMOylation limits DNR-induced changes in NFKB2 expression. (A) Regulation of NFκB2 gene during AML patient treatment. Blood sample from three patients were collected before and 4 h after the induction chemotherapy (DNR: 90 mg/m2 and Ara-C 30 mg/m2). PBMC were purified, mRNA prepared and NFKB2 expression monitored by RT-qPCR, normalized to TBP and S26 levels and expressed as ratio to cells before treatment. (B) inhibition of SUMOylation limits NFκB2 induction by DNR. HL-60 cells were treated with 1 μM of DNR for 3 h with or without 0.5 μM of ML-792 or 0.5 μM TAK-981. The levels of the indicated mRNAs were measured by RT-qPCR, normalized to TBP and S26 and expressed as ratio to mock-treated cells (n = 6 for DMSO and ML-792, n = 3 for TAK-981, Ordinary One-Way Anova). (C) inhibition of SUMOylation limits NFκB2 protein accumulation upon DNR treatment: HL-60 cells were treated with 1 μM of DNR for 3 h with or without 0.5 μM of ML-792. Cell extracts were loaded on SDS-PAGE and immunoblotted with NFκB2 and GADPH antibodies (n = 3). (D) Inhibition of SUMOylation limits NFκB2 induction by DNR in AML patient cells. AML cells (bone marrow aspirates) from two different patients were treated with 1 μM of DNR for 3 h with or without 0.5 μM of ML-792. The levels of NFKB2 mRNAs were measured by RT-qPCR, normalized to GAPDH and expressed as ratio to mock-treated cells. (E) UBC9 knock-down limits DNR-induced NFKB2 expression. HL-60 cells stably expressing scramble or UBC9 directed shRNA were mock- or DNR-treated for 3 h. The levels of the indicated mRNAs were measured by RT-qPCR, normalized to TBP and S26 and expressed as ratio to mock-treated cells (n = 3). (F) CTCF and SUMO bind to the NFκB2 promoter: ChIP-Seq data for SUMO-2/3 and CUT&RUN data for CTCF were aligned and visualized using the IGB software at the level of the NFKB2 gene.
Figure 6.
Figure 6.
deSUMOylation limits DNR-induced changes in the 3D conformation of the NFκB2 locus. (A) HiC map of the TAD containing NFκB2 gene. This map was obtained using publicly available HiC data obtained in the K562 human chronic myeloid cell line (90). The NFKB2-containing TAD is underlined in blue. (B) Distribution of SUMO and CTCF in the NFκB2 containing TAD. CUT&RUN data for CTCF and ChIP-Seq data for SUMO-2/3, H3K27ac and H3K4me1 are represented by the normalized read count per 50 bp bin (C, D) Inhibition of SUMOylation limits DNR-induced changes in NF-κB2 locus 3D conformation. HL-60 treated for 2 h with DNR (1 μM), ML-792 (0.5 μM) or the combination and subjected to 4C experiment (three biological replicates). The Y axis of the 4C-seq tracks represents the normalized interaction frequencies with the viewpoint (NFKB2 promoter, VP) per 10 bp bin. Grey zones are highly reproducible interaction region in at least one condition (regions plotted in red present a P-value <0.05 in the peakC analysis of the three replicates) and named from I to VI. (D) Differential analysis of the contact point frequency in the regions IV-VI for DNR, ML-792 and ML-792 + DNR compared to mock-treated cells. p-values for the peaks showing statistically significant differences between the conditions are indicated.

Similar articles

Cited by

References

    1. Saultz J.N., Garzon R.. Acute myeloid leukemia: a concise review. J. Clin. Med. 2016; 5:33. - PMC - PubMed
    1. Khaled S., Al Malki M., Marcucci G.. Acute myeloid leukemia: biologic, prognostic, and therapeutic insights. Oncol. Williston Park N. 2016; 30:318–329. - PubMed
    1. Dombret H., Gardin C.. An update of current treatments for adult acute myeloid leukemia. Blood. 2016; 127:53–61. - PMC - PubMed
    1. Minotti G., Menna P., Salvatorelli E., Cairo G., Gianni L.. Anthracyclines: molecular advances and pharmacologic developments in antitumor activity and cardiotoxicity. Pharmacol. Rev. 2004; 56:185–229. - PubMed
    1. Grant S. Ara-C: cellular and molecular pharmacology. Adv. Cancer Res. 1998; 72:197–233. - PubMed

Publication types

MeSH terms