. 2023 Oct 2;220(10):e20230570.
doi: 10.1084/jem.20230570. Epub 2023 Jul 18.

Landscape of mast cell populations across organs in mice and humans

Affiliations

Landscape of mast cell populations across organs in mice and humans

Marie Tauber et al. J Exp Med. .

Erratum in

  • Correction: Landscape of mast cell populations across organs in mice and humans.
    Tauber M, Basso L, Martin J, Bostan L, Pinto MM, Thierry GR, Houmadi R, Serhan N, Loste A, Blériot C, Kamphuis JBJ, Grujic M, Kjellén L, Pejler G, Paul C, Dong X, Galli SJ, Reber LL, Ginhoux F, Bajenoff M, Gentek R, Gaudenzio N. Tauber M, et al. J Exp Med. 2024 Feb 5;221(2):e2023057001172024c. doi: 10.1084/jem.2023057001172024c. Epub 2024 Jan 24. J Exp Med. 2024. PMID: 38265438 Free PMC article. No abstract available.

Abstract

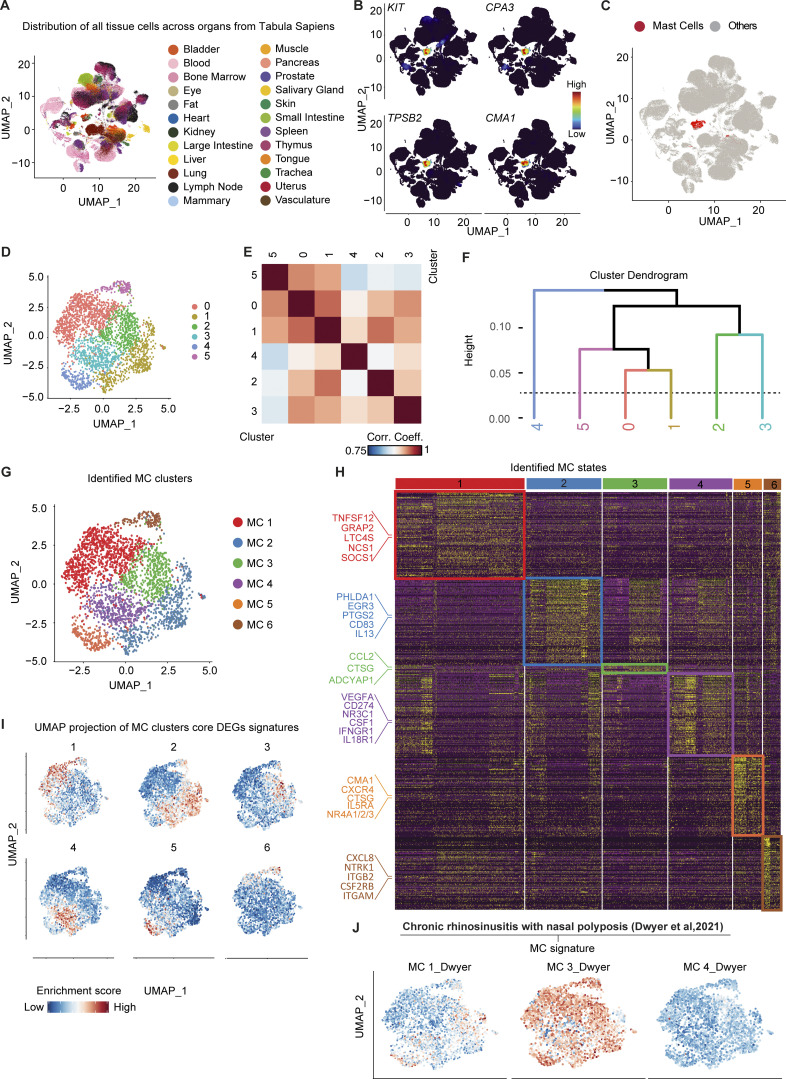
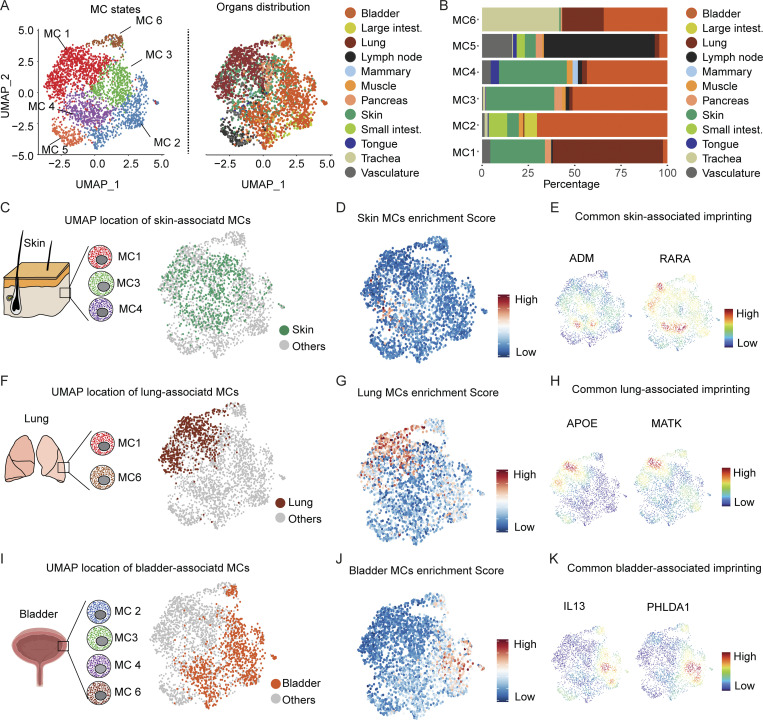
Mast cells (MCs) are tissue-resident immune cells that exhibit homeostatic and neuron-associated functions. Here, we combined whole-tissue imaging and single-cell RNA sequencing datasets to generate a pan-organ analysis of MCs in mice and humans at steady state. In mice, we identify two mutually exclusive MC populations, MrgprB2+ connective tissue-type MCs and MrgprB2neg mucosal-type MCs, with specific transcriptomic core signatures. While MrgprB2+ MCs develop in utero independently of the bone marrow, MrgprB2neg MCs develop after birth and are renewed by bone marrow progenitors. In humans, we unbiasedly identify seven MC subsets (MC1-7) distributed across 12 organs with different transcriptomic core signatures. MC1 are preferentially enriched in the bladder, MC2 in the lungs, and MC4, MC6, and MC7 in the skin. Conversely, MC3 and MC5 are shared by most organs but not skin. This comprehensive analysis offers valuable insights into the natural diversity of MC subtypes in both mice and humans.


Conflict of interest statement

Disclosures: X. Dong reported personal fees from Escient Pharmaceuticals and GlaxoSmithKline outside the submitted work. S.J. Galli reported grants from National Institutes of Health, personal fees from Evommune, Inc., and personal fees from Jasper Therapeutics, Inc. outside the submitted work. No other disclosures were reported.

Figures

None
Graphical abstract
Figure 1.
Figure 1.
Mrgprb2+ and Mrgprb2neg MCs represent transcriptionally distinct MC populations. (A) UMAP plot of the scRNAseq performed on sorted peritoneal cavity. MCs. (B) UMAP plot of the scRNAseq performed on sorted immune cells from the back skin. Black arrowhead: MC population. (C). UMAP plot of the scRNAseq performed on sorted immune cells from the gut mucosa. Black arrowhead: MC population. (D) Violin plot of the expression of Mrgprb2, Mrgprb1, Mcpt4, Mcpt1, Kit, and Cpa3. (E) UMAP plot of all MC populations aggregated. (F) PCA showing the segregation between skin/peritoneal cavity and gut MCs. (G) Heatmap of 74 representative DEGs between MCs from gut, peritoneal cavity, and skin MC related. Characteristic genes and surface markers upregulated in gut (green) or peritoneal cavity and skin MCs (red) are highlighted. (H and I) (H) Mrgprb2 and (I) Mcpt1 expression density on the aggregated populations. (J) Representative 3D confocal microscopy images of Avidin SRho (red), Mcpt1 (green), and DAPI (cyan) fluorescent signals of back skin, duodenum, and colon. Arrows indicate gut mucosa and muscularis. Data are representative of three independent experiments. Bars = 100 (skin) and 70 (duodenum and colon) μm. DC, dendritic cell; NK, natural killer.
Figure S1.
Figure S1.
MrgprB2 expression is restricted to MCs in the mouse. (A) Publicly available microarray gene expression data (Immunological Genome Project) of Mrgprb2 in different mouse immune cells; data are shown using a heat map of mRNA expression levels. The expression of the genes Tpsg1, Cd19, Klrb1c, Cd3e, Elane, Itgam, and Batf3 is presented as reference. (B) UMAP projection of the DRG neuron populations identified in Zeissel et al. (2018). (C) UMAP projection of the expression of MrgprB2 in the DRG neurons. NK, natural killer.
Figure S2.
Figure S2.
MrgprB2-cre mice allow the tracing of MCs across tissues. (A) Protocol used to selectively trace MrgprB2+ MCs in 6–8-wk-old mice. Peritoneal cells were isolated from Mrgprb2-Cre+; RosatdTomato or RosatdTomato control mice, and MCs were analyzed by flow cytometry based on CD117 expression. (B–D) tdT fluorescence was assessed in Mrgprb2-Cre+; RosatdTomato (red curve) as compared with Rosa26;tdTomato (gray curve). (B) t-SNE of the tdT, CD117, F4/80, and CD11b expression in CD45+ immune cells from peritoneal lavage (upper row) and back skin (lower row) in Mrgprb2-Cre+; RosatdTomato mice. (C) t-SNE of the tdT, Ly6c, SiglecF, Ly6g, FcεRI, CD4, CD8, B220, and NK1.1 expression in CD45+ immune cells from blood in Mrgprb2-Cre+; RosatdTomato mice. (D) Representative 3D confocal microscopy images of Avidin (Av.SRho, red) and EYFP (green) fluorescent signals of ear skin sections from Mrgprb2-Cre+; EYFP mice, compared to littermate controls. (E) Representative confocal microscopy image of skin from Mrgprb2-Cre+; RosatdTomato mice (red) stained with Avidin 488 (green) and β3-Tubulin (white; upper panel), and Venn diagram showing the colocalization between Av+ and Tdtomato+ cells (number of cells are shown in the circles). (F) UMAP representation of Mrgprb2 expression density among immune cells from back skin. (G) Representative confocal microscopy images of Avidin (Av.SRho, red) fluorescent signal in skin sections of WT mice and mice deficient for serglycin (SG), N-deacetylase/N-sulfotransferase 2 (NDST2) or three major MC proteases (3xKO: Mcpt4, Mcpt6, and Cpa3). (H) MCs numbers in skin sections of WT (red bar), SG−/− (gray bars), NSTD2−/− (gray bars), or Mcpt4−/−; Mcpt6−/−; Cpa3−/− (3xKO, gray bars) mice. Each circle = one mouse. (I) Representative confocal microscopy image of lung and ileum from Mrgprb2-Cre+; RosatdTomato mice (red) stained with Mcpt-1 (green). Arrowheads indicate individual MCs. Scale bars = 20 µm (D) and 50 µm (E, G, and I). Number of mice: A–C, n = 4 mice, one experiment; D, n = 3 per group two experiments; F and G, n = 3 per group, one experiment; mean ± SEM; one-way ANOVA with Tukey’s test for multiple comparisons (H), *P < 0.05.
Figure 2.
Figure 2.
Transcriptomic profiling of mouse MCs across tissues. (A) UMAP plot showing the origin of the dataset used for MC identification. (B) UMAP of the distribution of all tissue cells across organs. (C) Cpa3 (left) and Kit (right) expression density on the aggregated dataset. Black arrowhead: MC population. (D) UMAP of integrated MCs according to their tissue of origin. (E) Mrgprb2 and Mcpt1 expression density on the aggregated populations. (F) Heatmap of 85 representative DEGs between MMC and CTMC populations. Characteristic genes and surface markers upregulated in Mrgprb2 (green, GI tract) or Mrgprb2+ MC (red, other organs) are highlighted. (G) UMAP showing the score-based identification of the common transcriptomic signature of MCs from Dwyer et al. (2016). (H) UMAP showing the score-based identification of the β7low and β7high MCs from Derakhshan et al. (2021). (I) Representative 3D confocal microscopy images of Avidin 488 (green) Tdt+ (red) MCs in stomach, heart, lung, skeletal muscle, back skin, and uterus of MrgprB2-reporter mice. Data are representative of two independent experiments with at least two animals per group. Scale bars = 50 µm. Neo., neonatal.
Figure S3.
Figure S3.
MrgprB2high MCs in the skin represent a mature population of MCs in the mouse. (A and B) UMAP showing (A) the unsupervised Louvain clustering and (B) Mrgprb2 expression density of isolated skin MCs. (C) UMAP showing the cell cycle state of skin MCs. (D) Monocle analysis of developmental trajectories in isolated skin MCs. (E) Single-cell expression of Mrgprb2, Cpa3, Kit, Mrgprb1, Cma1, Mcpt4, Tpsab1, and Tpsb2 mRNA along the pseudotime scale.
Figure 3.
Figure 3.
MrgprB2+ and MrgprB2neg MCs have different hematopoietic origins and turnover kinetics. (A and B) Mrgprb2 (A) and Mcpt1 (B) expression density in MCs identified in the aggregated scRNAseq data of neonates (left) or adult (right) mice. (C) Representative 3D confocal microscopy images of Avidin SRho (red), Mcpt1 (green), and DAPI (cyan) fluorescent signals of E18 neonatal skin. (D) Avidin+ and Mcpt1+ MCs counts in skin samples from seven E18 embryos. (E) Bar graph representing the ratio of Mcpt1+/Avidin+ MCs among gut segments. (F) Representative 3D confocal microscopy images of Mcpt1 (green) and DAPI (cyan) fluorescent signals in small intestine of conventionally housed (left) or germ-free (GF, right) mice. (G and H) Mcpt1+ MCs count in the mucosa (G) and Av.SRho+ MCs in the muscularis (H) of conventionally housed (n = 7) or GF (n = 9) mice. (I) Representative 3D confocal microscopy images of Avidin (green) and DAPI (cyan) fluorescent signals in skin of conventionally housed (left) or GF (right) mice. (J) Avidin+ MCs count in the mucosa of conventionally housed (n = 5) or GF mice (n = 4). (K) Representative 3D confocal microscopy images of Mcpt1+ MCs (green), Tdt (red), and DAPI (cyan) in the mouse GI tract, 3 mo (M3) after BM transfer. Pie chart representation of the partition of Mcpt1+ Tdt+ MCs (green) or Mcpt1+ Tdt MCs (gray) 3 mo after transplantation. (L) Representative 3D confocal microscopy images of Avidin+ (green), Tdt (red), and DAPI (cyan) in the mouse GI tract, 3 mo (M3) after BM transfer. Pie chart representation of the partition of Avidin+ Tdt+ MCs (green) or Avidin+ Tdt MCs (gray) 3 mo after transplantation. Scale bars = 50 µm (C–I) and 80 µm (K and L). Data from at least two independent experiments, with at least three mice per experiment mean ± SEM; **P < 0.01; ***P < 0.001, Mann–Whitney test.
Figure S4.
Figure S4.
Ontogeny and renewal of Mrgprb2+ and Mrgprb2 MCs. (A) Protocol of the shielded BM chimera strategy used to track cell renewal. (B and C) Representative 3D confocal microscopy images (upper panel) and pie chart representation of the partition (lower panel) of (B) Mcpt1+ gMCs (green, left panel) and (C) Avidin+ gMCs (green, right panel), tdT (red), and DAPI (cyan) in the mouse GI tract, 1 mo (M1) after BM transfer. White squares identify magnified areas shown in the right images (B and C). Number of mice: B and C, n = 6, data from two independent experiments. (D) t-SNE of the Tdt expression in CD45+ immune cells from peritoneal lavage in Ms4a3-cre+; Tdtomato mice. Insets on the right show CD45 (upper panel), CD117 (middle panel), and F4/80 (lower panel) expression. (E) Representative 3D confocal microscopy images of Avidin+ MCs (green), tdT (red); F4/80 (blue) in the skin of Ms4a3-cre+; tdTomato mice. (F) Representative 3D confocal microscopy images of Avidin+ gMCs (green, upper panel) and Mcpt1+ gMCs (green, lower panel), tdTomato (red), and DAPI (cyan; upper panel) in the intestinal tract of Ms4a3-cre+; tdTomato mice. White squares identify magnified areas shown in the right images. Scale bars = 100 µm. Number of mice: D–F, n = 4, data from two experiments.
Figure 4.
Figure 4.
Selective depletion of MrgprB2+ MCs protects against passive and active anaphylaxis. (A) Protocol used to selectively deplete MrgprB2+ MCs in 6–8-wk-old mice. Two consecutive i.p. injections of 1 µg dt (DTx) were done on days 1 and 3 Mrgprb2-Cre+; iDTRfl/fl mice versus littermate controls. (B) Detection of MCs (CD45+ CD117+) by flow cytometry in the peritoneal cavity after dt treatment. (C) Fold change in MC percentage in the peritoneal lavage at 8, 30, and 90–120 d after dt treatment. (D) Percentage of blood basophils 8 d after dt treatment. (E) Protocol used to induce passive systemic anaphylaxis in MrgprB2-Cre; iDTRfl/fl (gray circles, n = 8) or littermate controls (blue circles, n = 8) mice. Mice were treated i.p with 1 µg of anti-DNP IgE 24 h followed by i.p injection of 250 ng of DNP-HSA. Anaphylactic response was monitored by assessment of rectal temperature every 10 min for 60 min. Results are expressed as change in temperature over time. (F) Protocol used to induce peanut-induced food allergy anaphylaxis in MrgprB2-Cre; iDTRfl/fl (gray circles, n = 12) or littermate control (blue circles, n = 8) mice. Mice were sensitized to peanut by weekly gavage for 4 wk with 1 mg of peanut extract and cholera toxin. 1 wk after the last gavage, mice were challenged i.p. with 1 mg of peanut extract. Anaphylactic response was followed by assessment of rectal temperature every 10 min for 60 min. Results are expressed as change in temperature over time. Non-sensitized MrgprB2-Cre; iDTRfl/fl (gray triangles, n = 5) or littermate controls (blue circles, n = 3) were used as controls. Data are from at least two independent experiments, with at least two mice per group; mean ± SEM; **P < 0.01, ****P < 0.0001 two-way ANOVA.
Figure S5.
Figure S5.
Selective depletion of MrgprB2+ MCs achieved across organs does not impact other immune cells. (A) Representative TB staining photographs of mesenteric windows (MW) from Mrgprb2-Cre+; iDTRfl/fl mice (right panel) and littermate controls (left panel) after two i.p. dt injections. Black arrows indicate MCs. Scale bars = 100 µm. (B) MCs count in the MW of Mrgprb2-Cre+; iDTRfl/fl mice (gray bar) and the littermate controls (cyan bar) based on TB staining. (C) Percentage of blood lymphocytes (CD4+ T cells, CD8+ T cells, B cells), natural killer (NK) cells, neutrophils, eosinophils, monocytes in Mrgprb2-Cre+; iDTRfl/fl mice (gray circles), and the littermate controls (blue circles) after dt treatment (day 8), gating by flow cytometry. (D–F) Gating strategy for immune cell populations analyzed by flow cytometry in C. (G–K) MC count in the lungs (G), esophagus (H), heart (I), spleen (J), back skin (K), and GI tract (L, pooled jejunum, ileum, and colon sections) of Mrgprb2-Cre+; iDTRfl/fl mice (gray bars) and the littermate controls (cyan bars) after two i.p. dt injections, based on TB staining. (M) Total IgE, peanut specific IgE, peanut specific IgG1, and Mcpt1 levels in blood of littermates (cyan bars, n = 5–6) or Mrgprb2-Cre+; iDTRfl/fl mice (gray bars, n = 10) sensitized and challenged with peanut extract. (B, C, and G–M) Each circle = one mouse. Data from at least two independent experiments, mean ± SEM; *P < 0.05, **P < 0.01 Mann–Whitney test.
Figure 5.
Figure 5.
Transcriptomic profiling of human MCs across tissues. (A) UMAP plot of the distribution of all tissue cells across organs from the Tabula Sapiens. (B) UMAP plot of the expression density of CPA3, KIT, TPSB2, and CMA1 on the cells from the Tabula Sapiens. (C) UMAP showing the final MC clusters selected for further clustering. (D) UMAP of the Louvain clustering of the selected MCs. (E) Heatmap of correlation between the six Louvain communities after pseudo-bulk transformation. (F) Hierarchical clustering of Louvain communities based on the distance of correlation. Populations were grouped if the distance between them was inferior to 0.1 (dotted line). (G) UMAP showing the final six states of human MCs identified. (H) Heatmap of 350 representative DEGs between the six populations of MCs. Genes of interest of each population are highlighted on the left. (I) UMAP showing the score-based identification of each of the six states using a selected set of markers. (J) UMAP showing the score-based identification of the six states of human MCs using the signature of MC1, MC2, and MC4 populations defined in Dwyer et al. (2021).
Figure 6.
Figure 6.
Distribution of human MC states across organs and genes expression in major subsets from the same organ. (A) UMAP representing the human MCs colored according to the six identified clusters (left UMAP) or the organ of origin (right UMAP). (B) Bar graph showing the proportion of each MC states in the different organs. (C) Picture showing the MC cluster present in the skin (left) and their distribution on the UMAP (right). (D) UMAP showing the score-based identification of skin MCs using a common set of markers from MC1, MC3, and MC4 states. (E) Examples of UMAPs showing the expression density of common sets of skin-associated genes. (F) Picture showing the MCs present in the lung (left) and their distribution on the UMAP (right). (G) UMAP showing the score-based identification of lung MCs using a common set of markers from MC1 and MC6 populations. (H) Examples of UMAPs showing the expression density of lung-associated genes. (I) Picture showing MC states present in the bladder (left) and their distribution on the UMAP (right). (J) UMAP showing the score-based identification of bladder MCs using a common set of markers from MC2, MC3, MC4, and MC6 states. (K) Examples of UMAPs showing the expression density of bladder-associated genes.

References

    1. Abraham, S.N., and St John A.L.. 2010. Mast cell-orchestrated immunity to pathogens. Nat. Rev. Immunol. 10:440–452. 10.1038/nri2782 - DOI - PMC - PubMed
    1. Åbrink, M., Grujic M., and Pejler G.. 2004. Serglycin is essential for maturation of mast cell secretory granule. J. Biol. Chem. 279:40897–40905. 10.1074/jbc.M405856200 - DOI - PubMed
    1. Ali, H. 2021. Revisiting the role of MRGPRX2 on hypersensitivity reactions to neuromuscular blocking drugs. Curr. Opin. Immunol. 72:65–71. 10.1016/j.coi.2021.03.011 - DOI - PMC - PubMed
    1. Alquicira-Hernandez, J., and Powell J.E.. 2021. Nebulosa recovers single-cell gene expression signals by kernel density estimation. Bioinformatics. 37:2485–2487. 10.1093/bioinformatics/btab003 - DOI - PubMed
    1. Aran, D., Looney A.P., Liu L., Wu E., Fong V., Hsu A., Chak S., Naikawadi R.P., Wolters P.J., Abate A.R., et al. . 2019. Reference-based analysis of lung single-cell sequencing reveals a transitional profibrotic macrophage. Nat. Immunol. 20:163–172. 10.1038/s41590-018-0276-y - DOI - PMC - PubMed

Publication types