. 2023 Oct;40(5):523-540.
doi: 10.1007/s10719-023-10128-5. Epub 2023 Jul 18.

A glycomic workflow for LC-MS/MS analysis of urine glycosaminoglycan biomarkers in mucopolysaccharidoses

Affiliations

A glycomic workflow for LC-MS/MS analysis of urine glycosaminoglycan biomarkers in mucopolysaccharidoses

Jonas Nilsson et al. Glycoconj J. 2023 Oct.

Abstract

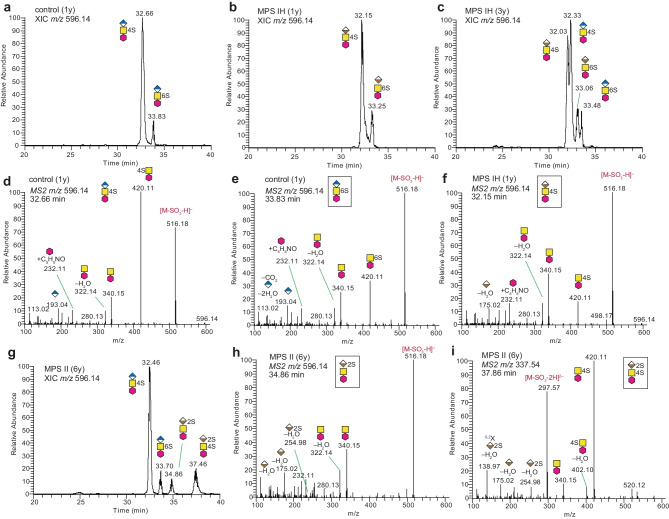
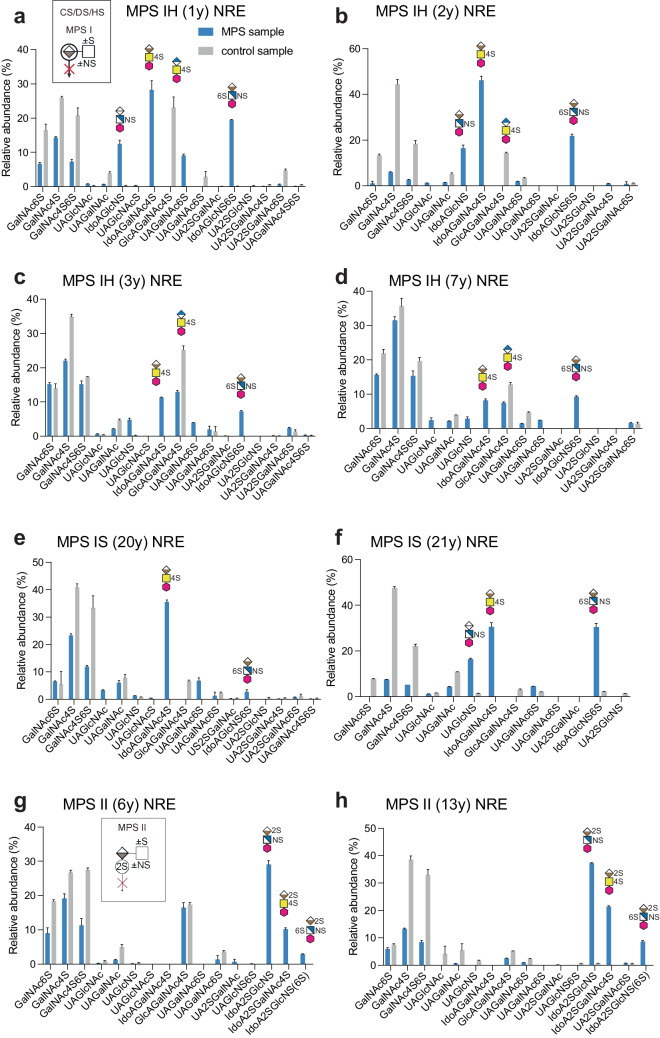
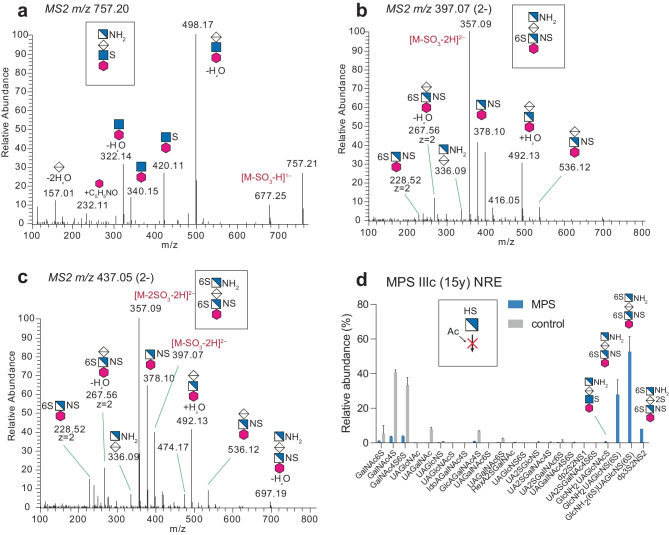
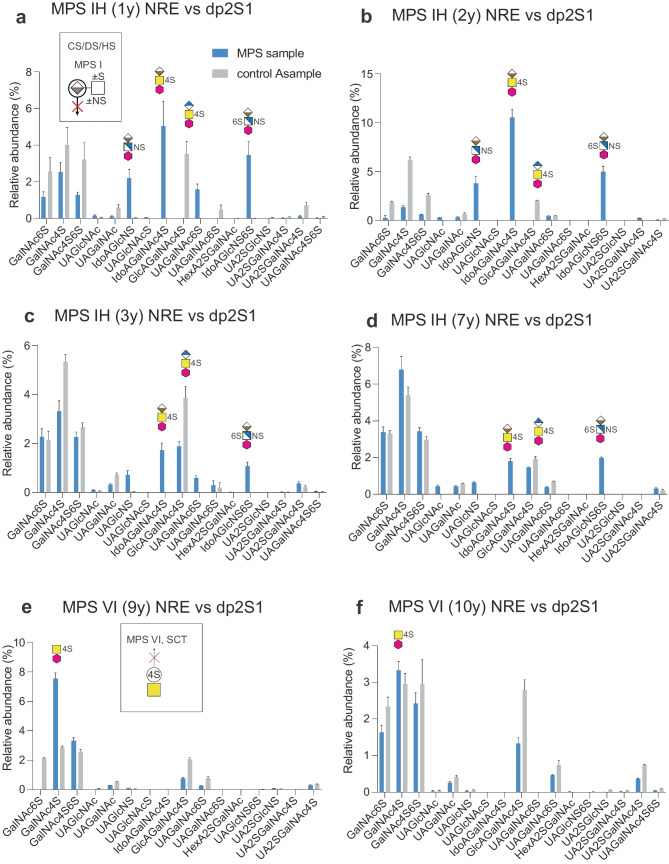
In recent years, several rational designed therapies have been developed for treatment of mucopolysaccharidoses (MPS), a group of inherited metabolic disorders in which glycosaminoglycans (GAGs) are accumulated in various tissues and organs. Thus, improved disease-specific biomarkers for diagnosis and monitoring treatment efficacy are of paramount importance. Specific non-reducing end GAG structures (GAG-NREs) have become promising biomarkers for MPS, as the compositions of the GAG-NREs depend on the nature of the lysosomal enzyme deficiency, thereby creating a specific pattern for each subgroup. However, there is yet no straightforward clinical laboratory platform which can assay all MPS-related GAG-NREs in one single analysis. Here, we developed and applied a GAG domain mapping approach for analyses of urine samples of ten MPS patients with various MPS diagnoses and corresponding aged-matched controls. We describe a nano-LC-MS/MS method of GAG-NRE profiling, utilizing 2-aminobenzamide reductive amination labeling to improve the sensitivity and the chromatographic resolution. Diagnostic urinary GAG-NREs were identified for MPS types IH/IS, II, IIIc, IVa and VI, corroborating GAG-NRE as biomarkers for these known enzyme deficiencies. Furthermore, a significant reduction of diagnostic urinary GAG-NREs in MPS IH (n = 2) and MPS VI (n = 1) patients under treatment was demonstrated. We argue that this straightforward glycomic workflow, designed for the clinical analysis of MPS-related GAG-NREs in one single analysis, will be of value for expanding the use of GAG-NREs as biomarkers for MPS diagnosis and treatment monitoring.

Keywords: Biomarkers; GAG-non-reducing ends; Glycomic; Glycosaminoglycans; Mucopolysaccharidosis.


Conflict of interest statement

The authors declare they have no financial interests. MB has given lectures in symposia and expert meetings sponsored by Sanofi Genzyme, Takeda Pharmaceutical Company and Biomarin Pharmaceutical, receiving no financial compensation.

Figures

Fig. 1
Fig. 1
Schematic structures of glycosaminoglycans (GAGs) and their catabolism. (a) Classification of GAGs is based on their specific disaccharide structures, named chondroitin sulfate (CS), dermatan sulfate (DS), heparan sulfate (HS), keratan sulfate (KS) and hyaluronic acid (HA). DS is formed from CS when a C-5 epimerase transforms the GlcA in CS into IdoA in DS. DS is only known to be present together with GalNAc C-4 sulfation of the IdoAGalNAc(4S) disaccharide. The nonreducing end (NRE), the internal oligosaccharide and the linkage region are indicated below the CS GAG chain. (b) Scheme for theoretical glycosaminoglycan non-reducing end (GAG-NRE) biomarkers of CS/DS, HS and KS origin accumulated in the various mucopolysaccharidosis (MPS) disorders. Encircled residues and crossed arrows indicate the structural consequences of the GAG-NREs for the enzyme deficiency corresponding to each disease. The glycan structures are graphically represented using the SNFG geometric symbols [39], defined in the lower right part of the figure
Fig. 2
Fig. 2
LC–MS/MS of GAG-NRE disaccharide (dp2) glycoforms. (a) Extracted ion chromatogram (XIC) at m/z 596.14 of an aged-matched (1 year) control sample; (b) a MPS IH patient (sample ID 4776) and (c) the same MPS IH patient (sample ID 1263) after HSCT treatment. (d) MS2 of the ions at m/z 596.14 eluting at 32.66 min corresponding to GlcAGalNAc4S structure and (e) at 33.83 min corresponding to GlcAGalNAc6S structure. (f) MS2 at m/z 596.14 eluting at 32.15 min in Fig. 2c corresponding to IdoAGalNAc4S structure. (g) XIC at m/z 596.14 of a MPS II patient (sample ID 0984) showing the presence of unique IdoA2SGalNAc and IdoA2SGalNAc4S glycoforms, and (hi) their corresponding MS2 spectra. Additional MS2 spectra of GAG-NRE ions at m/z 596.14 are displayed in Suppl. Fig. 4 and for other GAG-NREs in Suppl. Fig. 5. The glycan geometric symbols are defined in Fig. 1. Red hexagon is the 2-AB label
Fig. 3
Fig. 3
GAG-NRE profiles obtained from urine of MPS I and MPS II patients and age-matched controls. The profiles were obtained from (a) a naïve MPS IH patient (sample ID 4776) (b) a naïve MPS IH patient (sample ID 1327) (c) the HSCT treated MPS IH patient of a (sample ID 1263) (d) the HSCT treated MPS IH patient of b (sample ID 1314) and from (ef) two MPS IS patients on ERT (sample IDs 0381 and 1305, respectively) and (gh) two MPS II patients on ERT (sample IDs 0984 and 0611, respectively). Samples from age-matched control individuals are presented with grey bars and from MPS patients with blue bars. The glycan structures are graphically represented by geometric symbols (see Fig. 1). GAG-NREs are displayed as relative abundance of peak intensities of each specific GAG-NRE versus total GAG-NREs. Samples were run in technical triplicates from which means and SDs (error bars) were calculated
Fig. 4
Fig. 4
LC–MS/MS of GAG-NRE trisaccharide glycoforms. MS2 spectra of three characteristic GAG-NRE trisaccharide with terminal glucosamine residues obtained from urine of a MPS IIIc patient (a) GlcNH2UAGlcNAc(6S), (b) GlcNH2UAGlcNS(6S) and (c) GlcNH2(6S)UAGlcNS(6S) and (d) GAG-NRE profiles of urine samples of one naïve MPS IIIc patient (blue bars) and one age-matched control (grey bars). For further details, see legend of Fig. 3
Fig. 5
Fig. 5
GAG-NRE profiles obtained from urine of MPS IVa and MPS VI patients and their age-matched controls. (ab) Urinary GAG-NREs of MPS IVa patients on ERT (blue bars, sample IDs 0941 and 5107, respectively) and their controls (grey bars). (c) XIC at m/z 420.11 corresponding to GalNAc6S and GalNAc4S GAG-NREs in two MPS IVa patients and their age matched-controls. Age at sampling is stated within parenthesis. Insert: The diagnostic GalNAc6S/GalNAc4S ratio of 11 control urine samples compared to MPS IVa patients (n = 2). (d) GAG-NRE profiles obtained from urine of a naïve MPS VI patient (blue bars, sample ID 0810) before and (e) after HSCT treatment (blue bars, sample ID 1286) and their age-matched controls (grey bars). For further details, see legend of Fig. 3
Fig. 6
Fig. 6
GAG-NRE profiles obtained from urine of MPS IH and MPS VI patients and their age-matched controls. The relative abundance (peak intensity) of each GAG-NRE residue was here normalized towards the sum of the relative abundance (peak intensities) of the internal disaccharides (ΔUAGalNAc4S and ΔUAGalNAc6S) and expressed in percentages. The profiles were obtained from urine samples of (a) a naïve MPS IH patient (sample ID 4776), (b) a naïve MPS IH patient (sample ID 1327), (c) the HSCT treated MPS IH patient in a (sample ID 1263), (d) the HSCT treated MPS IH patient in b (sample ID 1314), (e) a naïve MPS VI patient (sample ID 0810) and (f) the ERT treated MPS VI patient in e (sample ID 1286). GAG-NREs from control individuals are presented with grey bars and those from MPS patients with blue bars. The glycan structures are graphically represented by geometric symbols, see Fig. 1. Samples were run in technical triplicates, from which means and SDs (error bars) were calculated

References

    1. Platt FM, d’Azzo A, Davidson BL, Neufeld EF, Tifft CJ. Lysosomal storage diseases. Nat. Rev. Dis. Primers. 2018;4(1):27. doi: 10.1038/s41572-018-0025-4. - DOI - PubMed
    1. Stapleton M, Arunkumar N, Kubaski F, Mason RW, Tadao O, Tomatsu S. Clinical presentation and diagnosis of mucopolysaccharidoses. Mol. Genet. Metab. 2018;125(1–2):4–17. doi: 10.1016/j.ymgme.2018.01.003. - DOI - PubMed
    1. Verheyen S, Blatterer J, Speicher MR, Bhavani GS, Boons GJ, Ilse MB, Andrae D, Spross J, Vaz FM, Kircher SG, Posch-Pertl L, Baumgartner D, Lubke T, Shah H, Kaissi A, Girisha A, Plecko KM. Novel subtype of mucopolysaccharidosis caused by arylsulfatase K (ARSK) deficiency. J. Med. Genet. 2022;59(10):957–964. doi: 10.1136/jmedgenet-2021-108061. - DOI - PMC - PubMed
    1. Clarke LA, Wraith JE, Beck M, Kolodny EH, Pastores GM, Muenzer J, Rapoport DM, Berger KI, Sidman M, Kakkis ED, Cox GF. Long-term efficacy and safety of laronidase in the treatment of mucopolysaccharidosis I. Pediatrics. 2009;123(1):229–240. doi: 10.1542/peds.2007-3847. - DOI - PubMed
    1. Hampe, C.S., Wesley, J., Lund, T.C., Orchard, P.J., Polgreen, L.E., Eisengart, J.B., McLoon, L.K., Cureoglu, S., Schachern, P., McIvor, R.S.: Mucopolysaccharidosis type I: Current treatments, Limitations, and prospects for improvement. Biomolecules. 11(2) (2021). 10.3390/biom11020189 - PMC - PubMed

Publication types

LinkOut - more resources