. 2023 Sep 4;220(9):e20230054.
doi: 10.1084/jem.20230054. Epub 2023 Jul 18.

TLR7/8 stress response drives histiocytosis in SLC29A3 disorders

Affiliations

TLR7/8 stress response drives histiocytosis in SLC29A3 disorders

Takuma Shibata et al. J Exp Med. .

Abstract

Loss-of-function mutations in the lysosomal nucleoside transporter SLC29A3 cause lysosomal nucleoside storage and histiocytosis: phagocyte accumulation in multiple organs. However, little is known about the mechanism by which lysosomal nucleoside storage drives histiocytosis. Herein, histiocytosis in Slc29a3-/- mice was shown to depend on Toll-like receptor 7 (TLR7), which senses a combination of nucleosides and oligoribonucleotides (ORNs). TLR7 increased phagocyte numbers by driving the proliferation of Ly6Chi immature monocytes and their maturation into Ly6Clow phagocytes in Slc29a3-/- mice. Downstream of TLR7, FcRγ and DAP10 were required for monocyte proliferation. Histiocytosis is accompanied by inflammation in SLC29A3 disorders. However, TLR7 in nucleoside-laden splenic monocytes failed to activate inflammatory responses. Enhanced production of proinflammatory cytokines was observed only after stimulation with ssRNAs, which would increase lysosomal ORNs. Patient-derived monocytes harboring the G208R SLC29A3 mutation showed enhanced survival and proliferation in a TLR8-antagonist-sensitive manner. These results demonstrated that TLR7/8 responses to lysosomal nucleoside stress drive SLC29A3 disorders.


Conflict of interest statement

Disclosures: T. Shibata reported non-financial support from Invivogen outside the submitted work. Additionly, T. Shibata has a patent to Human TLR8 Tg pending. K. Miyake reported grants from Daiichi Sankyo Co. Ltd. outside the submitted work. Additionly, K. Miyake had a patent to P2018-193376A issued by The University of Tokyo. No other disclosures were reported.

Figures
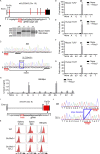
Figure S1.
Figure S1.
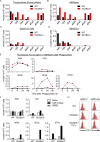
Generation of Slc29a3−/− and Tlr7−/− mice. (A and I) Genomic configuration of Slc29a3 and Tlr7 genes showing 20mer gRNA target sites to introduce a mutation into exon 2 of Slc29a3 and exon 5 of Tlr7. The PAM sequence is highlighted by the red box. (B) Genomic PCR with the primer set (Fw and Rv) shown in A reveals an insertional mutation in the targeted allele of Slc29a3. (C) Direct sequencing of the gRNA target site of Slc29a3. The inserted sequence containing the stop codon is shown by the blue box. (D–G) NF-κB reporter assay using HEK293T cells transfected with TLR7 and human Unc93B1. Transfected cells were left unstimulated or stimulated with indicated nucleoside ligands (100 μM) with or without polyU (5 μg/ml). The results are represented as mean values ± SD of triplicates. (H) IL-12 p40 production by BM-Mphs left unstimulated or stimulated with a combination of polyU (1 μg/ml) and the indicated nucleoside (100 μM). The results are represented by mean values ± SD of triplicates. (J) Sequence data of the gRNA target site on the Tlr7 allele showing a 4-bp deletion in the fifth exon of Tlr7 (blue). (K) FACS analyses show the lack of TLR7 protein in splenic B cells, splenic monocytes, and BM-derived pDCs in Slc29a3‒/‒ Tlr7‒/‒ mice. Red and gray histograms represent intracellular staining with and without anti-TLR7 mAb, respectively. The data shown in D–H and K are representative of at least three independent experiments. *P < 0.05, **P < 0.01, and ***P < 0.001.
Figure 1.
Figure 1.
TLR7-dependent histiocytosis in Slc29a3‒/‒ mice. (A) Amounts of nucleosides in the indicated organs. Each dot represents a value (nanomole/100 mg tissue) from each mouse (n = 3). (B) Representative spleen images from 6-mo-old mice (top). Scale bar, 1 cm. The bottom panel shows the spleen weight (n = 6). (C) Percentages of NK1.1 Ly6G CD11b+ monocytes, CD19+ B cells, CD3ε+ T cells, and PDCA1+ pDCs in the CD45.2+ splenocytes from the indicated mice (n = 5). (D) Immunohistochemistry showing F4/80 expression in indicated organs of tested mice. Scale bar, 400 μm. (E and F) Amounts of accumulated nucleosides (nanomoles) in 107 cells of WT and Slc29a3−/− BM-Mphs after treatment with 108 dying thymocytes (cell corpse) or 109 SRBCs for the indicated hours (E) or 24 h (F) were evaluated by LC-MS. The experiments were performed twice and yielded the same results. (G) Amounts of nucleosides in lysosomal fractions from 108 BM-Mphs (n = 3). (H) Staining of TLR7 and Flag-SLC29A3 in the J774.1 macrophage cell line at 1 h after phagocytosis of the DAPI-labeled cell corpse. Arrowheads indicate a phagosome containing cell corpses. Scale bar, 10 μm. The data shown in D and H are representative of at least four independent experiments. *P < 0.05, **P < 0.01, and ***P < 0.001.
Figure S2.
Figure S2.
TLR7-dependent monocytosis in Slc29a3−/− mice. (A) Dot plots show the number of splenocytes in the indicated mice (n = 6). (B) Representative FACS analyses of Siglec F NK1.1 splenocytes to show their expression of CD11b and Ly6G. (C) Each dot shows the percentage of neutrophils in whole splenocytes from the indicated mice (n = 6). (D and E) Representative FACS analyses of CD71+ Ter119+ erythroblasts (D) or CD19+ B and CD3ε+ T cells (E) in the spleen. (F and G) Representative FACS analyses of B and T cells (F) or neutrophils and monocytes (G) in PBMCs. (H and I) Percentages of CD11b+ Ly6G monocytes (n = 10) in PBMCs (H) and platelet counts (n = 16) in the peripheral blood (I) of 3-mo-old mice. (J) Schematic representation of the Tlr8 gene targeting strategy. The filled and open boxes represent the second exon of the Tlr8 gene and the neomycin resistance (Neo) gene, respectively. The 6 and 7.5 kb DNA fragments detected by a probe (gray box) in Southern blot screening are also shown. B, BamH I. (K and L) Percentages of platelet counts in the peripheral blood (K) and spleen size (L) of 4-mo-old mice (n = 5–8). (M and N) The percentages of NK1.1 Ly6G CD11b+ macrophages (M) and Ly6Chi and Ly6Clow macrophages (N) in the CD45.2+ splenocytes from the indicated mice (n = 5–8). *P < 0.05, **P < 0.01, and ***P < 0.001.
Figure S3.
Figure S3.
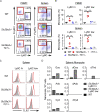
Nucleoside storage in Slc29a3−/− phagocytes. (A–D) Amount of nucleosides (in nanomole) in 107 thioglycolate-elicited pMphs (A), BM-Mphs (B), splenic B cells (C), and BM-pDCs (D) from WT (black) and Slc29a3−/− (red) mice. (E) Amount of nucleosides (in nanomoles) in 107 BM-Mphs of WT and Slc29a3−/− mice at the indicated time points after treatment with 108 dying thymocytes (cell corpse). (F) Amount of nucleosides (nanomoles) in 107 BM-Mphs of WT and Slc29a3−/− mice after 1-d treatment with 108 dying thymocytes or 109 SRBC. (G) Red histograms show cell surface expression of CD115 in Ly6Chi and Ly6Clow monocytes in the spleens of WT, Slc29a3‒/‒, and Slc29a3−/− Tlr7−/− mice. Gray histograms show staining with control mAb. The data shown in A–G are representative of at least two independent experiments.
Figure 2.
Figure 2.
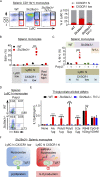
Accumulated monocytes store nucleosides and express TLR7. (A) Representative FACS analyses of CD11b+ Ly6G NK1.1 CD11Clow IA/IElow splenic and peripheral blood monocytes from WT, Slc29a3−/−, and Slc29a3−/− Tlr7−/− mice. The red and black squares show the gates of Ly6Chi and Ly6Clow monocytes, respectively. (B) Dot plots show the percentages of Ly6Clow and Ly6Chi monocytes in the peripheral blood (n = 4) and spleen (n = 5) from the indicated mice. (C) Red histograms show intracellular TLR7 expression levels in Ly6Chi and Ly6Clow monocytes from the indicated mice. Gray histograms show staining with the isotype control antibodies. (D) Amounts (nanomole/107 cells) of nucleosides in WT CD11b+ splenic monocytes or in Ly6Chi and Ly6Clow splenic monocytes from Slc29a3−/− mice. The experiments presented in D were performed twice and yielded the same results. The data shown in A and C are representative of at least three independent experiments. **P < 0.01 and ***P < 0.001.
Figure 3.
Figure 3.
Ly6Chi monocytes proliferate to increase Ly6Clow phagocytes. (A) Transcriptome analyses of Ly6Chi and Ly6Clow monocytes from the spleen. MA-plots displaying log2 normalized expression (x axes) and log2 fold change of expression (y axes) for the comparisons of Slc29a3−/− (n = 4) vs. WT (n = 4) monocytes and Slc29a3−/− Tlr7−/− (n = 4) vs. WT (n = 4) monocytes. More than 1.5-fold upregulated and downregulated genes are shown in red and blue, respectively. (B) GSEA of more than 1.5-fold changed genes in comparing Ly6Chi and Ly6Clow splenic monocytes from Slc29a3−/− and Slc29a3−/− Tlr7−/− mice with those from WT mice. Red and blue circles indicate positive and negative normalized enrichment scores (NES), respectively. Their sizes indicate the percentage of genes with a >1.5-fold change in each gene set. The color gradation indicates the q value of positive/negative enrichment. (C) Numbers of splenic Ly6Chi and Ly6Clow monocytes from WT (black circle) and Slc29a3−/− (red square) mice that survived for 4 d in vitro culture with M-CSF at the indicated concentrations. Mean values ± SD from triplicate samples are shown. The data are representative of three independent experiments. (D) Uptake of the thymidine analog EdU in vivo by monocytes from WT, Slc29a3−/−, and Slc29a3−/− Tlr7−/− mice (n = 4 or 5) at 3 h (upper) and 3 d (below) after intravenous EdU administration. Percentages of EdU+ cells in whole splenocytes are shown. (E) Number of PKH26+ cells in the indicated cell populations from the mice that had received PKH26-labelled dying thymocytes 1 h before analyses. Each dot represents the value for each mouse (n = 6). **P < 0.01 and ***P < 0.001.
Figure 4.
Figure 4.
TLR7 differentially induces proliferation and inflammation. (A) Expression of CX3CR1 and Ly6C in splenic CD11b+ Ly6G NK1.1 CD11Clow IA/IElow monocytes from WT, Slc29a3−/−, and Slc29a3−/− Tlr7−/− mice (top). Black and red gates show Ly6Chi CX3CR1hi and Ly6Chi CX3CR1low monocytes, respectively. The right panel shows the percentages of the two Ly6Chi monocyte subsets in the indicated mice (n = 4). (B) EdU uptake by each splenic monocyte subset during 1 h culture with 10 μM EdU. Each dot represents a value from a single mouse (n = 4). (C) Percentage of IL-6+ cells in each monocyte subset after in vitro stimulation with polyU (10 μg/ml) for 4 h. Brefeldin A (10 μg/ml) was added during cell stimulation. Each dot shows the values for each mouse from the indicated mice (n = 5). (D) Representative dot plot of EdU+ and IL-6+ cells in Ly6Chi splenic monocytes treated with polyU + brefeldin A for 4 h. EdU was added during the last hour of stimulation. (E) IL-12 p40 production by thioglycolate-elicited pMphs after stimulation with TLR7 and TLR9 ligands for 18 h. Alu, Alu retroelements. The results are represented as mean values ± SD from triplicate samples. (F) Schematics showing the induction of two distinct TLR7 responses, proliferation, and IL-6 production, in Slc29a3−/− mice. The data shown in D and E are representative of at least three independent experiments. ***P < 0.001.
Figure S4.
Figure S4.
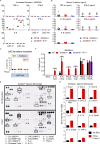
Cytokine production in Slc29a3‒/‒ mice. (A) mRNA expression of cytokines in splenic Ly6Chi and Ly6Clow monocytes from WT (black), Slc29a3−/− (red), and Slc29a3‒/‒ TLR7‒/‒ (blue) mice. Each dot shows the normalized read count per 1 million reads from the RNA-seq analyses for each monocyte subset (n = 4). (B) Serum cytokine levels were determined using ELISA. Sera were collected from 4-to-6-mo old mice (n = 14). **P < 0.01 and ***P < 0.001. ND, not detected. (C) The percentage of IL-6+ cells in Ly6Clow Fcgr4hi monocytes from indicated mice after in vitro stimulation with polyU (10 μg/ml) in the presence of brefeldin A (10 μg/ml) for 4 h. Each dot represents the value for each mouse (n = 5). (D and E) Slc29a3‒/‒ splenic monocytes were stimulated with polyU (10 μg/ml) for 18 h. Cytokines in the supernatants were detected using a cytokine antibody array (D). The results are shown as the mean signal intensity value (n = 2) for each cytokine spot (E). (F) IL-12 p40 production by BM-Mphs after stimulation with TLR7 and TLR9 ligands for 18 h. The results are represented as mean values ± SD from triplicate samples. *P < 0.05, **P < 0.01, and ***P < 0.001.
Figure 5.
Figure 5.
FcRγ and DAP10 mediate TLR7-dependent proliferation in Slc29a3−/− mice. (A) Number of splenic CD11b+ monocytes from WT (green) or Slc29a3−/− (black) mice that survived in vitro 4-d culture in the presence of 3 ng/ml M-CSF under serum-free conditions. Cells were treated with inhibitors of MEK (PD0325901, 1 μM), Syk (PRT062007, 1 μM; R788, 0.5 μM), β-catenin (PKF118-120, 5 μM), PI3K (wortmannin, 10 μM), AKT (afuresertib, 5 μM), mTORC1 (rapamycin, 0.5 μM), mTORC1 and 2 (Torin1, 250 nM), MyD88 (ST2825, 10 μM), and JNK (JNK-IN-8, 1 μM). Bar graphs represent mean values ± SD from triplicate samples. The data are representative of three independent experiments. (B, E, and H) Mean fluorescence intensity (MFI) of staining with activation- and phospho-specific Abs to signaling molecules in Ly6Chi monocytes from the indicated mice (n = 4–5). The colors of symbols in E denote mouse strains, as shown in C. (C and F) Spleen weight at 3–4 mo of age in the indicated mice (n = 11–32). Fcer1g, Tyrobp, and Hcst encode FcRγ, DAP12, and DAP10, respectively. (D and G) EdU uptake by CD11b+ Ly6G NK1.1 CD11Clow IA/IElow Ly6Chi splenic monocytes after 1-h culture with EdU in vitro. Each dot shows the percentage of EdU+ cells in splenic Ly6Chi monocytes from the indicated mice (n = 5). The colors of the symbols denote mouse strains, as shown in C or H. (I) The hypothetical model of TLR7-dependent proliferation in Slc29a3−/− monocytes. NS, not significant. *P < 0.05, **P < 0.01, and ***P < 0.001.
Figure S5.
Figure S5.
TLR8 drives SLC29A3 disorders. (A) mRNA expression of the ITAM adaptors in splenic Ly6Chi and Ly6Clow monocytes from WT (black), Slc29a3−/− (red), and Slc29a3−/− Tlr7−/− (blue) mice. Each dot represents the normalized read count per 1 million reads in the RNA-seq analyses (n = 4). (B) Expression of surface CD16/CD14 in HLA-DR+ CD15 CD56 PBMCs from the patient with the S184R SLC29A3 mutation and from healthy subjects. (C) Numbers of CD11b+ CD15 CD56 monocytes in PBMCs from the patients (red) and healthy subjects (black and gray) that survived 4 d of culture with M-CSF at the indicated concentrations. (D) Number of CD11b+ cells that survived 8 d. PBMCs were cultured with 5 ng/ml M-CSF in the absence or presence of the indicated inhibitors of Syk (1 μM R788), MEK1/2 (1 μM PD0325901), TLR8 (10 μM CPT9a), and TLR7 (10 μM DSR-139970). (E) Schematic representation of the Rosa26 locus, targeting vectors for the construction of human TLR7/8 transgenic mice, and targeted alleles. The targeting vectors contain both the neomycin resistance gene (Neo-STOP) flanked by loxP sites, human TLR7/8 cDNA, and the IRES-eGFP region flanked by frt sites. Cre recombinase removes floxed Neo-STOP (floxNeo) to initiate the expression of the transgene and eGFP. Arrows represent primer pairs for detecting homologous recombinant ES clones. SA, splice acceptor; CAG, CAG promoter; IRES, internal ribosome entry site; Neo-STOP, neomycin resistance gene; pA, polyadenylation signal. (F) Red histograms show eGFP expression of Ly6Chigh and Ly6Clow monocytes in the spleen from huTLR7 or huTLR8 Tg mice (Slc29a3‒/‒ Tlr7‒/‒ Rosa26 huTLR7/+ CAG-Cre or Slc29a3‒/‒ Tlr7‒/‒ Rosa26 huTLR8/+ Lyz2-Cre mice). The expression level of eGFP was designed to reflect that of huTLR7 and huTLR8. Gray histograms represent background in control mice (Slc29a3‒/‒ Tlr7‒/‒ or Slc29a3‒/‒ Tlr7‒/‒ Rosa26 huTLR8/+ mice). (G) White blood cell (WBC) count in peripheral blood of WT or Rosa26 huTLR8/+ Lyz2-Cre (hu TLR8 Tg) mice. (H) Representative spleen images of 4–5-mo-old mice (left). Scale bar: 1 cm. The right panel shows spleen weights (n = 5–8) of Slc29a3‒/‒ Tlr7‒/‒ mice (CTRL) and Slc29a3‒/‒ Tlr7‒/‒ Rosa26 huTLR7/+ mice (hu TLR7-Tg). (I) Representative FACS analyses of CD11b+ Ly6G NK1.1 CD11Clow IA/IElow splenic monocytes from Slc29a3‒/‒ Tlr7‒/‒ or Slc29a3‒/‒ Tlr7‒/‒ Rosa26 huTLR7/+ mice. The red and black squares show the gates of the Ly6Clow and Ly6Chi monocytes, respectively. The experiments using PBMCs from a patient with the S184R SLC29A3 mutation (B–D) were conducted once. NS, not significant. *P < 0.05, **P < 0.01, and ***P < 0.001.
Figure 6.
Figure 6.
TLR8 drives histiocytosis in SLC29A3 disorders. (A and B) Expression of surface CD16/CD14/CD115 (A and B) and intracellular TLR7/TlR8 (B) in HLA-DR+ CD15 CD56 PBMCs from a patient with the G208R SLC29A3 mutation and a healthy subject. Red and gray histograms show staining with the indicated and isotype-matched control antibodies, respectively. (C) The number of surviving CD11b+ CD15 CD56 monocytes in PBMCs from patients (red) or healthy subjects (black and gray) after 4 d of culture with M-CSF at the indicated concentrations. (D) PBMC-derived macrophages from the patient (red) or two control subjects (black and gray) were stimulated with the indicated TLR7 or TLR8 ssRNA ligands at the indicated concentrations. IL-6 production was evaluated using ELISA. The bars represent mean values ± SD from triplicate samples. (E) Representative spleen images of 3-mo-old mice (top). Scale bar, 1 cm. The bottom panel shows spleen weight (n = 10–14) of the indicated mice: Slc29a3−/− Tlr7−/− Rosa26 huTLR8/+ (black, Slc29a3−/− Tlr7−/−); Slc29a3−/− Tlr7−/− Rosa26 huTLR8/+ Lyz2-Cre (red, Slc29a3−/− Tlr7−/− huTLR8 Tg), and Rosa26 huTLR8/+ Lyz2-Cre mice (green, huTLR8 Tg). (F) Representative FACS analyses of CD11b+ Ly6G NK1.1 CD11Clow IA/IElow splenic monocytes from Slc29a3−/− Tlr7−/− Rosa26 huTLR8/+ (Slc29a3‒/‒ Tlr7‒/‒) or Slc29a3‒/‒ Tlr7‒/‒ Rosa26 huTLR8/+ Lyz2-Cre(Slc29a3‒/‒ Tlr7‒/‒ huTLR8 Tg) mice. Red and black squares show the gates of Ly6Clow and Ly6Chi monocytes, respectively. Dot plots show the percentages of Ly6Clow and Ly6Chi monocytes in the spleen of the indicated mice (n = 4). (G) CD11b+ cells that survived in vitro PBMC culture with 5 ng/ml M-CSF in the presence of the indicated inhibitors of Syk (1 μM R788), MEK1/2 (1 μM PD0325901), TLR8 (10 μM CPT9a), and TLR7 (10 μM DSR-139970). (H) The amounts (nanomole/107 cells) of nucleosides accumulated in PBMC-derived macrophages. The experiments presented in A–D, G, and H were performed twice and yielded the same results. ND, not detectable. **P < 0.01 and ***P < 0.001.

References

    1. Aderem, A., and Underhill D.M.. 1999. Mechanisms of phagocytosis in macrophages. Annu. Rev. Immunol. 17:593–623. 10.1146/annurev.immunol.17.1.593 - DOI - PubMed
    1. Akilesh, H.M., Buechler M.B., Duggan J.M., Hahn W.O., Matta B., Sun X., Gessay G., Whalen E., Mason M., Presnell S.R., et al. . 2019. Chronic TLR7 and TLR9 signaling drives anemia via differentiation of specialized hemophagocytes. Science. 363:eaao5213. 10.1126/science.aao5213 - DOI - PMC - PubMed
    1. Aluri, J., Bach A., Kaviany S., Chiquetto Paracatu L., Kitcharoensakkul M., Walkiewicz M.A., Putnam C.D., Shinawi M., Saucier N., Rizzi E.M., et al. . 2021. Immunodeficiency and bone marrow failure with mosaic and germline TLR8 gain of function. Blood. 137:2450–2462. 10.1182/blood.2020009620 - DOI - PMC - PubMed
    1. Baldwin, S.A., Beal P.R., Yao S.Y.M., King A.E., Cass C.E., and Young J.D.. 2004. The equilibrative nucleoside transporter family, SLC29. Pflugers Arch. 447:735–743. 10.1007/s00424-003-1103-2 - DOI - PubMed
    1. Baldwin, S.A., Yao S.Y.M., Hyde R.J., Ng A.M.L., Foppolo S., Barnes K., Ritzel M.W.L., Cass C.E., and Young J.D.. 2005. Functional characterization of novel human and mouse equilibrative nucleoside transporters (hENT3 and mENT3) located in intracellular membranes. J. Biol. Chem. 280:15880–15887. 10.1074/jbc.M414337200 - DOI - PubMed

Publication types