. 2023 Sep 1;133(17):e163325.
doi: 10.1172/JCI163325.

SF3B1 mutation and ATM deletion codrive leukemogenesis via centromeric R-loop dysregulation

Affiliations

SF3B1 mutation and ATM deletion codrive leukemogenesis via centromeric R-loop dysregulation

Martina Cusan et al. J Clin Invest. .

Abstract

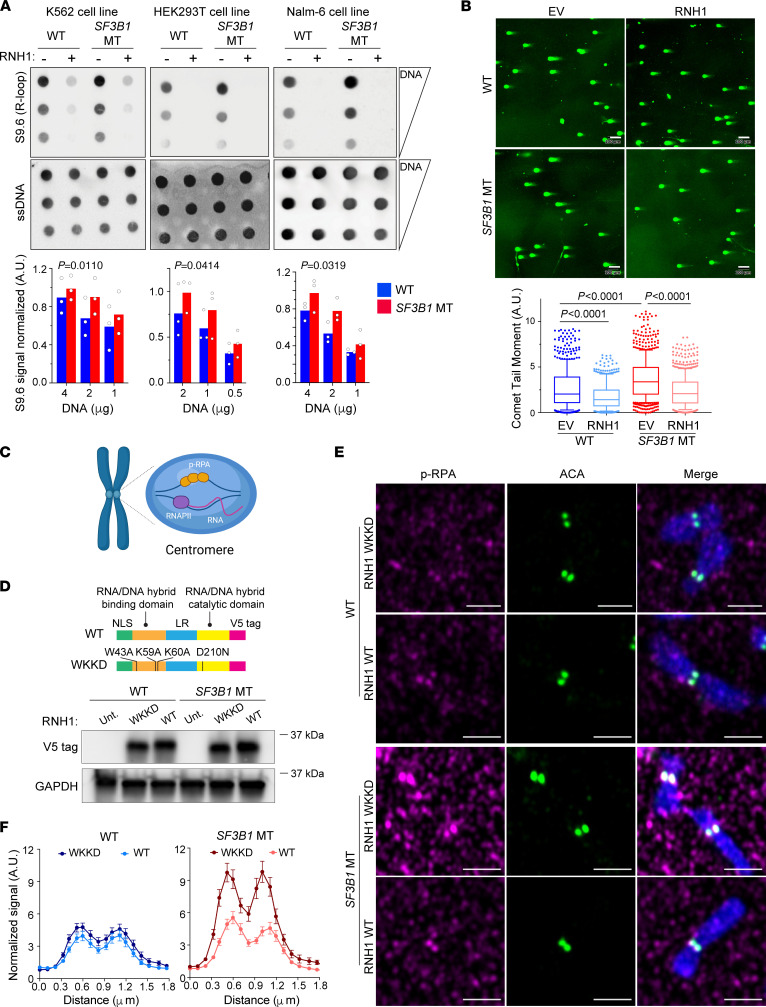
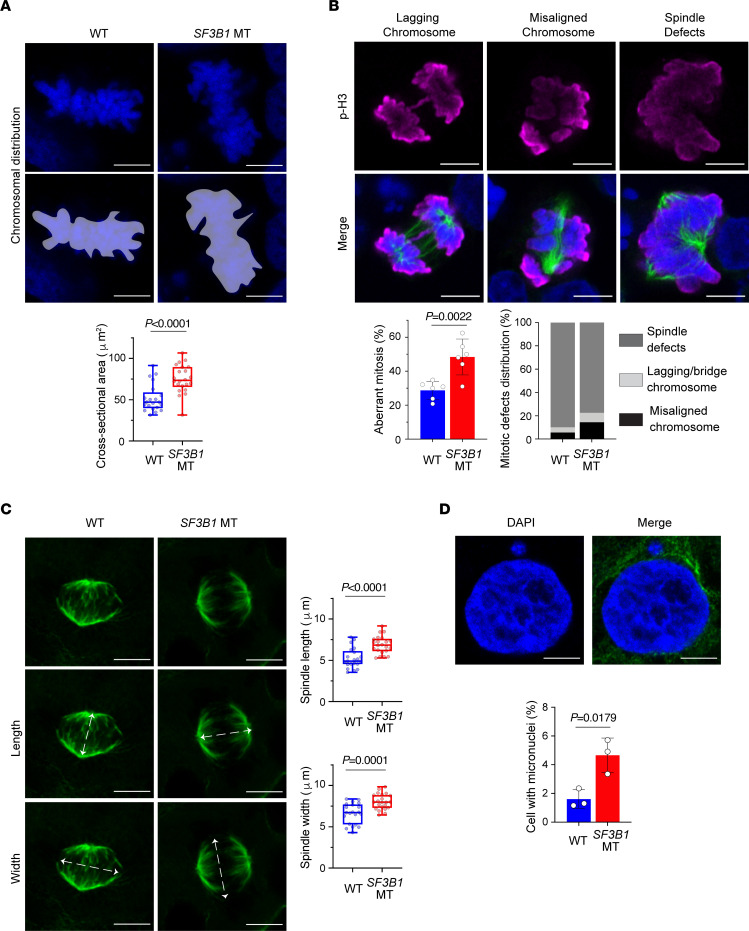
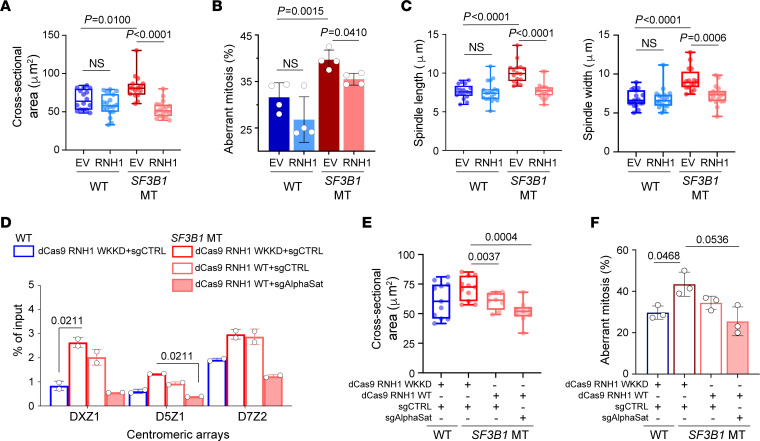
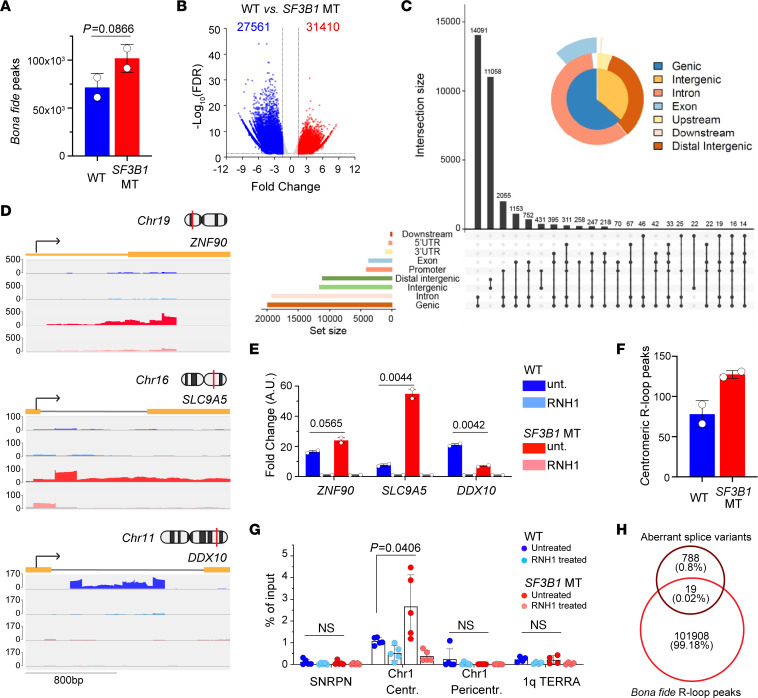
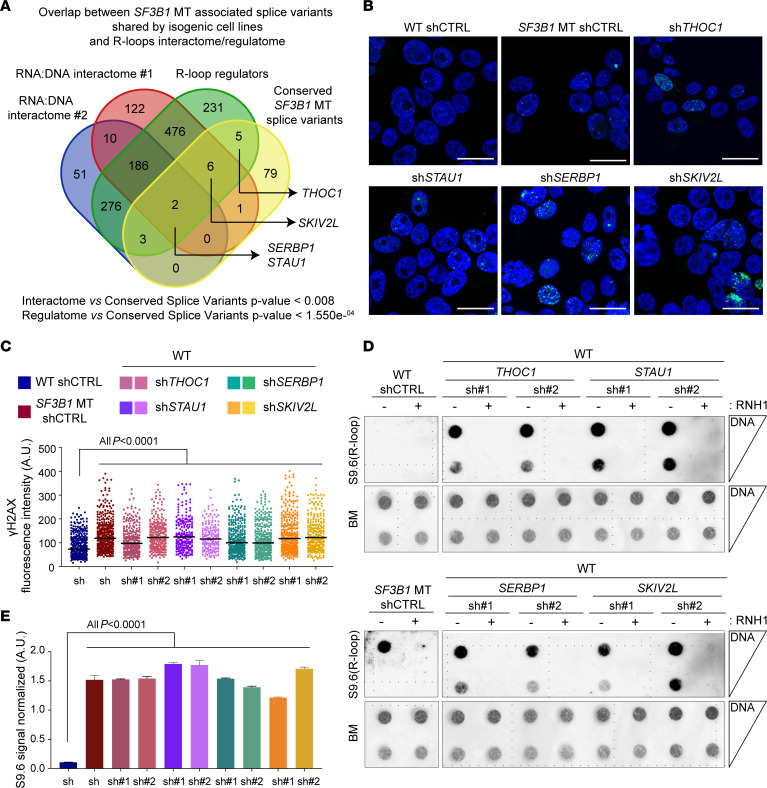
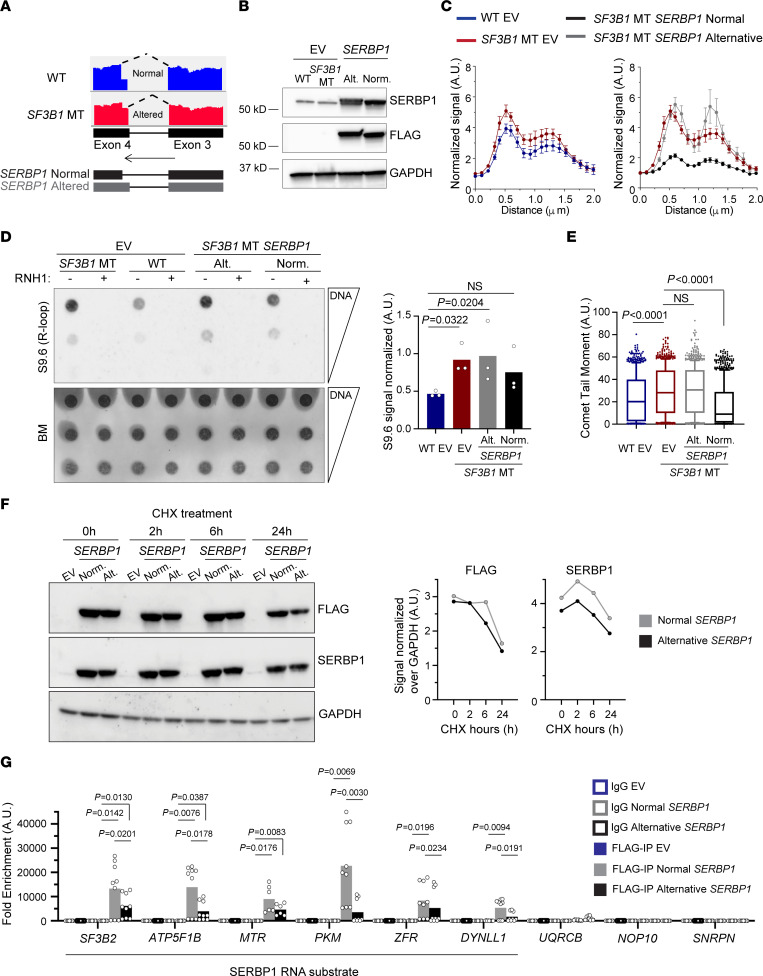
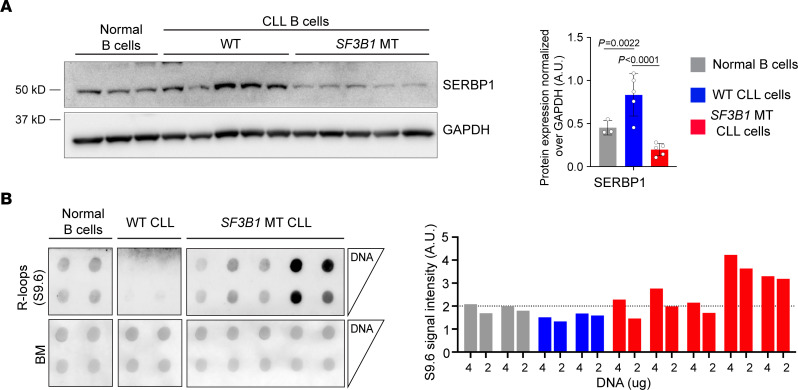
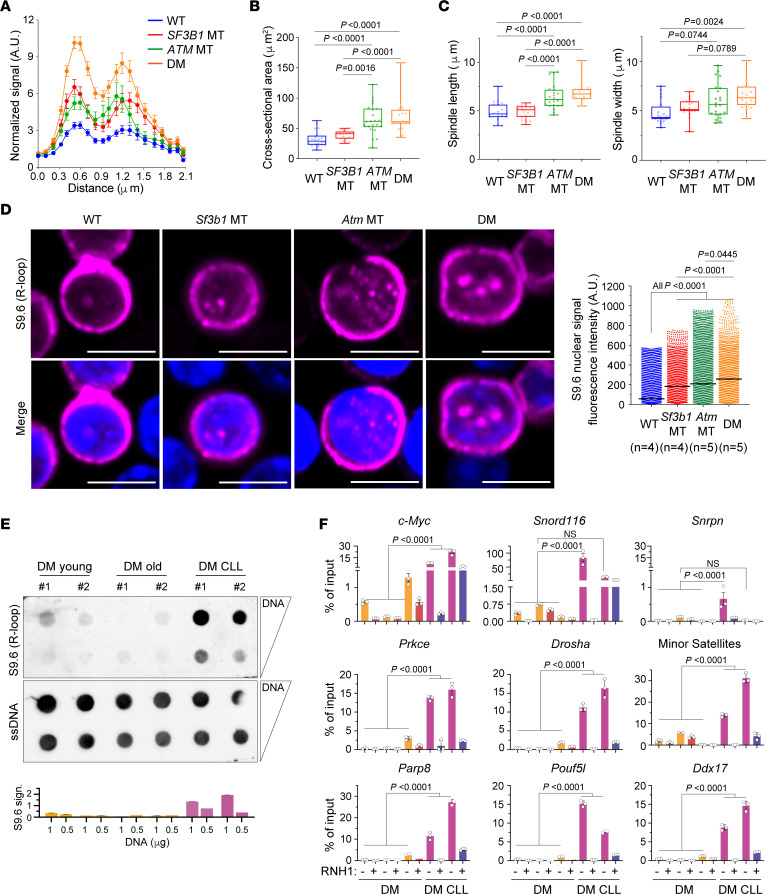
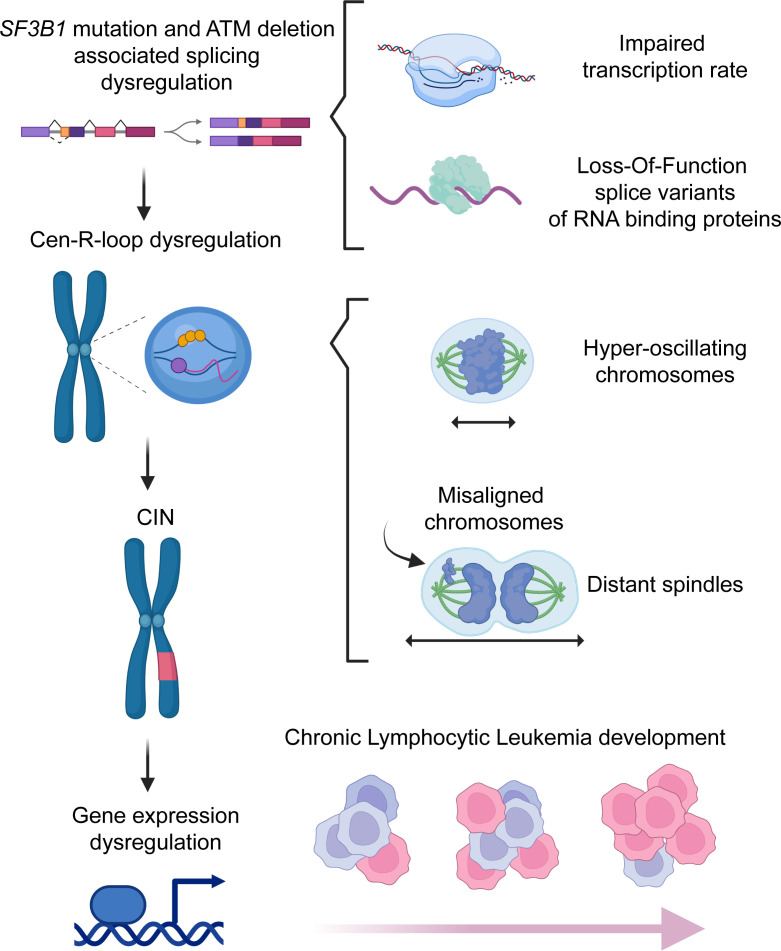
RNA splicing factor SF3B1 is recurrently mutated in various cancers, particularly in hematologic malignancies. We previously reported that coexpression of Sf3b1 mutation and Atm deletion in B cells, but not either lesion alone, leads to the onset of chronic lymphocytic leukemia (CLL) with CLL cells harboring chromosome amplification. However, the exact role of Sf3b1 mutation and Atm deletion in chromosomal instability (CIN) remains unclear. Here, we demonstrated that SF3B1 mutation promotes centromeric R-loop (cen-R-loop) accumulation, leading to increased chromosome oscillation, impaired chromosome segregation, altered spindle architecture, and aneuploidy, which could be alleviated by removal of cen-R-loop and exaggerated by deletion of ATM. Aberrant splicing of key genes involved in R-loop processing underlay augmentation of cen-R-loop, as overexpression of the normal isoform, but not the altered form, mitigated mitotic stress in SF3B1-mutant cells. Our study identifies a critical role of splice variants in linking RNA splicing dysregulation and CIN and highlights cen-R-loop augmentation as a key mechanism for leukemogenesis.

Keywords: Cancer; DNA repair; Oncology.


Conflict of interest statement

Conflict of interest: The authors have declared that no conflict of interest exists.

Figures

Figure 1
Figure 1. SF3B1 mutation triggers cen-R-loop accumulation.
(A) R-loop level quantified by dotblot assay with S9.6 antibody in K562, HEK293T, and Nalm-6 SF3B1-WT and -MT cells. Serial DNA dilutions starting from 4 mg (K562 and Nalm-6) or 2 mg (HEK293T). Single-strand DNA (ssDNA) blotting was used as loading control. Top: Representative image. Bottom: S9.6 signal quantification over ssDNA signal. Bar graphs represent mean; dots represent biological replicates. Two-way paired ANOVA test. (B) Representative images (top) of neutral comet assay for double-strand breaks in Nalm-6 SF3B1-WT and -MT cells with overexpression of either empty vector (EV) or RNaseH1 (RNH1) and relative comet tail moment (bottom) in 3 biological replicates. Scale bars: 100 μm. Total comets quantified range from 435 to 742 cells. Box plots show the median and 25th and 75th percentiles, with whiskers extending to minimum and maximum values. Two-tailed unpaired t test followed by Bonferroni’s post hoc test. (C) Cen-R-loops are recognized and coated by phospho–RPA S33 (p-RPA). RNAPII, RNA polymerase II. Created with BioRender (biorender.com). (D) Top: RNH1 WT and mutant vectors. NLS, nuclear localization signal; LR, linker region. Bottom: Detection of overexpression of RNH1 with V5 tag by immunoblot in Nalm-6 SF3B1-WT and -MT cells overexpressing either WT or WKKD RNH1 protein. GAPDH was used as loading control. (E) Representative images of cen-R-loops detected by p-RPA (red) and ACA (green) immunofluorescence. Scale bars: 2 μm. (F) Quantified centromeric p-RPA signal normalized to background signal near centromeres (see Methods). Graphs represent mean ± SEM. The number of chromosomes quantified ranges from 46 to 67. SF3B1 MT overexpressing WKKD vs. WT RNH1, P = 0.0001, Wilcoxon’s paired test.
Figure 2
Figure 2. SF3B1-mutant cells have mitotic stress, spindle structure defects, and micronuclei.
(A) Top: Representative confocal maximum intensity projections of entire Z-stack images for measurement of chromosome distribution and alignment during metaphase. Scale bars: 5 μm. Purple areas indicate the area measured. Bottom: Quantification of chromosome area above. (B) Top: Representative images of mitotic cells with lagging chromosomes and chromosomes bridges, misaligned chromosomes, and multipolar spindles. Mitotic cells marked with H3–serine 10 (p-H3) antibody (magenta); spindles marked with α-tubulin antibody (green); nuclei marked with DAPI (blue). Scale bars: 5 μm. Bottom: Quantification of aberrant mitosis frequency, expressed as percentage of total mitosis encountered, and distribution of mitotic defects expressed as percentage of total aberrant mitotic cells. (C) Left: Representative maximum intensity projections of mitotic spindle architecture of cells in metaphase. Arrows indicate definition of length (middle panel) and width (bottom panel). Green, α-tubulin. Scale bars: 5 μm. Right: Relative spindle length and width quantification. (D) Top: Representative image of cell with micronuclei. Blue, nuclei (DAPI); green, α-tubulin. Scale bars: 5 μm. Bottom: Quantification of frequency of micronuclei. Data are expressed as percentage of total cells. All panels show data in HEK293T SF3B1-WT and -MT cells. Box plots show the median and 25th and 75th percentiles, with whiskers extending to minimum and maximum values. Bar plots represent mean ± SD. Each dot represents a biological replicate. Two-tailed unpaired t test.
Figure 3
Figure 3. SF3B1 mutation–associated cen-R-loop dysregulation leads to aneuploidy.
(AC) Analysis of 2-dimensional cross-sectional area of the entire body of chromosomes (A) and aberrant mitosis frequency (B) and spindle length and width (C) in HEK293T SF3B1 WT and MT overexpressing either empty vector (EV) or WT RNH1. (D) DRIP-qPCR in HEK293T SF3B1 WT and MT overexpressing either dCas9–GFP–RNaseH1 WKKD (WKKD RNH1) or dCas9–GFP–RNaseH1 WT (WT RNH1) in combination with either sgRNA guide control (sgCTRL) or sgRNA targeting α-satellite centromeric repeats (sgAlphaSat). Centromeric arrays: The chromosome is specified by the number following the “D”; and the array is specified by the number following the “Z.” Two-way ANOVA test. (E and F) Analysis of 2-dimensional cross-sectional area of the entire body of chromosomes (E) and aberrant mitosis frequency (F) in cells from D. Box plots show the median and 25th and 75th percentiles, with whiskers extending to minimum and maximum values. Bar graphs represent mean ± SD. Each dot represents a biological replicate. Two-tailed unpaired t test followed by Bonferroni’s post hoc test, except in D.
Figure 4
Figure 4. SF3B1 mutation–associated R-loops have minimal overlapping with splice variants.
(A) Quantification of genome-wide bona fide R-loops in Nalm-6 WT and SF3B1 MT detected by DRIP-seq. (B) Volcano plot of differential bona fide R-loops between SF3B1-MT and -WT cells. Significant differential peaks cutoff as FDR < 0.05 and fold change > 1.5. (C) Genomic distribution of differential upregulated bona fide R-loops associated with SF3B1 mutation with UpSet and PieChart plots. Intersection size indicates the number of R-loops. The black dots connected with lines represent overlapped R-loops. (D) Integrative Genomics Viewer (IGV) of R-loops profiled by DRIP-seq over indicated upregulated and downregulated genes. (E) Validation of differential R-loop peaks in D by DRIP-qPCR assay. RNH1 treatment is included as background control. Graphs represent qPCR results of biological duplicates; fold change over paired RNH1 treatment is presented as mean ± SEM; 2-tailed unpaired t test. (F) Quantification of centromeric bona fide R-loops detected by DRIP-seq. (G) SF3B1 mutation–associated cen-R-loops validated using DRIP-qPCR in mitotic cells with and without SF3B1 mutation. Chromosome 1 (Chr1) centromere, pericentromere, and telomeric 1q TERRA regions tested for R-loop accumulation. SNRPN was used as negative control. RNH1-treated samples were used as an R-loop background control. Graphs represent qPCR results expressed as percentage of input mean ± SEM. Dots represent technical replicates of 2 biological replicates. (H) Venn diagram demonstrates overlap between Nalm-6 SF3B1 MT–associated alternative splice variants and bona fide R-loop peaks in WT (blue) and MT (red) SF3B1.
Figure 5
Figure 5. R-loop accumulation is induced by SF3B1 mutation–associated loss-of-function alternative splice variants.
(A) Venn diagram of overlapped conserved splice variants among SF3B1-MT isogenic cell lines (HEK293T, K562, and Nalm-6; Supplemental Table 1); DNA:RNA hybrid interactome in human cell studies: interactome #1 (26), interactome #2 (21, 28), and R-loop regulatory proteins data set (27). Hypergeometric distribution test. (BE) Representative images of γH2AX foci immunofluorescence staining (B), R-loops detected by dotblot analysis (D), and relative quantification (C and E) in HEK293T cells with silencing of THOC1, STAU1, SERBP1, and SKIV2L genes. γH2AX foci are pseudocolored in green, nuclei in blue. Scale bars: 20 μm; >100 cells were analyzed for each group. Mean ± SD is plotted. Two-tailed unpaired t test. For R-loops, serial dilutions starting from 500 ng DNA. Blue methylene (BM) staining was used as loading control. Bars represent mean ± SD of S9.6 signal quantification normalized on relative BM. One-way ANOVA test.
Figure 6
Figure 6. SF3B1 mutation modulates R-loop metabolism through SERBP1 alternative splicing.
(A) IGV of RNA-Seq reads covering the cryptic 3′ splice site of the SERBP1 gene in SF3B1-WT and -MT Nalm-6 cells. (B) Immunoblots of HEK293T SF3B1-WT and -MT cells overexpressing either FLAG empty vector (EV) or SERBP1 FLAG-tagged isoforms. (C) Quantification of centromeric p-RPA immunofluorescence signal normalized to background near centromeres from cells described in B. SF3B1-MT EV cell line results are reported in 2 different graphs for better visualization. Wilcoxon’s paired test. HEK293T WT EV vs. SF3B1-MT EV, P < 0.0001; SF3B1-MT EV vs. SF3B1-MT SERBP1 normal isoform, P < 0.0001; SF3B1-MT EV vs. SF3B1-MT SERBP1 alternative isoform, P = NS. The number of chromosomes quantified ranges from 39 to 50. (D) Representative R-loops (left) and relative quantification (right) from dotblot assay in cells from B. Bars represent mean; dots represent biological replicates. One-way ANOVA comparison test. (E) Alkaline comet assay in cells as in B. Box plots show the median and 25th and 75th percentiles, with whiskers extending to minimum and maximum values. One-way ANOVA Dunnett’s multiple test. Comets quantified range from 783 to 995. (F) Left: Representative immunoblot of HEK293T cells as in B, treated for the indicated times with cycloheximide (CHX). Right: FLAG and SERBP1 immunoblot quantification normalized over GAPDH. (G) eCLIP-qPCR performed with HEK293T cells transfected as in B. SF3B2, ATP5F1B, MTR, PKM, ZFR, and DYNLL1 were selected based on SERBP1 predicted mRNA target and R-loop–forming genes associated with SF3B1 mutation. SNRPN, NOP10, and UQRCB were selected as negative controls.
Figure 7
Figure 7. SF3B1-mutant CLL cells have R-loop dysregulation.
(A) Left: Representative immunoblot of SERBP1 in normal (n = 3), CLL SF3B1-WT (n = 5), and SF3B1-MT (n = 5) B cells. Right: Relative immunoblot quantification normalized over GAPDH. Bar graphs represent data mean ± SD; dots represent biological replicates. Student’s 2-tailed t test followed by Bonferroni’s post hoc test. (B) Left: Dotblot assay for R-loop quantification in normal (n = 2), CLL SF3B1-WT (n = 2), and CLL SF3B1-MT (n = 5) B cells. Serial dilution of DNA starting from 4 μg. BM staining was used as loading control. Right: Relative dotblot S9.6 signal quantification normalized over BM signal. Each bar represents 1 biological replicate.
Figure 8
Figure 8. R-loop accumulation is a feature of murine CLL with Sf3b1 mutation and Atm deletion.
(A) Quantification of centromeric p-RPA signal in Nalm-6 Cas9 SF3B1-WT and -MT cells with and without ATM knockdown. Two-tailed paired t test, Nalm-6 WT vs. SF3B1 MT, or vs. ATM MT, or vs. DM, P < 0.0001; ATM MT vs. DM, P < 0.0001; SF3B1 MT vs. DM, P < 0.0001. The number of chromosomes quantified ranges from 56 to 113. (B and C) Quantification of 2-dimensional cross-sectional area of the entire body of chromosomes (B) and spindle length and width (C) in metaphases of cells described in A. Box plots show the median and 25th and 75th percentiles, with whiskers extending to minimum and maximum values. Dots represent biological replicates. Two-tailed unpaired t test followed by Bonferroni’s post hoc test. (D) Left: Representative images of R-loops detected by IF with S9.6 antibody (red) in WT, Sf3b1-MT, Atm-deleted (MT), and Sf3b1-MT and Atm-deleted (DM) murine splenic B cells. Scale bars: 5 μm. Right: Quantification of S9.6 nuclear fluorescence intensity. Number of mice used for each genotype is indicated. The number of cells quantified ranges from 2135 to 3690. Center lines show the medians. Two-tailed unpaired t test followed by Bonferroni’s post hoc test. (E) Top: Dotblot assay using splenic B cells derived from DM mice without and with CLL. Bottom: Relative S9.6 signal quantification normalized over ssDNA signal. Each bar represents 1 biological replicate. (F) DRIP-qPCR analysis of R-loop enrichment over negative (Snrpn) and positive (c-Myc, Snord116) loci for R-loop accumulation, over representative genes (Prkce, Drosha, Ddx17, Parp8, Pouf5l, and Akt) and centromeric regions (minor satellites), in normal and CLL B cells derived from DM mice. RNH1 treatment is included as control. Data are presented as mean ± SEM (n = 3, technical replicates). One-way ANOVA Tukey’s test. Untreated vs. RNH1-treated is significant for all samples tested (P < 0.0001).
Figure 9
Figure 9. Working model.
SF3B1 mutation and ATM deletion together promote cen-R-loop accumulation, impairing mitotic spindle dynamics and chromosome alignment, resulting in CIN and CLL development. SF3B1 mutation promotes global and centromeric R-loop formation through RNAPII transcription rate impairment and RBP loss-of-function alternative splice variants. Cen-R-loops alter mitotic spindle dynamics and chromosome segregation, resulting in CIN. ATM deletion in SF3B1-MT cells exacerbates cen-R-loops and CIN, promoting CLL development. Created with BioRender (biorender.com).

References

    1. Wang L, et al. SF3B1 and other novel cancer genes in chronic lymphocytic leukemia. N Engl J Med. 2011;365(26):2497–2506. doi: 10.1056/NEJMoa1109016. - DOI - PMC - PubMed
    1. Ogawa S. Genetics of MDS. Blood. 2019;133(10):1049–1059. doi: 10.1182/blood-2018-10-844621. - DOI - PMC - PubMed
    1. Landau DA, et al. Mutations driving CLL and their evolution in progression and relapse. Nature. 2015;526(7574):525–530. doi: 10.1038/nature15395. - DOI - PMC - PubMed
    1. Kipps TJ, et al. Chronic lymphocytic leukaemia. Nat Rev Dis Primers. 2017;3(1):16096. doi: 10.1038/nrdp.2016.96. - DOI - PMC - PubMed
    1. Yin S, et al. A murine model of chronic lymphocytic leukemia based on B cell-restricted expression of Sf3b1 mutation and Atm deletion. Cancer Cell. 2019;35(2):283–296.e5. doi: 10.1016/j.ccell.2018.12.013. - DOI - PMC - PubMed

Publication types

MeSH terms