. 2023 Sep 1;133(17):e171554.
doi: 10.1172/JCI171554.

The latent reservoir of inducible, infectious HIV-1 does not decrease despite decades of antiretroviral therapy

Affiliations

The latent reservoir of inducible, infectious HIV-1 does not decrease despite decades of antiretroviral therapy

Natalie F McMyn et al. J Clin Invest. .

Abstract

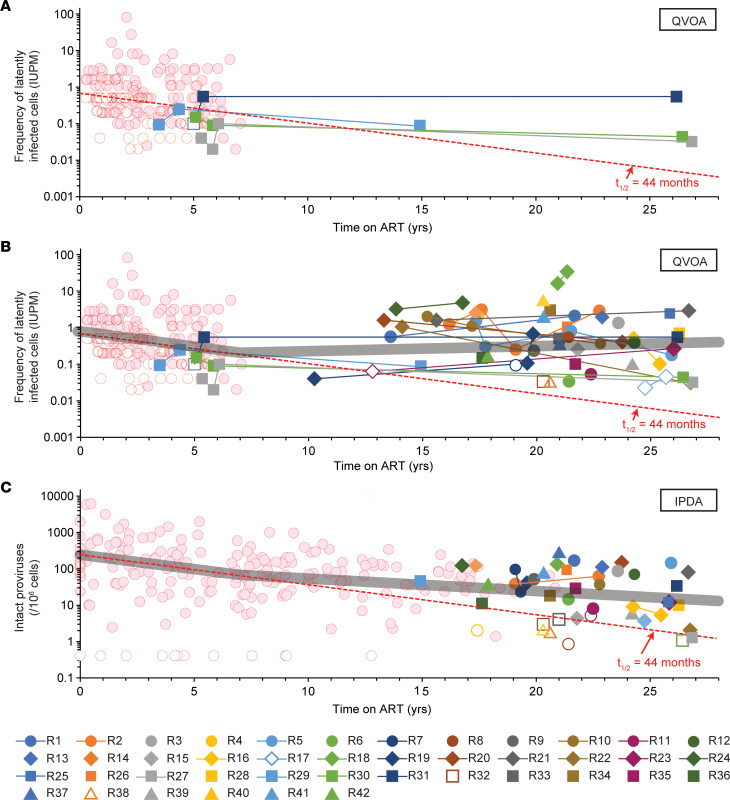
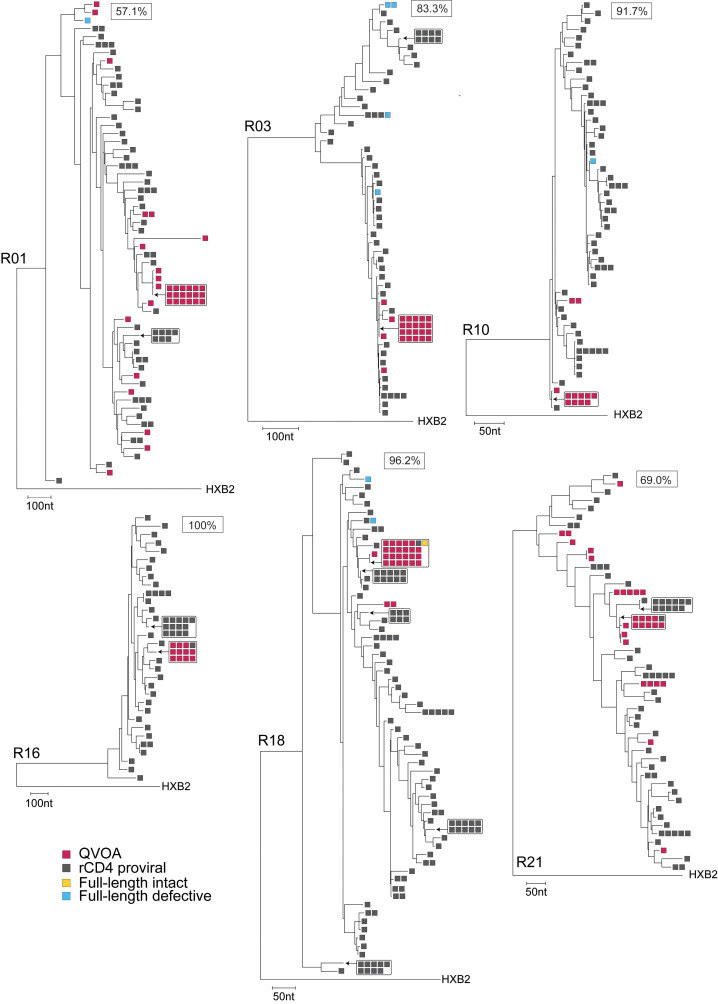
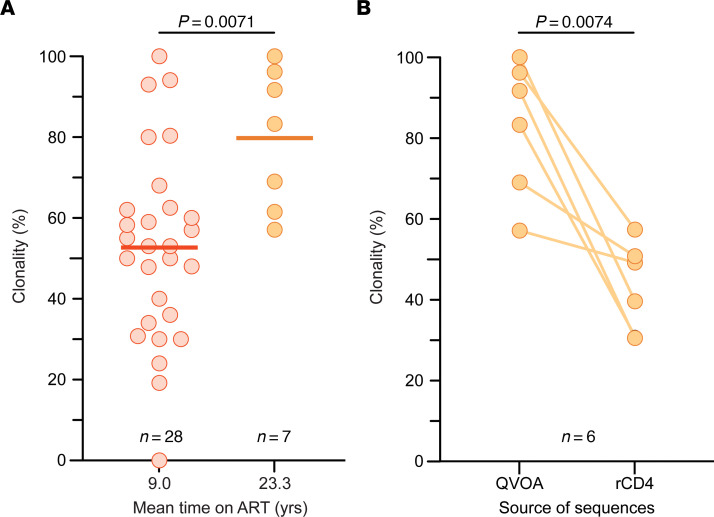
HIV-1 persists in a latent reservoir in resting CD4+ T cells despite antiretroviral therapy (ART). The reservoir decays slowly over the first 7 years of ART (t1/2 = 44 months). However, whether decay continues with long-term ART is unclear. Recent integration site studies indicate gradual selection against inducible, intact proviruses, raising speculation that decades of ART might allow treatment interruption without viral rebound. Therefore, we measured the reservoir in 42 people on long-term ART (mean 22 years) using a quantitative viral outgrowth assay. After 7 years of ART, there was no long-term decrease in the frequency of inducible, replication-competent proviruses but rather an increase with an estimated doubling time of 23 years. Another reservoir assay, the intact proviral DNA assay, confirmed that reservoir decay with t1/2 of 44 months did not continue with long-term ART. The lack of decay reflected proliferation of infected cells. Most inducible, replication-competent viruses (79.8%) had env sequences identical to those of other isolates from the same sample. Thus, although integration site analysis indicates changes in reservoir composition, the proliferation of CD4+ T cells counteracts decay, maintaining the frequency of inducible, replication-competent proviruses at roughly constant levels over the long term. These results reinforce the need for lifelong ART.

Keywords: AIDS/HIV; Molecular biology; T cells; Virology.


Conflict of interest statement

Conflict of interest: RFS is an inventor on a patent application for the intact proviral DNA assay (IPDA) (patent no. PCT/US16/28822) filed by Johns Hopkins University and licensed by AccelevirDx. GML is CEO of AccelevirDx. HM is an employee of AccelevirDx.

Figures

Figure 1
Figure 1. Plasma HIV-1 RNA levels and CD4+ T cell counts of representative participants R16, R17, and R31, who had been on suppressive ART for 25 years.
Levels of plasma HIV-1 RNA in copies/mL (orange squares) and CD4+ T cells in cells/μL (blue circles) are plotted as a function of time on suppressive ART. Plasma HIV-1 RNA values below the limit of detection are denoted by open orange squares and are plotted at the limit of detection of the assay used. The limits of detection of assays used at various times are shown by orange lines along the y axis. The ART regimens are given by the colored bars at the top of each plot. Times of sampling for reservoir assays are indicated (black arrows). Pre-ART plasma HIV-1 RNA levels for R31 were not available. The first available measurement was obtained while the participant was taking azidothymidine and lamivudine.
Figure 2
Figure 2. Reservoir measurements in PWH on long-term ART.
(A) QVOA measurements of inducible, replication-competent proviruses among resting CD4+ T cells of PWH on ART for more than 7 years (mean 20.6 years). Virus was isolated in 54 of 61 assays from 42 participants. For negative assays (open symbols), a posterior median estimate is given (88). Black line, median value; n, number of assays. (B) Violin plots of the frequencies of latently infected cells in positive QVOAs on resting CD4+ T cells from 59 PWH on short-term ART (pink) and 38 PWH on long-term ART (orange). Mean duration of suppressive ART at sampling is on the x axis. Boxes and whiskers indicate middle quartiles and maximum and minimum values, respectively. Red horizontal lines, median; black circles, geometric mean. Expected decay with t1/2 = 44.2 months over the relevant time interval is indicated (dashed line). Short-term ART data are from the 2003 study (29). Short- and long-term frequencies were not statistically different (P = 0.54) by Student’s t test on log-transformed values. (C) Violin plots of the frequencies of intact proviruses as measured in positive IPDAs on samples from 62 PWH on short-term ART (pink) and 34 PWH on long-term ART (orange). Short-term ART data are from ref. using samples obtained between 0.5 and 7 years after ART initiation. Expected decay with t1/2 = 44.2 months over the relevant time interval is indicated (dashed line). Log-transformed values were compared using Student’s t test. (D) IPDA measurements of the frequency of intact and defective proviruses (3′ deleted/hypermutated and 5′ deleted) in resting CD4+ T cells of PWH on suppressive ART for more than 7 years (mean = 22.0 years). Bars indicate median values. For negative assays (open symbols), maximum value based on the number of cells plated is shown. Significance values for multiple comparisons with the log-transformed frequencies of intact proviruses were determined using Dunnett’s test. n, number of assays.
Figure 3
Figure 3. Decay of the latent reservoir during very long-term ART.
(A) QVOA measurements of the frequencies of resting CD4+ T cells with inducible, replication-competent proviruses in 4 PWH from the original 2003 study (29) who were sampled again after a total of 15–27 years on suppressive ART. Frequencies for the first 7 years of ART from other participants in Siliciano et al. (29) are shown by red circles. For assays with no outgrowth, the median posterior estimate of infected-cell frequency based on input cell number was plotted (open symbols). Monophasic decay with t1/2 = 44 months is indicated by the dashed red line. (B) QVOA measurements for all participants in the current study. Lines connect longitudinal measurements in the same donor. A best fit model for segmented exponential decay (thick gray line) shows initial decay with t1/2 = 44 months followed by an inflection at 7 years and then a slow increase (doubling time = 23 years). See Supplemental Table 5 for details. (C) IPDA measurements of the decay of intact proviruses in PWH on very long-term ART. Frequencies for the initial years of ART (red circles) were replotted from Peluso et al. (35). Results are expressed as the DNA shearing index–corrected (DSI-corrected) geometric mean frequency of intact proviruses in resting CD4+ T cells (34). For assays in which no intact proviruses were detected, results are reported as the inverse of the number of cell equivalents analyzed (open symbols). The DSI was below 0.5 for all participants. Monophasic decay with a half-life of 44.2 months is indicated by the dashed line. A model for segmented exponential decay (thick gray line) shows initial decay with t1/2 = 46 months followed by an inflection at 7 years and slower subsequent decay (t1/2 = 9 years). See Supplemental Table 6 for details.
Figure 4
Figure 4. Inducibility of the latent reservoir in PWH on short- and long-term ART.
(A) QVOA/IPDA analysis of inducibility. Inducibility was measured as the ratio of the frequency of inducible, replication-competent proviruses per 106 resting CD4+ T cells over the frequency of intact proviruses per 106 resting CD4+ T cells in the same sample (QVOA/IPDA). Short-term ART data are from a study by Bruner et al. (34). The mean duration of treatment with suppressive ART at the time of sampling is shown for each group on the x axis. The geometric mean values (thick line) and statistical significance (Student’s t test on log-transformed values) are indicated. This analysis was performed using data from samples for which both assays were positive. (B) Data from A together with results from samples for which one of the frequencies was below the limit of detection (BLD). For these samples, frequencies were estimated as described in the legend to Figure 2.
Figure 5
Figure 5. Large expanded CD4+ T cell clones dominate the latent reservoir of PWH on very long-term ART.
Maximum-likelihood phylogenetic trees of env sequences for 6 representative participants (R01, R03, R10, R16, R18, and R21), each rooted using HXB2, are shown. Single-genome sequencing of env was performed on cDNA reverse-transcribed from viral RNA extracted from supernatants of QVOA wells scored positive for viral outgrowth (red) or on proviral DNA from resting CD4+ T cells (rCD4, gray). Near-full-length genome sequences were obtained using the same proviral DNA and are annotated as intact (yellow) or defective (blue). Genetic distance is represented by the scale in nucleotides. A measure of the clonality of QVOA isolates (see article text) is indicated as a boxed value for each participant.
Figure 6
Figure 6. Clonality of the latent reservoir of PWH on very long-term ART.
(A) Clonality of QVOA isolates. Clonality was estimated as the fraction of env sequences that exactly matched another env sequence from an independent isolate obtained in the same QVOA. Clonality of outgrowth sequences for participants with over 10 positive QVOA outgrowth wells was compared between PWH on very long-term ART (R01, R02, R03, R10, R16, R18, and R21; orange symbols) and PWH on ART for an average of 9.0 years (red symbols) from 5 previous studies (–47, 57, 75). In those 5 studies, clonality measurements included sequences obtained only from the first time point using the same QVOA methods with only 1 round of stimulation and from participants who experienced no analytical treatment interruptions and had no additional treatments besides ART. The mean values (thick line) and statistical significance (Student’s t test) are indicated. (B) Difference in clonality between QVOA isolates and proviral env sequences. Clonality of outgrowth sequences for very long-term ART participants with over 10 positive QVOA outgrowth wells (R01, R03, R10, R16, R18, and R21) was compared with the clonality of proviral sequences obtained from resting CD4+ T (rCD4) cells of the same participant. Statistical significance (Student’s paired t test) is indicated.

References

    1. Hammer SM, et al. A controlled trial of two nucleoside analogues plus indinavir in persons with human immunodeficiency virus infection and CD4 cell counts of 200 per cubic millimeter or less. AIDS Clinical Trials Group 320 Study Team. N Engl J Med. 1997;337(11):725–733. doi: 10.1056/NEJM199709113371101. - DOI - PubMed
    1. Gulick RM, et al. Treatment with indinavir, zidovudine, and lamivudine in adults with human immunodeficiency virus infection and prior antiretroviral therapy. N Engl J Med. 1997;337(11):734–739. doi: 10.1056/NEJM199709113371102. - DOI - PubMed
    1. Perelson AS, et al. Decay characteristics of HIV-1-infected compartments during combination therapy. Nature. 1997;387(6629):188–191. doi: 10.1038/387188a0. - DOI - PubMed
    1. Chun TW, et al. In vivo fate of HIV-1-infected T cells: quantitative analysis of the transition to stable latency. Nat Med. 1995;1(12):1284–1290. doi: 10.1038/nm1295-1284. - DOI - PubMed
    1. Chun TW, et al. Quantification of latent tissue reservoirs and total body viral load in HIV-1 infection. Nature. 1997;387(6629):183–188. doi: 10.1038/387183a0. - DOI - PubMed

Publication types

Substances