. 2023 Oct;32(19-20):622-637.
doi: 10.1089/scd.2022.0290. Epub 2023 Aug 14.

Extracellular Matrix Influences Gene Expression and Differentiation of Mouse Trophoblast Stem Cells

Affiliations

Extracellular Matrix Influences Gene Expression and Differentiation of Mouse Trophoblast Stem Cells

Bryony V Natale et al. Stem Cells Dev. 2023 Oct.

Abstract

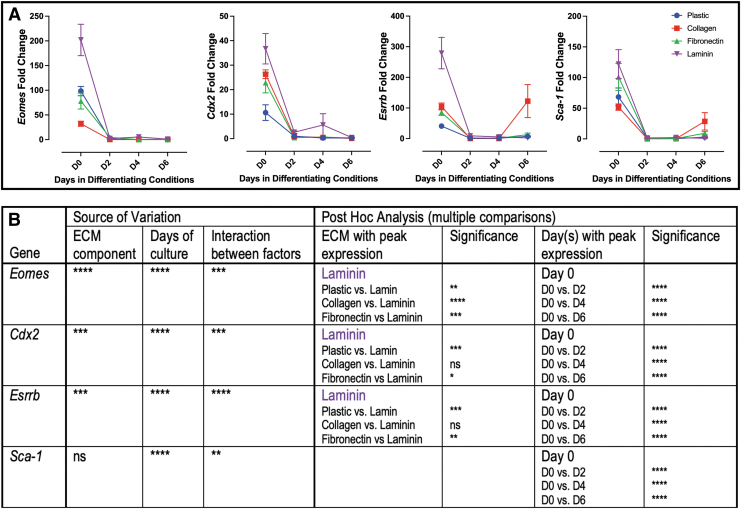
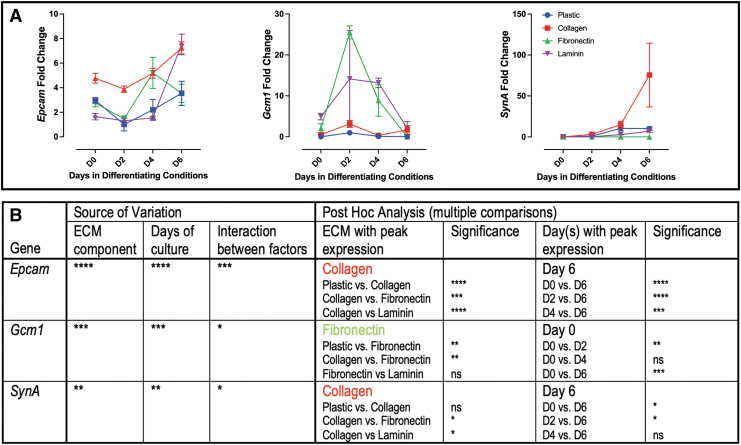
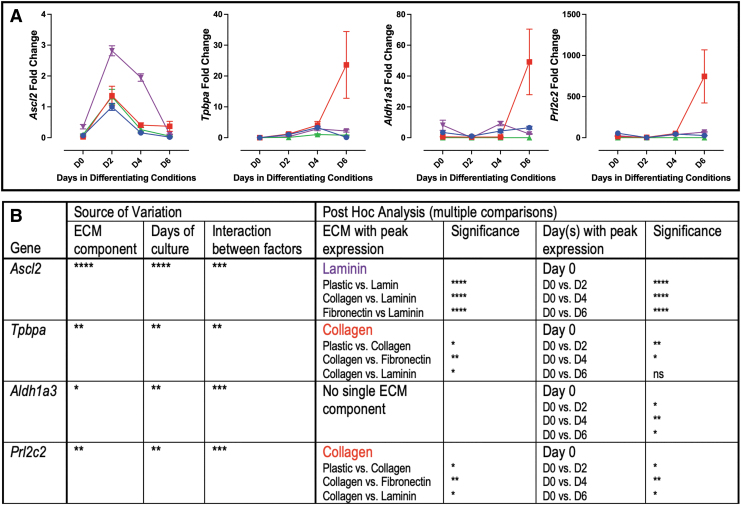
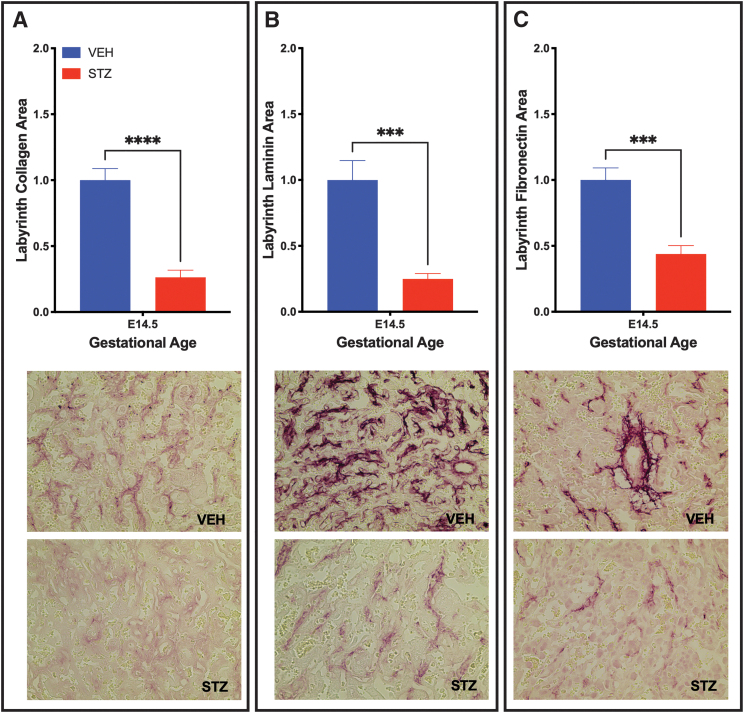
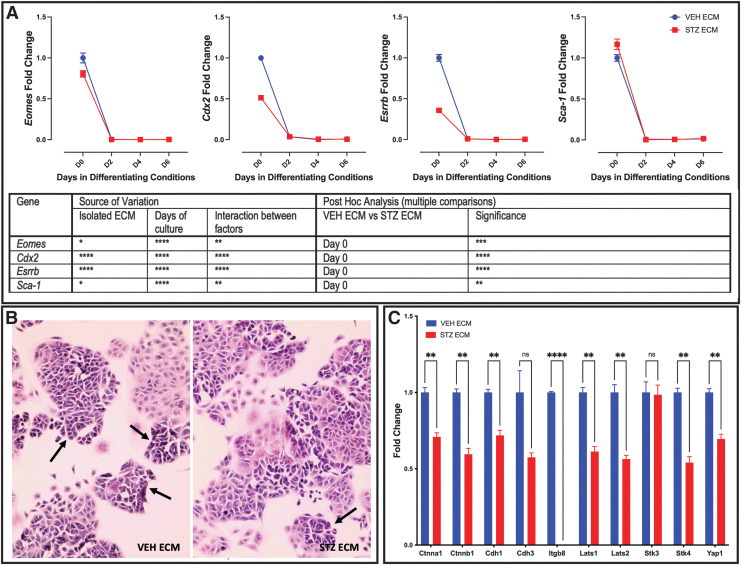
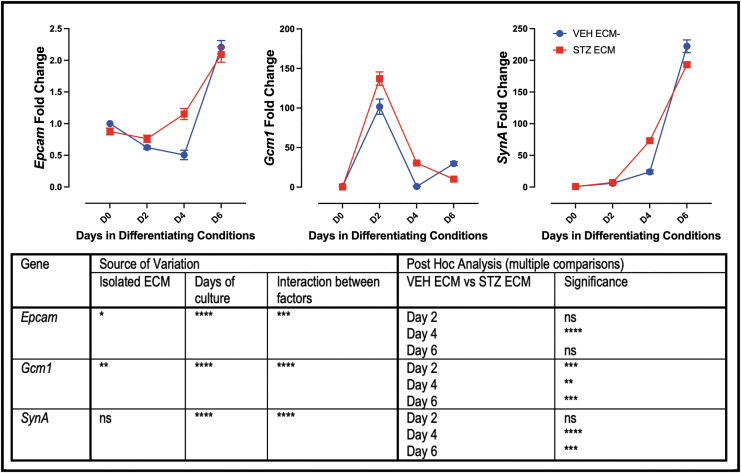
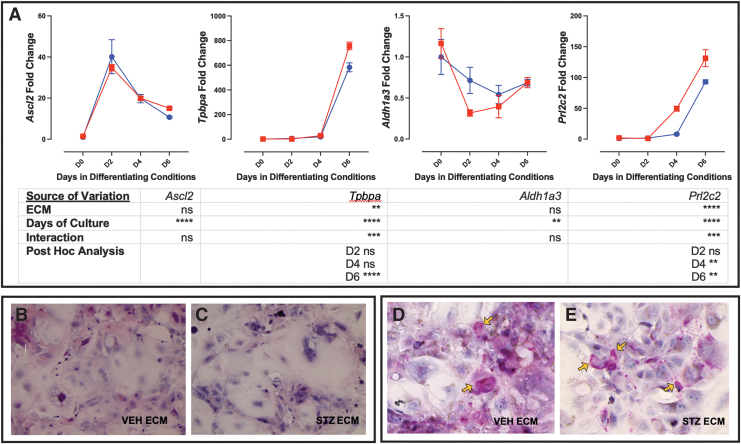
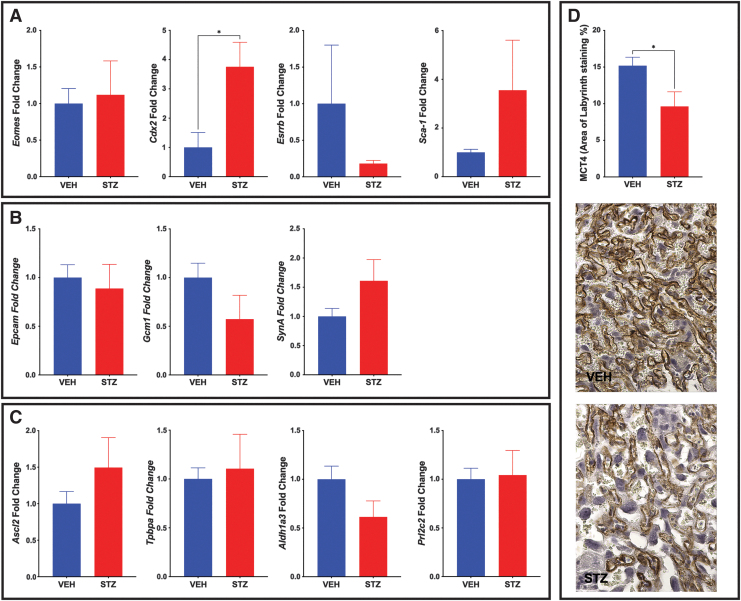
Trophoblast stem (TS) cells were first isolated from the mouse placenta; however, little is known about their maintenance and niche in vivo. TS cells, like other stem cells, have a unique microenvironment in which the extracellular matrix (ECM) is a component. Placental pathology is associated with ECM change. However, how these changes and the individual ECM components impact the maintenance or differentiation of TS cells has not been established. This study identified which ECM component(s) maintain the greatest expression of markers associated with undifferentiated mouse trophoblast stem (mTS) cells and which alter the profile of markers of differentiation based on mRNA analysis. mTS cells cultured on individual ECM components and subsequent quantitative polymerase chain reaction analysis revealed that laminin promoted the expression of markers associated with undifferentiated TS cells, fibronectin promoted gene expression associated with syncytiotrophoblast (SynT) layer II cells, and collagen IV promoted the expression of genes associated with differentiated trophoblast. To investigate whether pathological placental ECM influenced the expression of genes associated with different trophoblast subtypes, the mouse model of streptozotocin (STZ)-induced pancreatic β cell ablation and diabetes was used. Female mice administered STZ (blood glucose ≥300 mg/dL) or control (blood glucose ≤150 mg/dL) were mated. Placental pathology at embryonic day (E)14.5 was confirmed with reduced fetal blood space area, reduced expression of the pericyte marker αSMA, and decreased expression of ECM proteins. mTS cells cultured on ECM isolated from STZ placenta were associated with reduced expression of undifferentiated mTS markers and increased expression of genes associated with terminally differentiated trophoblast [Gcm-1 and SynA (SynT) and junctional zone Tpbpa and Prl2c2]. Altogether, these results support the value of using ECM isolated from the placenta as a tool for understanding trophoblast contribution to placental pathology.

Keywords: differentiation; extracellular matrix; mouse; trophoblast; trophoblast stem cell.


Conflict of interest statement

No competing financial interests exist.

Figures

FIG. 1.
FIG. 1.
Markers of undifferentiated mTS cells peak on laminin. (A) qPCR analysis of markers of undifferentiated mTS cells peak on day 0; Eomes, Cdx2, and Esrrb peak on laminin ECM. (B) Two-way ANOVA table identifying the source of variation (ECM, days in culture and interaction between factors); post hoc analysis identified specific ECM with peak expression and specific days in culture by Tukey's multiple comparisons test. Bold font ECM or days in culture identifies a parameter with post hoc significance in 3/3 comparisons; regular font identified a parameter with post hoc significance in 2/3 comparisons; no conclusion was made with significance in less than 2 comparisons. Stars indicate statistical significance, *P ≤ 0.05, **P ≤ 0.01, ***P ≤ 0.001, ****P ≤ 0.0005. Error bars are SEM. ECM, extracellular matrix; mTS, mouse trophoblast stem; n/s, no significance; qPCR, quantitative polymerase chain reaction; SEM, standard error of the mean.
FIG. 2.
FIG. 2.
Markers of labyrinth trophoblast grown on individual ECM components. (A) qPCR analysis of markers of labyrinth trophoblast. (B) Two-way ANOVA table identifying the source of variation (ECM, days in culture and interaction between factors); post hoc analysis identified specific ECM with peak expression and specific days in culture by Tukey's multiple comparisons test. Bold font ECM or days in culture identifies a parameter with post hoc significance in 3/3 comparisons; regular font identified a parameter with post hoc significance in 2/3 comparisons; no conclusion made with significance in less than 2 comparisons. Stars indicate statistical significance, *P ≤ 0.05, **P ≤ 0.01, ***P ≤ 0.001, ****P ≤ 0.0001. Error bars are SEM.
FIG. 3.
FIG. 3.
Markers of junctional zone trophoblast grown on individual ECM components. (A) qPCR analysis of markers of junctional zone trophoblast. (B) Two-way ANOVA table identifying the source of variation (ECM, days in culture, and interaction between factors); post hoc analysis identified specific ECM with peak expression and specific days in culture by Tukey's multiple comparisons test. Bold font ECM or days in culture identifies a parameter with post hoc significance in 3/3 comparisons; regular font identified a parameter with post hoc significance in 2/3 comparisons; no conclusion made with significance in less than 2 comparisons. Stars indicate statistical significance, *P ≤ 0.05, **P ≤ 0.01, ***P ≤ 0.001, ****P ≤ 0.0001. Error bars are SEM.
FIG. 4.
FIG. 4.
Identification of placental pathology in STZ-induced diabetic placentae. (A) Junctional Zone area as a percentage of total placental area is reduced in the STZ placentae; labyrinth area is not altered. (B) Total labyrinth Ki67 proliferation at E14.5 is reduced; representative histological images of placenta labyrinth. (C) Fetal and maternal blood space analysis included assessment of blood space perimeter to area ratio at E14.5. FBS perimeter to area ratio is reduced in STZ placentae. (D) Labyrinth pericyte area reduced in STZ placentae as identified by αSMA staining, analysis at E14.5; representative histological images (example of αSMA staining circled in orange with an orange arrow identifying stain, remaining orange arrows and dark brown stain identify αSMA fetal blood space-associated pericytes). t-Test analysis was performed to identify significance. Stars indicate statistical significance between the treatment groups, **P ≤ 0.01, ****P ≤ 0.0001. Error bars are SEM. Image magnification in (B, D) = 400 × (n ≥ 6 placentae per treatment). FBS, fetal bovine serum; STZ, streptozotocin.
FIG. 5.
FIG. 5.
Placentae from STZ-induced diabetic placenta have reduced ECM components. Labyrinth ECM was altered in STZ placentae as identified by Collagen (A), Laminin (B), and Fibronectin (C) at E14.5 with representative histological images. Stars indicate statistical significance between the treatment groups, ***P ≤ 0.001, ****P ≤ 0.0001. Error bars are SEM. Image magnification = 400 × (n ≥ 6 placentae per treatment).
FIG. 6.
FIG. 6.
Pathological ECM alters expression of markers of undifferentiated mTS cells. (A) qPCR analysis of markers of undifferentiated mTS cells identified peak expression of all markers on day 0; Eomes, Cdx2, and Esrrb expression was reduced on STZ ECM, while Sca-1 expression was increased on STZ ECM; two-way ANOVA table identifying the source of variation (ECM, days in culture, and interaction between factors by row); post hoc analysis using Šídák's multiple comparisons test identified which day expression was significantly altered by pathological ECM. (B) H&E stain of day 0 mTS cells cultured on placental isolated ECM; arrows identify mTS colonies with tight compact morphology; 200 × magnification (C) mTS cells grown on STZ ECM have reduced expression of markers associated with cell junction and cell/cell interaction. Multiple t-test analysis (corrected for multiple comparisons using the Holm–Šídák method) performed to identify significance with stars indicating statistical significance, *P ≤ 0.05, **P ≤ 0.01, ***P ≤ 0.001, ****P ≤ 0.0001. Error bars are SEM. H&E, Hematoxylin and Eosin.
FIG. 7.
FIG. 7.
Pathological ECM increases expression of labyrinth trophoblast markers on day 4 in culture. qPCR analysis of markers of labyrinth trophoblast; All three markers have increased expression on day 4 in mTS cells grown on ECM isolated from STZ placentae; two-way ANOVA table identifying the source of variation (ECM, days in culture, and interaction between factors by row); post hoc analysis using Šídák's multiple comparisons test identified which day expression was significantly altered by pathological ECM. Stars indicate statistical significance, *P ≤ 0.05, **P ≤ 0.01, ***P ≤ 0.001, ****P ≤ 0.0001. Error bars are SEM.
FIG. 8.
FIG. 8.
Pathological ECM increases expression of trophoblast markers Tpbpa and Prl2c2. (A) qPCR analysis of markers of junctional zone trophoblast; Tpbpa and Prl2c2 expression peaked on day 6 with increased expression in mTS cells grown on placental ECM isolated from STZ placentae (shown in red vs blue control); two-way ANOVA table identifying the source of variation (ECM, days in culture, and interaction between factors by row); post hoc analysis using Šídák's multiple comparisons test identified which day expression was significantly altered by pathological ECM. (B) H&E stain of day 6 mTS cells cultured on placental isolated ECM showing heterogeneous differentiation of the cell cultures; 200 × magnification. (C) PAS stain of day 6 mTS cells cultured on placental isolated ECM showing the glycogen accumulation (orange arrows) associated with GlyT; 200 × magnification. Stars indicate statistical significance, **P ≤ 0.01, ***P ≤ 0.001, ****P ≤ 0.0001. Error bars are SEM. GlyT, glycogen trophoblast cell; PAS, Periodic acid–Schiff.
FIG. 9.
FIG. 9.
In vivo analysis of trophoblast populations reveals a reduced SynTII population in STZ placentae. (A) qPCR analysis of markers of mTS cells; Cdx2 expression is increased in STZ placentae when compared with the VEH control. (B) qPCR analysis of markers of labyrinth trophoblast. (C) qPCR analysis of markers of junctional zone trophoblast. (D) Labyrinth SynTII were reduced in STZ placentae as identified by MCT4 staining at E14.5 with representative histological images. t-Test analysis was performed to identify significance. Stars indicate statistical significance between the treatment groups, *P ≤ 0.05. Error bars are SEM. Image magnification = 400 × (n ≥ 6 placentae per treatment). SynTII, syncytiotrophoblast II; VEH, vehicle.

Similar articles

Cited by

References

    1. Tanaka S, Kunath T, Hadjantonakis AK, Nagy A and Rossant J. (1998). Promotion of trophoblast stem cell proliferation by FGF4. Science 282:2072–2075. - PubMed
    1. Okae H, Toh H, Sato T, Hiura H, Takahashi S, Shirane K, Kabayama Y, Suyama M, Sasaki H and Arima T. (2018). Derivation of human trophoblast stem cells. Cell Stem Cell 22:50–63.e6. - PubMed
    1. Sun Y, Ding W, Wei Q, Shen Z and Wang C. (2012). Dysregulated gene expression of extracellular matrix and adhesion molecules in saphenous vein conduits of hemodialysis patients. J Thorac Cardiovasc Surg 144:684–689. - PubMed
    1. Lei T, Hohn HP, Behr R and Denker HW. (2007). Influences of extracellular matrix and of conditioned media on differentiation and invasiveness of trophoblast stem cells. Placenta 28:14–21. - PubMed
    1. Kubaczka C, Senner C, Arauzo-Bravo MJ, Sharma N, Kuckenberg P, Becker A, Zimmer A, Brustle O, Peitz M, Hemberger M and Schorle H. (2014). Derivation and maintenance of murine trophoblast stem cells under defined conditions. Stem Cell Rep 2:232–242. - PMC - PubMed

Publication types

LinkOut - more resources