. 2023 Jul 18;21(7):e3002184.
doi: 10.1371/journal.pbio.3002184. eCollection 2023 Jul.

The manifold costs of being a non-native English speaker in science

Affiliations

The manifold costs of being a non-native English speaker in science

Tatsuya Amano et al. PLoS Biol. .

Abstract

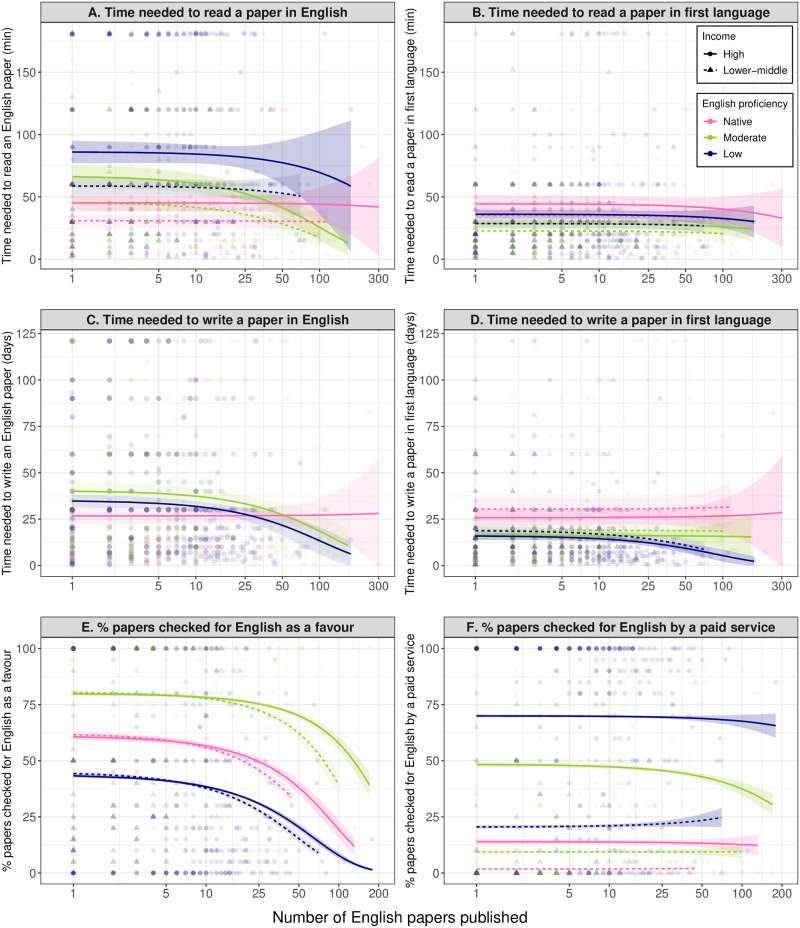
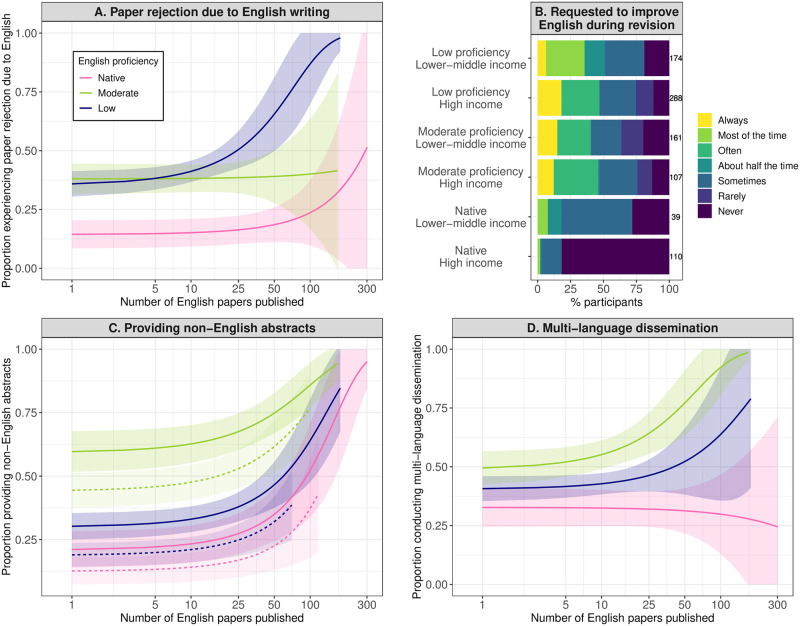
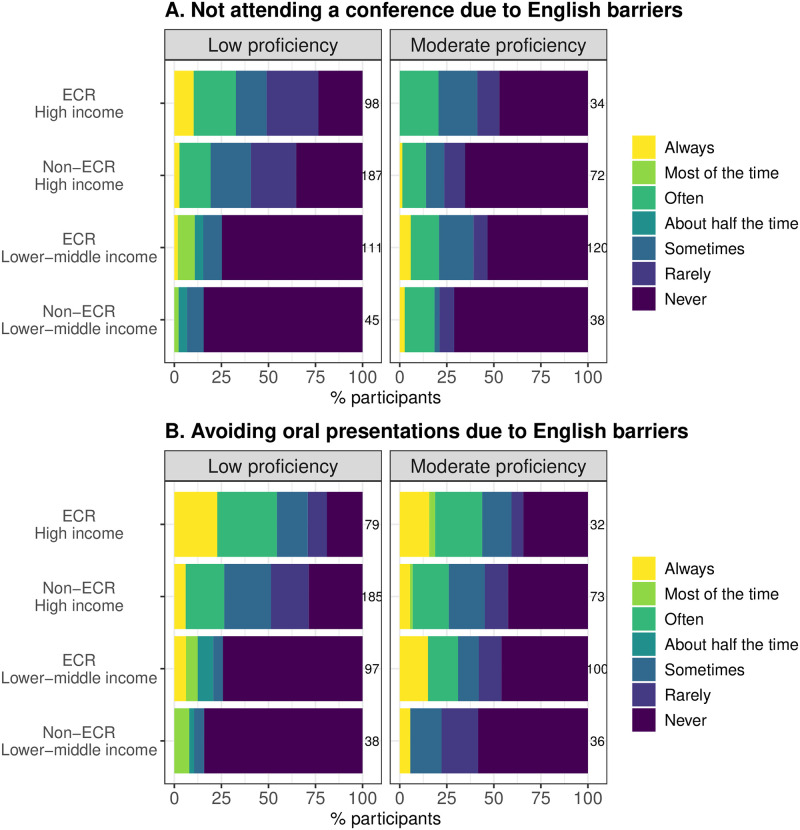
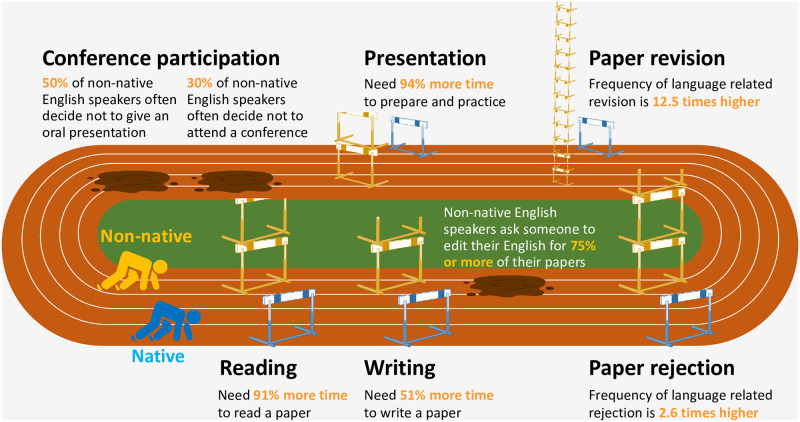
The use of English as the common language of science represents a major impediment to maximising the contribution of non-native English speakers to science. Yet few studies have quantified the consequences of language barriers on the career development of researchers who are non-native English speakers. By surveying 908 researchers in environmental sciences, this study estimates and compares the amount of effort required to conduct scientific activities in English between researchers from different countries and, thus, different linguistic and economic backgrounds. Our survey demonstrates that non-native English speakers, especially early in their careers, spend more effort than native English speakers in conducting scientific activities, from reading and writing papers and preparing presentations in English, to disseminating research in multiple languages. Language barriers can also cause them not to attend, or give oral presentations at, international conferences conducted in English. We urge scientific communities to recognise and tackle these disadvantages to release the untapped potential of non-native English speakers in science. This study also proposes potential solutions that can be implemented today by individuals, institutions, journals, funders, and conferences. Please see the Supporting information files (S2-S6 Text) for Alternative Language Abstracts and Figs 5 and 6.


Conflict of interest statement

The authors have declared that no competing interests exist.

Figures

Fig 1
Fig 1. Language barriers in paper reading and writing.
(A) Minutes taken to read and understand the content of the most recent English-language research article each participant read in their field. (B) Minutes it would take to fully read and understand the same paper in one’s first language. (C) Number of days (assuming 7 hours being spent per day) taken to write the first draft of each participant’s latest first-authored paper in English. (D) Number of days that would be taken to write the first draft of the same paper in their first language. (E) Percentage of papers where English writing was checked by someone as a favour. (F) Percentage of papers where English writing was checked by a professional service. The regression lines (with 95% confidence intervals as shaded areas) represent the estimated relationship with the number of English-language papers published (shown on the log10-transformed axis), based on the results shown in S2–S5 and S7–S8 Tables (income level was not significant in (C)). The data underlying this figure are raw data directly from the survey questions, which our ethics approval prevents us from sharing to secure confidentiality of the respondents.
Fig 2
Fig 2. Language barriers to paper publication and dissemination.
(A) Proportion of researchers who have experienced rejection of a first-authored English-language paper due to English writing. (B) Frequency of being requested to improve English writing during the revision of first-authored English-language papers. (C) Proportion of researchers who have provided non-English-language abstracts of English-language papers. (D) Proportion of researchers who have disseminated English-language papers in other languages as well as English. The regression lines (with 95% confidence intervals as shaded areas) in (A), (C), and (D) represent the estimated relationship with the number of English-language papers published (shown on the log10-transformed axis), based on the results shown in S9, S11 and S12 Tables. Income level (solid line: high; dotted line: lower-middle) was only significant and thus shown in (C). The data underlying (A), (C), and (D) are raw data directly from the survey questions, which our ethics approval prevents us from sharing to secure confidentiality of the respondents. The data underlying (B) can be found in S1 Data.
Fig 3
Fig 3. Language barriers to participation in conferences.
The frequency of (A) not attending an English-language conference and (B) avoiding oral presentations at an English-language conference due to the lack of confidence in English-language communication. An ECR (early-career researcher) was defined as someone with 5 or fewer English-language papers. The numbers on the right of each bar represent the sample size. The data underlying this figure can be found in S1 Data.
Fig 4
Fig 4. Language barriers to preparing and conducting presentations in English.
(A) Number of hours needed to prepare and practice an oral presentation in English. (B) Number of hours that would be needed to prepare and practice the same oral presentation in one’s first language. (C) Frequency of not being able to explain research confidently during a presentation due to English-language barriers. The regression lines (with 95% confidence intervals as shaded areas) in (A) and (B) represent the estimated relationship with the number of English-language papers published (shown on the log10-transformed axis), based on the results shown in S15 and S16 Tables. In (C), an ECR (early-career researcher) was defined as someone with 5 or fewer English-language papers published so far. The numbers on the right of each bar represent the sample size. The data underlying (A) and (B) are raw data directly from the survey questions, which our ethics approval prevents us from sharing to secure confidentiality of the respondents. The data underlying (C) can be found in S1 Data.
Fig 5
Fig 5. Estimated disadvantages for non-native English speakers when conducting different scientific activities.
The height of hurdles indicates the relative length of time taken to read an English-language paper (Reading), to write a paper in English (Writing), and to prepare an oral presentation in English (Presentation), and the relative frequency of an English-language paper being rejected (Paper rejection) or requested to revise (Paper revision) due to English writing, for non-native English speakers (Non-native), compared to native English speakers (Native). The values are for non-native English speakers who have published only one English-language paper (higher value from moderate and low English proficiency nationalities), compared to the values for native English speakers. This figure is not intended to suggest that science is a race.
Fig 6
Fig 6. Examples of potential solutions to reducing disadvantages for non-native English speakers in each type of scientific activities.
AI, artificial intelligence. Also see [35,38,39] for other potential solutions.

References

    1. Hong L, Page SE. Groups of diverse problem solvers can outperform groups of high-ability problem solvers. Proc Natl Acad Sci U S A. 2004;101(46):16385–16389. doi: 10.1073/pnas.0403723101 - DOI - PMC - PubMed
    1. Hofstra B, Kulkarni VV, Galvez SM-N, He B, Jurafsky D, McFarland DA. The diversity-innovation paradox in science. Proc Natl Acad Sci U S A. 2020;117(17):9284–9291. doi: 10.1073/pnas.1915378117 - DOI - PMC - PubMed
    1. Alshebli BK, Rahwan T, Woon WL. The preeminence of ethnic diversity in scientific collaboration. Nat Commun. 2018;9(1):5163. doi: 10.1038/s41467-018-07634-8 - DOI - PMC - PubMed
    1. Amano T, Berdejo-Espinola V, Christie AP, Willott K, Akasaka M, Báldi A, et al. Tapping into non-English-language science for the conservation of global biodiversity. PLoS Biol. 2021;19(10):e3001296. doi: 10.1371/journal.pbio.3001296 - DOI - PMC - PubMed
    1. Tengö M, Hill R, Malmer P, Raymond CM, Spierenburg M, Danielsen F, et al. Weaving knowledge systems in IPBES, CBD and beyond—lessons learned for sustainability. Curr Opin Environ Sustain. 2017;26–27:17–25. doi: 10.1016/j.cosust.2016.12.005 - DOI

Publication types

LinkOut - more resources