. 2023 Jul 18;21(7):e3002191.
doi: 10.1371/journal.pbio.3002191. eCollection 2023 Jul.

Pan-European study of genotypes and phenotypes in the Arabidopsis relative Cardamine hirsuta reveals how adaptation, demography, and development shape diversity patterns

Affiliations

Pan-European study of genotypes and phenotypes in the Arabidopsis relative Cardamine hirsuta reveals how adaptation, demography, and development shape diversity patterns

Lukas Baumgarten et al. PLoS Biol. .

Abstract

We study natural DNA polymorphisms and associated phenotypes in the Arabidopsis relative Cardamine hirsuta. We observed strong genetic differentiation among several ancestry groups and broader distribution of Iberian relict strains in European C. hirsuta compared to Arabidopsis. We found synchronization between vegetative and reproductive development and a pervasive role for heterochronic pathways in shaping C. hirsuta natural variation. A single, fast-cycling ChFRIGIDA allele evolved adaptively allowing range expansion from glacial refugia, unlike Arabidopsis where multiple FRIGIDA haplotypes were involved. The Azores islands, where Arabidopsis is scarce, are a hotspot for C. hirsuta diversity. We identified a quantitative trait locus (QTL) in the heterochronic SPL9 transcription factor as a determinant of an Azorean morphotype. This QTL shows evidence for positive selection, and its distribution mirrors a climate gradient that broadly shaped the Azorean flora. Overall, we establish a framework to explore how the interplay of adaptation, demography, and development shaped diversity patterns of 2 related plant species.


Conflict of interest statement

The authors have declared that no competing interests exist.

Figures

Fig 1
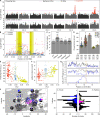
Fig 1. Population structure and demography of Cardamine hirsuta.
(A) ADMIXTURE analysis of C. hirsuta strains after filtering for close relatedness (n = 358) reveals 3 major ancestry groups. The number of clusters that best fitted the data was found to be 3 (see also in S1A Fig). Each vertical bar represents a strain, where the colors indicate admixture proportions for the 3 ancestry groups. Strains were assigned to the ancestry group for which the proportion of ancestry was at least 0.5. The ancestry groups were named according to the main sampling location of their respective strains: BAL–Balkan; IBE–Iberia; NCE–Northern Central Europe. Strains with proportions less than 0.5 for all ancestry groups were categorized as ungrouped (top right). (B) The geographical distribution of the C. hirsuta ancestry groups in Western Europe. Each point represents the collection site of a strain and is colored according to the ancestry group it belonged to, with ungrouped strains shown in gray. The Macaronesian islands of the Azores and Madeira are shown at a smaller scale below the map. Map layers were made with Natural Earth and [142]. (C) The distribution of pairwise genetic distances (PGDs) indicates a deep split between groups of C. hirsuta strains. A histogram is shown of PGD between all possible pairs of strains in which the numbers of pairs in each bin are plotted against the PGD. The black outline shows the PGD of all strains in our sample. The presence of 2 major modes in the distribution, of which one at high genetic distance, indicated a group of strains in our sample that is highly differentiated from the others. Hierarchical clustering revealed a group of relict-like strains that was responsible for the second major mode in the distribution. PGDs including 1 or 2 relict-like strains are shown in blue, and PGDs not including those are shown in gray. (D) Identification of groups of C. hirsuta strains that are highly differentiated from each other based on multidimensional scaling and hierarchical clustering of the PGD. The first 2 PCs are plotted against each other where each point is a strain, colored according to the ADMIXTURE ancestry group it belonged to, with ungrouped strains shown in dark gray. Strains with ancestry in only a single ancestry group in the ADMIXTURE analysis are shown by darker shades versus lighter shades for admixed strains. Hierarchical clustering of the PGD matrix revealed that the separation of the strains along PC1 represented the 3 distinct groups of strains shown enclosed by dashed lines. The groups on the left and in the middle were responsible for the second major mode in the distribution of PGD (Figs 1C, S1B and S1C). Those 2 groups are shown here in blue and gray. (E, F) Piecewise constant effective population sizes (Ne) as a function of time for the 3 ancestry groups using MSMC2 (E) and relate (F), and estimates of split times between them considering a mutation rate of 4 × 10⁻⁹ mutations per base, per generation. The split times for BAL-NCE and BAL-IBE estimated with fastsimcoal2 (S1I Fig) are indicated by red and blue triangles on the x-axes, respectively. The top panel shows ancestral changes in Ne within the groups plotted against time in years, when considering 1 generation per year. With MSMC2 (E), 20 random sets of 4 strains were analyzed, which are all plotted, while with relate (F), all strains were analyzed jointly, hence a single line. The bottom panels show the RCCRs in BAL vs. NCE (solid lines) and IBE vs. BAL (dashed lines). Light blue shaded areas in the plots show ancient periods of glaciation according to MISs 2–4, 6, 8, 10, 12, 14, 16, and 18 [45], respectively, from left to right. The period of the LGM [46] is likewise indicated by the darker blue shade embedded in MIS2–4. The data underlying the graphs shown in this figure can be found at https://doi.org/10.5281/zenodo.7907435. BAL, Balkan; IBE, Iberian; LGM, last glacial maximum; MIS, marine isotope stage; NCE, Northern Central European; PC, principal coordinate; PGD, pairwise genetic distance; RCCR, relative cross coalescence rate.
Fig 2
Fig 2. Selection for accelerated developmental progression in Northern and Central Europe.
(A) GWAs for flowering time and leaflet number on leaf 7 using 352 C. hirsuta strains. The negative log base 10 transformed P values for association tests of individual SNPs are plotted against physical position on the 8 chromosomes. Horizontal dashed lines show thresholds of significance with correction for multiple testing according to Bonferroni (magenta) and fdr (cyan; for both α = 0.05). SNPs with transformed P values above the fdr threshold are shown in red, and others in gray. Two regions with strongly associated SNPs were detected on chromosomes 6 and 8 that contained the candidate genes FLC/TPPI and FRI. (B) Close-up view of the locus with the strongest associations showing GWAS for flowering time with the most significant SNP in TPPI used as covariate. Forward regression using a multilocus mixed model GWAS indicated that the highly significant association on chromosome 6 consisted of 2 independent associations. Yellow areas indicate the 2 candidate genes FLC (left) and TPPI (right) where the lighter shades indicate the promoter region (−3,000 bp) and the darker shades indicate the ORF. GWAS without covariates is shown in red, and with the SNP indicated by the blue encircled red point in TPPI as a covariate in blue. This result revealed significant associations for SNPs in the first intron of FLC that were independent of the associations for SNPs linked to TPPI. The associated SNPs in FLC shown in blue were the most significant genome-wide in this analysis. (C) Functional validation of 3 distinct truncated FRI alleles that exist within predominantly European samples of C. hirsuta. In contrast to a significant increase in rosette leaf number in plants transformed with a full-length FRI allele, the truncated FRI alleles showed no effect (Dunn test with Bonferroni adjusted P value, ***: P value < 0.001). One of the 3 alleles was found at high frequency (FRIstop) and exclusively in NCE strains (see also S2B Fig). (D) Flowering time in DAG until anthesis for all genotype combinations at the 3 candidate genes identified by GWA. The genotypes at the representative SNPs for each gene are shown as either anc or der. The bars indicate the mean flowering time, and the points show the individual observations for each strain. Points are colored according to the ancestry group of strains (Fig 1A). (E, F) Correlation between North–South genetic differentiation (PC2 in S1B Fig) and flowering time (E) as well as leaflet number on leaf 8 (F). The points are observations for individual strains colored according to their ancestry group (Fig 1A) such that strains with ancestry in only 1 group are shown in darker shades vs. lighter shades for admixed. The lines show linear models fitted to the data from the BAL and NCE populations (P<0.001, R2 = 0.54, r = -0.73, Fig 2E; P<0.001 R2 = 0.38, r = 0.62, Fig 2F). Large dots show non admixed samples in those two populations. (G) Evidence for a selective sweep at the FRI locus (see also S2 Fig). A sliding window analysis of nucleotide diversity (π, top), Tajima’s D (middle), and CLR calculated by SweepFinder2 [59] (bottom) is shown for chromosome 8. The analyses were performed separately in strains with the FRIstop (blue) and the FRIfunc (black) alleles from the NCE group (Fig 1A). Note how the region, which includes the FRI locus (orange dashed line) displays reduced π, reduced Tajima’s D, and high CLR, consistent with a selective sweep, exclusively in strains with FRIstop. The horizontal dashed lines in the top and middle panels indicate the genome-wide averages for the respective groups in blue or gray, and in the lower panel the horizontal dashed line indicates the threshold (α = 0.05) derived from neutral simulations using our best demographic model. (H) The geographic distribution of full-length and truncated FRI alleles on the map and their projection on latitude in A. thaliana (*) and C. hirsuta (triangle) exhibited high similarity. The colors represent distinct truncated FRI alleles. The rectangles represent areas of high sampling density for both species. The pie charts show the proportion of functional and nonfunctional alleles in C. hirsuta (left) and full-length and truncated alleles in A. thaliana (right). The total number of strains inside the respective rectangles is shown inside the pie chart. The histograms on the right side show functional/full-length (black) and nonfunctional/truncated FRI alleles (different colors represent different truncated alleles) along the latitude. FRIstop is the major truncated FRI allele. Note that only one of all mainland European C. hirsuta strains harbors FRIstop2 and none FRIstop3. Map layers were made with Natural Earth and [142]. The data underlying the graphs shown in the figure can be found at https://doi.org/10.5281/zenodo.7907435. anc, ancestral; BAL, Balkan; CLR, composite likelihood ratio; DAG, days after germination; der, derived; fdr, false discovery rate; FLC, FLOWERING LOCUS C; FRI, FRIGIDA; GWA, genome-wide association; IBE, Iberian; NCE, Northern Central European; ORF, open reading frame; SNP, single nucleotide polymorphism; TPPI, TREHALOSE-6-PHOSPHATE-PHOSPHATASE I.
Fig 3
Fig 3. A QTL cluster on chromosome 4 contributes to low leaflet number in the Azorean C. hirsuta strain.
(A) Leaflet number progression from the first to the eighth leaf indicates a strong deviation of the Az1 strain from other strains of the IBE group (see also S3A Fig). The leaflet number per leaf node of IBE strains is shown by blue points with that of Az1 shown by blue asterisks. The shaded area highlights the difference of Az1 compared to other IBE strains. (B) Representative silhouettes of the first 8 rosette leaves of 4 week-old C. hirsuta Ox and Az1 strains grown in long days, showing the lower leaflet number of the latter. (C) ADMIXTURE analysis with 421 C. hirsuta strains remaining out of 753 after filtering for close relatedness. The number of ancestry groups that best fit the data was found to be 4. Each vertical bar represents a strain where the colors indicate admixture proportions for the 4 ancestry groups. Strains were assigned to the ancestry group for which the proportion of ancestry was at least 0.5. The 3 clusters from Fig 1A were found again, and strains with maximum ancestry in the additional cluster were exclusively from the AZ. Strains with ancestry lower than 0.5 in all clusters are indicated as “ungrouped” on the right side of the figure. (D) Piecewise constant effective population sizes (Ne) of the 4 ancestry groups from Fig 3C using MSMC2, and estimates of split times between them considering a mutation rate of 4 × 10⁻⁹ mutations per base, per generation. The top panel shows ancestral changes in Ne considering 1 generation per year. Colors indicate ancestry groups according to Fig 3C. Twenty random sets of 4 strains were analyzed, which are all plotted individually. The bottom panel shows the RCCRs in AZ vs. IBE (solid line), IBE vs. BAL (long dash line), and NCE vs. BAL (short dash line). Light blue shaded areas in the plots show ancient periods of glaciation according to MIS 2-4, 6, 8, 10, 12, 14, 16, and 18 [45], respectively, from left to right. The period of the LGM [46] is likewise indicated by the darker blue shade embedded in MIS 2–4. (E) Multiple trait QTL mapping of leaflet number from the first to the 10th rosette leaf and total RLN (a proxy for flowering time) in the Ox x Az1 RIL population. The negative log base 10 transformed P values of a composite interval mapping scan are plotted against position on the linkage groups of the chromosomes indicated in the top left corners of the upper panel. The horizontal dashed red line indicates the threshold of significance (α = 0.05). Significant allelic effects for each QTL on each trait are shown in the lower panel where red and blue colors indicate the direction, and the shade the magnitude of the effect according to the legend in the top left. (F) Multiple QTL models for leaflet number on different leaf nodes on chromosome 4. QTL detected using MQM mapping for the traits indicated on the y-axis are shown by black dots, and the 1.5 LOD intervals are indicated by shaded regions. The color of the 1.5 LOD intervals indicates the variance explained by the QTL according to the legend above the figure. Note that the direction of effect of both QTL agree with the parental differences in leaflet number (i.e., Az1 had lower leaflet number than Ox). (G) Leaflet number of HIFs segregating for different genomic regions of chromosome 4. Leaflet numbers of lines homozygous for Ox or Az1 alleles are shown in yellow and blue, respectively. Vertical bars indicate the standard errors of the means, and the points show the leaflet numbers of individual replicates. Significant differences in leaflet number for specific leaf nodes are shown as: *, P ≤ 0.05; **, P ≤ 0.01; ***, P < 0.001. Note that plants with Az1 alleles of HIFs LLN4_1A and LLN4_1B both show reduced leaflet number, but on earlier or later leaf nodes, respectively. By contrast, plants with Az1 alleles in HIF LLN4_1, which carries a larger introgression including LLN4_1A and LLN4_1B, show reduced leaflet number on earlier and later leaf nodes. (H) Graphical representation of the genotype of chromosome 4 in HIFs. Yellow and blue colors indicate homozygous Ox and Az1 alleles, respectively, while segregating regions are colored in red. Map positions of the 3 distinct QTL found in this region are depicted as black boxes. The data underlying the graphs shown in the figure can be found at https://doi.org/10.5281/zenodo.7907435. AZ, Azores; Az1, Azores1; BAL, Balkan; HIF, heterogeneous inbred family; IBE, Iberia; LGM, last glacial maximum; MIS, marine isotope stage; NCE, Northern Central Europe; Ox, Oxford; QTL, quantitative trait locus; RCCR, relative cross coalescence rate; RIL, recombinant inbreeding line; RLN, rosette leaf number.
Fig 4
Fig 4. A missense polymorphism in SPL9 underlies leaflet number QTL LLN4_2.
(A) Photoperiod shift experiment showing that the Az1 alleles at the QTL LLN4_2 delay the juvenile-to-adult phase transition. Plants of a HIF homozygous for Ox (yellow) or Az1 (blue) alleles at the SPL9 locus were shifted from flowering inducing long photoperiod to a noninductive short photoperiod. The RLN of the plants is plotted against the time spent in long photoperiod. Points show the RLN of individual plants, while the lines show a logistic model fitted to the data. The inflection point of the model is indicated by vertical arrows on the x-axis. (B) Fine-mapping of the leaflet number QTL LLN4_2. The genotype information of the HIF LLN4_2 is shown in the top panel. The graphical genotypes of the homozygous progeny of 4 different recombinant lines segregating in the LLN4_2 genomic region are shown below including the positions (Mb) of the genetic markers in the top axis. The bar chart on the right shows the number of leaflets produced on leaves 1 through 8 for the respective genotypes on the left. The bars show the mean leaflet numbers, and the points the leaflet numbers of the individual replicates. Kruskal–Wallis tests were performed to test for leaflet number differences between the 2 homozygous progenies of the same heterozygous recombinant: *** P < 0.001, n.s. nonsignificant. On the right side, the genotype at the LLN4_2 locus (Ox or Az1) inferred from the phenotype of each line is depicted. The LLN4_2 fine-mapped region of 49 kb contains 14 genes shown in the lower part of the panel with wider rectangles indicating exons and narrow rectangles introns and UTRs. The region containing SPL9 is expanded at the bottom with the 2 missense SNPs differing between Ox and Az1 colored in red and other SNPs in blue (see also S4A Fig). (C) Transgenic complementation of the Chspl9 mutant with the genomic constructs of SPL9Ox (gSPL9Ox) and SPL9Az1 (gSPL9Az1). The estimated copy number of the transgene is indicated in parentheses. As a control, the Chspl9 mutant was transformed with an empty vector. Two copies of gSPL9Ox and gSPL9Az1 could complement the phenotype to the level of Ox wt and IL LLN4_2Az1, respectively. Dots correspond to individual T2 transgenic plants derived from 27 independent T1 plants, and their mean and standard error for cumulative leaflet number on the first 8 leaves is shown by the bars. The compact letter display shows significant differences between genotypes according to a Dunn test with a Benjamin–Holm post hoc correction of the P values for multiple pairwise comparisons. (D) Allele swaps for the 2 SPL9 missense SNPs differing between Ox and Az1. The line HIF_LLN4_2 homozygous for the Az1 allele at the SPL9 locus (Fig 4A and 4B) was transformed with the genomic constructs shown in Fig 4C, and with 2 additional chimeric genomic constructs carrying the Ox and Az1 alleles, or the Az1 and Ox alleles for the SNPs (SPL9mixAz1_Ox and SPL9mixOx_Az1). The HIF was transformed with an empty vector as a control. Dots correspond to individual independent T1 transgenic plants, and their mean cumulative leaflet number on the first 8 leaves is shown by the bars. The compact letter display shows significant differences between genotypes according to a Dunn test with a Benjamin–Holm post hoc correction of the P values for multiple pairwise comparisons. The data underlying the graphs shown in the figure can be found at https://doi.org/10.5281/zenodo.7907435. Az1, Azores1; HIF, heterogeneous inbred family; Ox, Oxford; RLN, rosette leaf number; wt, wild type.
Fig 5
Fig 5. The SPL9 QTL cluster as a driver of local adaptation in the Azores.
(A) Signatures of selection at the SPL9 QTL cluster. The upper panel shows a Manhattan plot with the pcadapt results for 753 C. hirsuta strains (see also S5B Fig). The negative log base 10 transformed P values for SNPs on chromosome 4 are plotted against their physical positions. The dashed horizontal line indicates the P value separating the 1,000 genome-wide most significant SNPs, among which 83.8% are located in the vicinity of the SPL9 QTL cluster. The SPL9 missense SNP E242Q that was found to be responsible for QTL LLN4_2 is highlighted by a red circle. Yellow boxes in the lower part of the panel depict the location of QTL LLN4_1A, LLN4_1B and LLLN4_2 (SPL9). The bottom panel shows a sliding window analysis along chromosome 4 of weighted FST between the 2 groups of strains from the Azores, grp1 and grp2, which were found as highly differentiated in the SPL9 QTL cluster region (see also Fig 5B). The horizontal dashed line shows the genome-wide 95th percentile of weighted FST. (B) PCA of the 838 outlier SNPs detected by pcadapt analysis that were located within the SPL9 QTL cluster region, in 753 worldwide strains. Two groups of strains were highly differentiated from each other (grp1 –blue, grp2 –red) and from the other strains (gray and black). Strains with recombinations in the SPL9 QTL cluster are shown in black. (C) Nucleotide diversity (π) and Tajima’s D in the region of the pcadapt peak surrounding the SPL9 QTL cluster and the GBG outside of the peak for grp1 (blue) and grp 2 (red) strains from the Azores. (D) Geographic distribution of C. hirsuta strains within the Azores archipelago. The pie charts show the proportions of strains from the different groups in our sample colored according to Fig 5B (blue—grp1; red—grp2; black—recombinant in the SPL9 QTL cluster; gray—others). Strains from grp1 and grp2 were exclusively sampled on the Azores and show a nonuniform distribution with highest frequencies in the east and the west, respectively. Map layers were made with Natural Earth and [142]. (E) Phenological field data of C. hirsuta plants from 4 islands along the west–east transect colored according to alleles for the functional missense SNP E242Q of SPL9 (blue—Az1; red—not Az1; yellow—heterozygous;). Plants were classified for developmental stage from 1 (very young seedling) to 6 (advanced seed shedding). On Flores, Faial, and Pico, SPL9Az1-harboring strains were found in more advanced stages of development than strains carrying an alternative allele (*** P < 0.001, Kruskal–Wallis). (F) Weather station data from the Azores indicates reduced precipitation in the east when compared to the west. Data from 1970–2020 were analyzed in sliding windows of 11 days with 5-day stride and in each window the fraction of days with rain (> 0 mm) out of the total number of observed days was calculated. The fraction of days with rain in each window is shown by the points, and the lines show smoothing splines fitted to the data to reveal the trends. Note how on Santa Maria, in the east, from April until October, the fraction of days with rain is as low or lower than the lowest annual value for Flores and Faial in the west. The data underlying the graphs shown in the figure can be found at https://doi.org/10.5281/zenodo.7907435. GBG, genomic background; PCA, principal component analysis; QTL, quantitative trait locus; SPL9, SQUAMOSA PROMOTER BINDING PROTEN-LIKE 9.

References

    1. Blount ZD, Lenski RE, Losos JB. Contingency and determinism in evolution: Replaying life’s tape. Science. 2018;362(6415):eaam5979. doi: 10.1126/science.aam5979 - DOI - PubMed
    1. Erwin DH. Evolutionary contingency. Curr Biol. 2006;16(19):R825–R826. doi: 10.1016/j.cub.2006.08.076 - DOI - PubMed
    1. Gould SJ, Lewontin RC. Spandrels of San-Marco and the Panglossian Paradigm—a Critique of the Adaptationist Program. Proc R Soc Ser B-Bio. 1979;205(1161):581–598. doi: 10.1098/rspb.1979.0086 WOS:A1979HN99900010. - DOI - PubMed
    1. Blount ZD, Borland CZ, Lenski RE. Historical contingency and the evolution of a key innovation in an experimental population of Escherichia coli. Proc Natl Acad Sci U S A. 2008;105(23):7899–7906. doi: 10.1073/pnas.0803151105 - DOI - PMC - PubMed
    1. Stern DL, Orgogozo V. Is Genetic Evolution Predictable? Science. 2009;323(5915):746–751. doi: 10.1126/science.1158997 - DOI - PMC - PubMed

Publication types