. 2023 Jul 25;120(30):e2306420120.
doi: 10.1073/pnas.2306420120. Epub 2023 Jul 18.

The role of Plasmodium V-ATPase in vacuolar physiology and antimalarial drug uptake

Affiliations

The role of Plasmodium V-ATPase in vacuolar physiology and antimalarial drug uptake

Arne Alder et al. Proc Natl Acad Sci U S A. .

Abstract

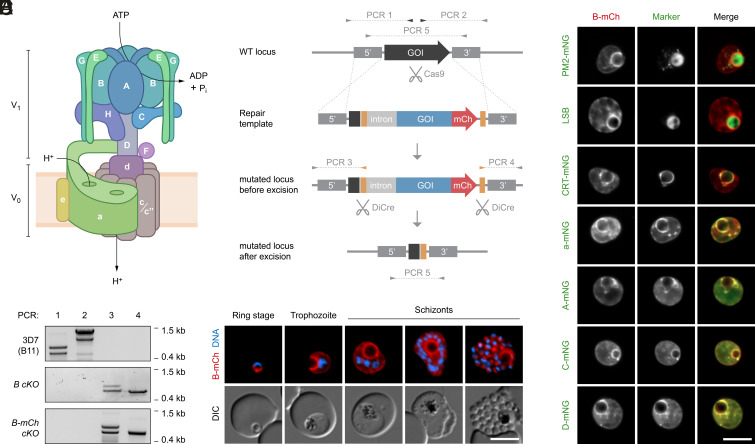
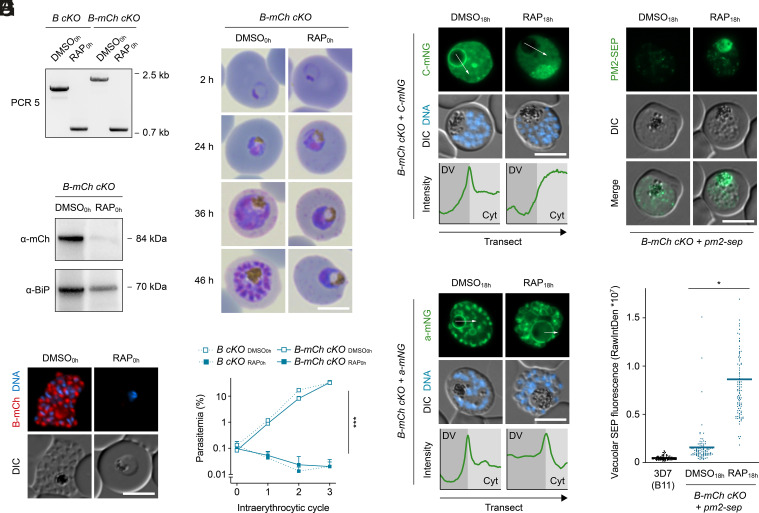
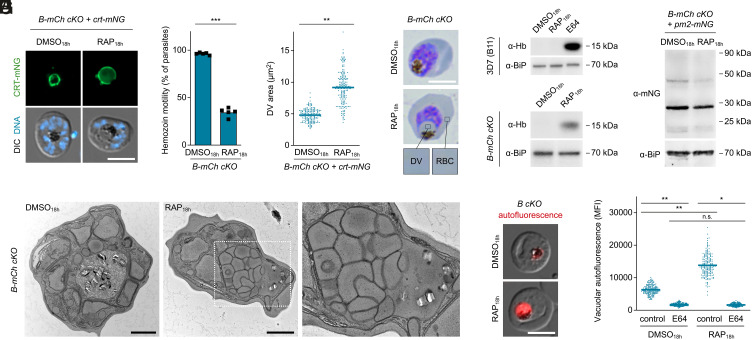
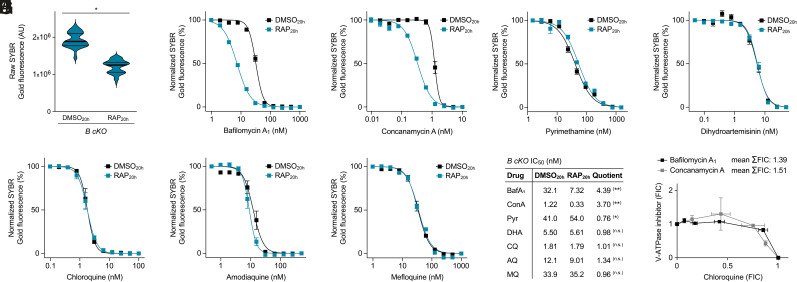
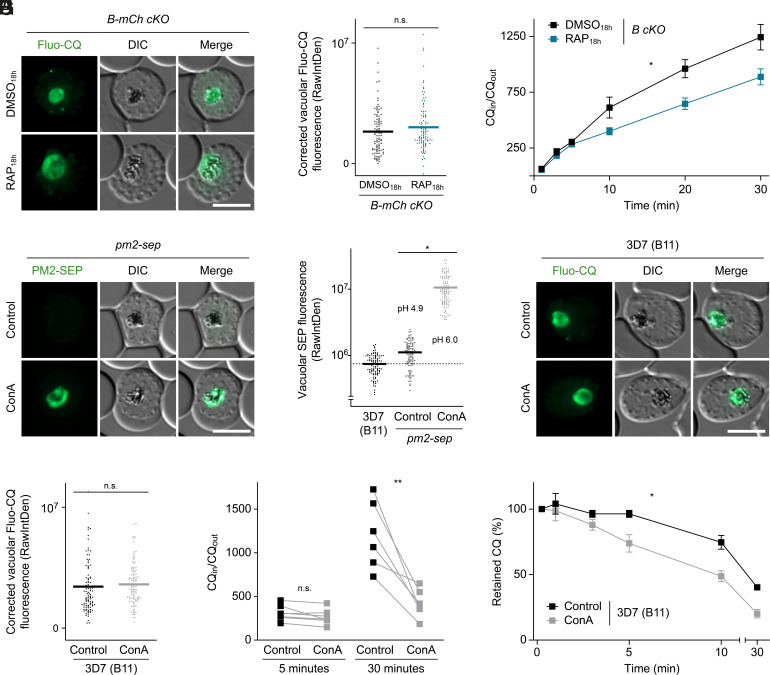
To ensure their survival in the human bloodstream, malaria parasites degrade up to 80% of the host erythrocyte hemoglobin in an acidified digestive vacuole. Here, we combine conditional reverse genetics and quantitative imaging approaches to demonstrate that the human malaria pathogen Plasmodium falciparum employs a heteromultimeric V-ATPase complex to acidify the digestive vacuole matrix, which is essential for intravacuolar hemoglobin release, heme detoxification, and parasite survival. We reveal an additional function of the membrane-embedded V-ATPase subunits in regulating morphogenesis of the digestive vacuole independent of proton translocation. We further show that intravacuolar accumulation of antimalarial chemotherapeutics is surprisingly resilient to severe deacidification of the vacuole and that modulation of V-ATPase activity does not affect parasite sensitivity toward these drugs.

Keywords: Plasmodium falciparum; V-ATPase; chloroquine; malaria; vacuole.


Conflict of interest statement

The authors declare no competing interest.

Figures

Fig. 1.
Fig. 1.
Expression and subcellular localization of P. falciparum V-ATPase. (A) Schematic representation of the eukaryotic V-ATPase. Subunits of the V1 and the V0 sector are denoted with uppercase and lowercase letters, respectively. ATP hydrolysis at the V1 sector energizes transmembrane proton transport at the V0 sector. (B) Genetic strategy for tagging and conditional deletion of V-ATPase subunits. Cas9-mediated double-strand cleavage of the gene of interest (GOI) and double homologous integration of a synthetic repair template yield transgenic parasites expressing the GOI in-frame with mCh. In some templates, mCh was omitted. loxP sites (yellow) are situated in an artificial intron and downstream of the coding sequence. RAP-induced dimerization of DiCre recombinase results in genomic excision of the loxP-flanked sequence. Primers used in diagnostic PCRs and expected amplicons are denoted with arrows and dotted lines. (C) Validation of conditional subunit B knockout parasites. Primers indicated in (B) were used in diagnostic PCRs to analyze genomic DNA from the parental B11 strain and from nontagged and mCh-tagged conditional knockout mutants. Note that the occurrence of secondary bands was independent of different primer combinations, PCR protocols, and DNA preparations, perhaps indicating occasional polymerase slippage at repetitive sequence stretches. (D) Expression and localization of subunit B throughout intraerythrocytic development, as observed by live fluorescence microscopy of B-mCh cKO parasites. DNA, Hoechst 33342. (E) Subunit B accumulates at the DVM and colocalizes with other V-ATPase subunits. B-mCh cKO parasites were stained with Lysosensor Blue DND-167 (LSB) or genetically engineered to express endogenous mNG-tagged proteins of interest. Shown are representative live fluorescence micrographs. A, C, D, and a: V-ATPase subunits; CRT: chloroquine resistance transporter; PM2: plasmepsin 2. (Scale bars, 5 µm.)
Fig. 2.
Fig. 2.
Loss of V-ATPase subunit B causes vacuolar deacidification and parasite death. (A) RAP-induced excision of loxP-flanked genomic DNA in B cKO and B-mCh cKO parasites. Parasites were treated with DMSO/RAP from the ring stage onward. Genomic DNA was harvested at the end of the cycle and subjected to diagnostic PCR5 as depicted in Fig. 1B. (B and C) RAP-induced loss of subunit B protein. B-mCh cKO parasites were treated as in (A). (B) Western blot of parasite extracts and (C) live fluorescence microscopy. DNA, Hoechst 33342. (D and E) Subunit B–deficient parasites arrest intraerythrocytic development. Shown are (D) Giemsa-stained parasites throughout the course of one cycle and (E) population growth dynamics over three cycles. Mean ± SD; two-way ANOVA; n = 3. (F and G) Loss of subunit B causes mislocalization of subunit C but not a. B-mCh cKO parasites expressing mNG-tagged subunits C (F) and a (G) were treated with DMSO/RAP from 18 h post invasion onward and imaged live at the schizont stage. Images are representative of >50 analyzed cells per condition. Transects (white arrows) spanning DV lumen and parasite cytoplasm (Cyt) were used to generate mNG intensity profiles. (H and I) The absence of subunit B causes DV deacidification. B-mCh cKO parasites expressing PM2 fused to SEP were treated and recorded as in (F). (H) Representative micrographs and (I) quantification of vacuolar SEP fluorescence as raw integrated density (RawIntDen). B11, control for autofluorescence. Individual and mean values (bars); paired t test; n = 99 parasites from three experiments. *P < 0.05; ***P < 0.001. (Scale bars, 5 µm.)
Fig. 3.
Fig. 3.
The absence of V-ATPase subunit B impairs intravacuolar hemoglobin release and heme sequestration. (AC) DV swelling and reduced hemozoin motility upon loss of subunit B. B-mCh cKO parasites expressing CRT-mNG were treated with DMSO/RAP from 18 h post invasion onward and imaged live at the schizont stage. (A) Representative fluorescence micrographs. DNA, Hoechst 33342. (B) Fraction of parasites displaying hemozoin motility. n = 5. (C) CRT-mNG-delineated area. n = 180 parasites from three experiments. Individual and mean values (bars); paired t test. (D and E) The swollen DV of subunit B–deficient parasites contains native hemoglobin. B-mCh cKO parasites were (D) visualized by Giemsa staining or (E) released by saponin and subjected to western blot. Parental B11 parasites were further treated with protease inhibitor E64 (21.7 µM). Hb, hemoglobin α. (F) Western blot of B-mCh cKO parasites expressing PM2-mNG. The mNG signal is predominantly associated with a band of ~28 kDa, corresponding to mNG alone. Unprocessed PM2-mNG (~78 kDa) was not detected. (G) Transmission electron micrographs of B-mCh cKO parasites. Note the accumulation of intra-DV vesicles (zoomed region, dashed white frame). In 9% of DMSO18h- (n = 32) and 84% of RAP18h-treated parasites (n = 51), the hemozoin-containing DV matrix displayed an electron density comparable to that of the RBC cytoplasm. (H and I) Subunit B–deficient parasites display elevated porphyrin fluorescence, which depends on hemoglobin catabolism. B cKO parasites were treated as in (E) and imaged live. (H) Representative micrographs and (I) quantification of DV autofluorescence as mean fluorescence intensity (MFI). Individual and mean values (bars); one-way ANOVA and Tukey’s multiple comparisons test; n = 180 parasites from three experiments. n.s., nonsignificant; *P < 0.05; **P < 0.01; ***P < 0.001. All scale bars, 5 µm except panel G (1 µm).
Fig. 4.
Fig. 4.
The V-ATPase V0 sector stabilizes the DVM independent of proton translocation. (A) Subunit a–deficient parasites arrest intraerythrocytic development. a-mCh cKO parasites were treated with DMSO/RAP from the ring stage onward and visualized by Giemsa staining throughout the course of one cycle. (B and C) DVM fragmentation upon loss of subunit a. a-mCh cKO parasites expressing CRT-mNG (B) or PM2-mNG (C) were treated with DMSO/RAP from 18 h post invasion onward and imaged live at the schizont stage. DNA, Hoechst 33342. (D) DIC images of subunit a–deficient parasites showing different degrees of hemozoin scattering. (E) Quantification of DV fragmentation in a-mCh cKO and B-mCh cKO parasites expressing CRT-mNG. Individual and mean values (bars); n.s., nonsignificant; ***P < 0.001; paired t test; n = 5. (F) Transmission electron micrographs of a-mCh cKO parasites. Dashed white frame, zoomed region. Arrowhead, hemozoin in tubular DVM feature. (G) DVM fragmentation upon loss of subunit c. c cKO parasites expressing CRT-mNG were treated and imaged as in B. (H and I) Deletions of subunits a and c cause V1 disassembly. c cKO (H) and a-mCh cKO parasites (I) expressing mNG-tagged subunits B or C, respectively, were treated as in B and imaged live. Transects (white arrows) spanning DV lumen and parasite cytoplasm (Cyt) were used to generate mNG intensity profiles. (J) DVM localization of subunit a in subunit c–deficient parasites. (K) Confocal time-lapse microscopy of a RAP18h-treated c cKO + crt-mNG parasite. Average CRT-mNG intensity projections alongside a single DIC z-section. Numbers, elapsed time since first recording (hours:minutes). Arrowheads from left to right: DVM collapsing; focal DVM accumulation; DVM protruding; DVM fragment; mislocalized hemozoin. All scale bars, 5 µm except panel F (1 µm).
Fig. 5.
Fig. 5.
V-ATPase activity does not modulate parasite susceptibility toward DV-targeted antimalarials. (A) Delayed induction of subunit B deletion allows completion of the intraerythrocytic cycle and reinvasion. Ring-stage cultures were inoculated at 1% parasitemia and treated with DMSO/RAP from 20 h post invasion onward. Shown is the SYBR Gold fluorescence of synchronized B cKO cultures 72 h post invasion. Noninfected red blood cell cultures were used for background correction. Violin plots including median (fat bars) and quartile values (thin bars); paired t test; n = 63 cultures from three experiments. (BH) Dose–response curves of B cKO parasites in the presence of varying concentrations of (B) bafilomycin A1 (BafA1), (C) concanamycin A (ConA), (D) pyrimethamine (Pyr), (E) dihydroartemisinin (DHA), (F) chloroquine (CQ), (G) amodiaquine (AQ), or (H) mefloquine (MQ) supplied 20 h post invasion. Parasites were treated and DNA quantified as described in A. Fluorescence was normalized to the lowest non-inhibitory drug concentrations. Mean ± SEM; n = 3. (I) IC50 values inferred from the dose–response curves in (BH). The fold-change in sensitivity is expressed as the quotient of IC50 values from DMSO20h- and RAP20h-treated parasites. Paired t test; n = 3. (J) Fixed ratio isobologram analysis of the interactions of CQ with BafA1 and ConA. FIC values were obtained from serial dilutions of 5:0, 4:1, 3:2, 2:3, 1:4, and 0:5 drug ratios. Mean ± SEM; n = 3. n.s., nonsignificant; *P < 0.05; **P < 0.01.
Fig. 6.
Fig. 6.
Impact of DV deacidification on intravacuolar drug accumulation. (A and B) Normal Fluo-CQ import in subunit B–deficient parasites. (A) Live fluorescence micrographs of DMSO18h- and RAP18h-treated B-mCh cKO parasites at the schizont stage incubated in the presence of 500 nM Fluo-CQ. (B) Quantification of vacuolar Fluo-CQ fluorescence as raw integrated density (RawIntDen). Individual and mean values (bars), corrected for mean intensity of unstained controls; paired t test; n = 99 parasites from three experiments. (C) [3H]CQ uptake by B cKO parasites. Schizont-infected RBCs were incubated in the presence of [3H]CQ and the ratio of intracellular versus extracellular [3H]CQ was determined over time. Mean ± SEM; Two-way ANOVA; n ≥ 4. (D and E) Pharmacological V-ATPase inhibition deacidifies the DV matrix. pm2-sep reporter parasites at the schizont stage were treated with 61 nM concanamycin A (ConA) or vehicle only for 30 min. (D) Live fluorescence micrographs and (E) quantification of vacuolar SEP fluorescence. B11, control for autofluorescence (dashed line). pH estimates obtained through calibration are indicated (SI Appendix, Fig. S10). Individual and mean values (bars); paired t test; n = 99 parasites from three experiments. (F and G) Live fluorescence micrographs (F) and quantification (G) of vacuolar Fluo-CQ fluorescence in the DV of B11 parasites treated with 61 nM ConA or vehicle only for 30 min. Individual and mean values (bars); paired t test; n = 99 parasites from three experiments. (H and I) Impaired accumulation and accelerated efflux of [3H]CQ by ConA-treated B11 parasites. (H) Drug accumulation was determined after 5 and 30 min as in (C). ConA or vehicle was added together with [3H]CQ at the start of the experiment. Connected data points, paired observations; paired t test; n ≥ 6. (I) Infected RBCs preloaded for 15 min with [3H]CQ were incubated in the presence of 61 nM ConA or vehicle only. Intracellular drug concentrations were then determined over time and normalized to initial values. Mean ± SEM; two-way ANOVA; n ≥ 3. n.s., nonsignificant; *P < 0.05; **P < 0.01. (Scale bars, 5 µm.)

Comment in

References

    1. Matz J. M., Beck J. R., Blackman M. J., The parasitophorous vacuole of the blood-stage malaria parasite. Nat. Rev. Microbiol. 18, 379–391 (2020). - PubMed
    1. Aikawa M., Hepler P. K., Huff C. G., Sprinz H., The feeding mechanism of avian malarial parasites. J. Cell Biol. 28, 355–373 (1966). - PMC - PubMed
    1. Spielmann T., Gras S., Sabitzki R., Meissner M., Endocytosis in Plasmodium and Toxoplasma parasites. Trends Parasitol. 36, 520–532 (2020). - PubMed
    1. Matz J. M., Plasmodium’s bottomless pit: Properties and functions of the malaria parasite’s digestive vacuole. Trends Parasitol. 38, 525–543 (2022). - PubMed
    1. Lew V. L., Macdonald L., Ginsburg H., Krugliak M., Tiffert T., Excess haemoglobin digestion by malaria parasites: A strategy to prevent premature host cell lysis. Blood Cells Mol. Dis. 32, 353–359 (2004). - PubMed

Publication types

LinkOut - more resources