. 2023 Jul 3;15(7):evad134.
doi: 10.1093/gbe/evad134.

Parameter Estimation and Species Tree Rooting Using ALE and GeneRax

Affiliations

Parameter Estimation and Species Tree Rooting Using ALE and GeneRax

Tom A Williams et al. Genome Biol Evol. .

Abstract

ALE and GeneRax are tools for probabilistic gene tree-species tree reconciliation. Based on a common underlying statistical model of how gene trees evolve along species trees, these methods rely on gene vs. species tree discordance to infer gene duplication, transfer, and loss events, map gene family origins, and root species trees. Published analyses have used these methods to root species trees of Archaea, Bacteria, and several eukaryotic groups, as well as to infer ancestral gene repertoires. However, it was recently suggested that reconciliation-based estimates of duplication and transfer events using the ALE/GeneRax model were unreliable, with potential implications for species tree rooting. Here, we assess these criticisms and find that the methods are accurate when applied to simulated data and in generally good agreement with alternative methodological approaches on empirical data. In particular, ALE recovers variation in gene duplication and transfer frequencies across lineages that is consistent with the known biology of studied clades. In plants and opisthokonts, ALE recovers the consensus species tree root; in Bacteria-where there is less certainty about the root position-ALE agrees with alternative approaches on the most likely root region. Overall, ALE and related approaches are promising tools for studying genome evolution.

Keywords: comparative genomics; gene tree–species tree reconciliation; microbial evolution; phylogenetics.


Figures

<sc>Fig.</sc> 1.
Fig. 1.
The logic of probabilistic reconciliation, and how to interpret ALE output. Possible reconciliations of different gene trees, given a species tree and the extended Newick string representations for duplication, transfer, loss, and speciation events. The species tree's topology with node names (leaf names and node numbers) is depicted in gray, the gene tree in black (also depicted separately for each case in the top right corner). Evolutionary events needed to reconcile the gene and species trees are highlighted in different colors: red for gene loss, blue for gene duplication, green for gene transfer, and a black circle for speciation. Terminal nodes (leaves or tips) are drawn as black squares. (A) The gene tree topology is congruent with the species tree, so no evolutionary events are required to reconcile them. (B) The gene tree does not include sequences from species B and C, which can be explained by speciation and loss (SL) events on the species tree. (C) Gene duplication (D event) on the branch leading to E. (D) Transfer (T event) from branch number 7 to terminal branch B. (E) Transfer from branch 7 to branch B and duplication on branch B (DT event). (F) All three events at once: a transfer followed by a loss on branch 7 and a duplication on the receiver branch B abbreviated as DTL event. (G) The output file *.uml_rec generated by ALEml_undated for the gene tree–species tree reconciliation depicted in (F). The uml_rec file contains a summary of the observed evolutionary events, in the case of (F) one duplication, one transfer, three losses, and three speciations. After this, a list of Newick strings for each sampled reconciled gene tree follows, in the format shown beneath (A)–(F). The uml_rec file ends with a description of the frequency of observed events per branch and with other branchwise statistics: branch category, branch name or numeric ID, duplications, transfers, losses, originations, copies, singletons and presence. These events can be summarized (e.g., summed per-branch over all gene families) to compute the total number of events of each type on a branch. We provide scripts to tabulate these summaries in the accompanying Github repository (https://github.com/AADavin/ALEtutorial).
<sc>Fig.</sc> 2.
Fig. 2.
ML estimation of duplication (δ), transfer (τ), and loss (λ) parameters in ALE is robust to the starting values used in the calculation. We sampled 100 gene families randomly from the dataset of Coleman et al. (2021), then estimated δ, τ, and λ parameters 100 times for each family, starting the ML optimization from random initial seeds each time. The plot shows the mean (x axis) and SD (y axis) of the parameter estimates. The solid line corresponds to SD = mean, while the dashed line denotes SD = 1% of the mean. The results show that δ, τ, and λ parameter estimates are robust to the starting seed values, with SD < mean (typically, SD << mean) in all but a single case (discussed below). The mean SD of the gene family likelihoods across these 100 families was 0.00014 (median 0.0) log-likelihood points. For the single outlier (the loss rate estimated for one family), the mean λ parameter is 0.0046 and the SD is 0.046; for 99/100 replicates, λ ∼ 0 (1 × 10⁻¹⁰) with log-likelihood −18.91, whereas in one replicate λ ∼ 0.46 and log-likelihood −18.77, suggesting the optimization algorithm failed to find the ML parameter configuration in this single case.
<sc>Fig.</sc> 3.
Fig. 3.
Reconciliation-based estimates of gene transfer, duplication, and loss in the bacterial (Coleman et al. 2021) and opisthokont (Bremer et al. 2022) datasets. ALE reconciliation output files contain a variety of parameter values and inferences, and understanding what each represents is key to interpreting the results. (AC) Branchwise estimates of the number of gene duplication, transfer, and loss events in the bacterial and opisthokont datasets. As expected, transfers greatly outnumber duplications in Bacteria, while the numbers of events are more balanced in the opisthokont dataset. Single-copy marker genes in opisthokonts have no inferred duplications, and indeed few transfer, or loss events. (DF) δ, τ, and λ parameters for each gene family in the bacterial and opisthokont datasets. While genome dynamics are reflected in the distributions of per-family parameter values (e.g., τ is generally much higher in bacteria than opisthokonts), the between-lineage patterns are less clear because the parameter distributions also reflect an enormous variation in propensity for transfer, duplication, and loss across gene families. Note that parameter values cannot be interpreted as numbers of events, but describe relative probabilities within each gene family. (G) Given a species tree and a set of reconciled gene trees, branchwise verticality can be calculated as the number of occurrences of vertical evolution from the ancestral to descendant node, divided by the sum of vertical and horizontal transfer events along the branch (Coleman et al. 2021). Based on ALE estimates, we find that opisthokonts have much higher verticality than Bacteria, as expected (Boto 2014; Ocaña-Pallarès et al. 2022). (H) The per-branch ratio of transfer to duplication events inferred by ALE; this is a natural comparator of the per-genome counts of transfer and duplication events reported in previous analyses. As expected, T/D is higher in Bacteria than opisthokonts. Note that T/D is misleading for the opisthokont single-copy orthologous genes because no duplications were inferred in any of the 117 genes in this set. (I) The familywise ratio of τ and δ parameter values. This metric is highly variable, both due to biological variation in transfer and duplication frequencies across gene families (Nagies et al. 2020), but also simply because dividing by very low δ parameter values is misleading (note that τ/δ is often very high simply because δ is close to 0; see circled region in [I]). Note that (H) and (I) were conflated in Bremer et al. (2022), leading the authors to conclude that ALE-based ratios of transfer and duplication were unrealistic (see supplementary text, Supplementary Material online for further discussion).
<sc>Fig.</sc> 4.
Fig. 4.
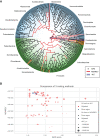
Agreement between reconciliations, branch lengths, and a nonreversible substitution model on the position of the bacterial root. (A) An unrooted cladogram of Bacteria indicating root support from ALE, MAD, and NONREV + G. Terrabacteria are highlighted in green, Gracilicutes in blue. For the likelihood-based methods, root positions that could not be rejected by an AU test (P < 0.05) are indicated. An AU test using ALE log-likelihoods rejected all but three of the internal branches as a plausible root position, whereas NONREV + G log-likelihoods were more equivocal. This might be because the ALE analysis makes use of more data (11,272 gene families compared to a 62-gene concatenation). For the MAD analysis, we plot the nodes with the 10% lowest (best) AD scores. (B) Agreement between MAD scores, ALE reconciliation log-likelihoods, and NONREV + G log-likelihoods for the internal nodes of the bacterial species tree; scores from the three methods are significantly correlated (see main text).

Similar articles

Cited by

References

    1. Aouad M, et al. 2022. A divide-and-conquer phylogenomic approach based on character supermatrices resolves early steps in the evolution of the Archaea. BMC Ecol Evol. 22(1):1. - PMC - PubMed
    1. Bansal MS, Kellis M, Kordi M, Kundu S. 2018. RANGER-DTL 2.0: rigorous reconstruction of gene-family evolution by duplication, transfer and loss. Bioinformatics 34(18):3214–3216. - PMC - PubMed
    1. Battistuzzi FU, Blair Hedges S. 2009. A major clade of prokaryotes with ancient adaptations to life on land. Mol Biol Evol. 26(2):335–343. - PubMed
    1. Battistuzzi FU, Feijao A, Blair Hedges S. 2004. A genomic timescale of prokaryote evolution: insights into the origin of methanogenesis, phototrophy, and the colonization of land. BMC Evol Biol. 4:44. - PMC - PubMed
    1. Bettisworth B, Stamatakis A. 2021. RootDigger: a root placement program for phylogenetic trees. BMC Bioinformatics 22:225. - PMC - PubMed

Publication types